Abstract
Background
Ewing sarcoma, the second most frequent bone tumor in children and adolescents, is often presented with localized disease or metastatic-related symptoms. In this study, we aim to construct and validate a nomogram for patients with Ewing sarcoma to predict the 3- and 5-year overall survival (OS) based on the Surveillance, Epidemiology, and End Results (SEER) database.
Methods
Demographic and clinic pathological characteristics of patients with Ewing sarcoma diagnosed between 2010 and 2015 were extracted from SEER database. Univariate and multivariate Cox analyses were carried out to identify the independent characteristics. The independent factors were further included into the construction of a nomogram. Finally, c-index and calibration curves were used to validate the nomogram.
Results
A total of 578 patients were enrolled into our analysis. The results of univariate Cox analysis showed that age, 7th AJCC stage, 7th AJCC T stage, 7th AJCC N stage, 7th AJCC M stage, metastatic status to lung, liver and bone were significant factors. Multivariate Cox analysis was performed and it confirmed age, N stage and bone metastasis as independent variables. Next, a nomogram was constructed using these independent variables in prediction to the 3- and 5-year OS. Furthermore, favorable results with c-indexes (0.757 in training set and 0.697 in validation set) and calibration curves closer to ideal curves indicated the accurate predictive ability of this nomogram.
Conclusions
The individualized nomogram demonstrated a good ability in prognostic prediction for patients with Ewing sarcoma.
Keywords: Nomogram, SEER, Ewing sarcoma, Overall survival
Background
Ewing sarcoma, the second most frequent bone tumor in children and adolescents, is often presented with localized disease or metastatic-related symptoms [1]. There are several clinical parameters influencing the survival of patients with Ewing sarcoma. Age, tumor stage, tumor location, metastatic disease, chemotherapy and surgery have been found to have impacts on overall survival (OS) in patients with Ewing sarcoma [2–7]. The aim of this study is to integrate prognostic parameters into analysis and predict outcomes in patients with Ewing sarcoma.
As a statistical prognostic model, the nomogram represents a pattern of graph, in which variables are given marks, and therefore it easily assesses the probability of a certain event, in comparison with traditional evaluation standards [8]. In recent years, this model has been widely applied as the increased need of individualized medicine in a great variety of tumors [9–12]. Consequently, in the present study, we extracted data in patients with Ewing sarcoma from the Surveillance, Epidemiology, and End Results (SEER) database, to construct and validate a nomogram for predicting OS.
Methods
Study population
The SEER database provides demographic and clinical pathologic information of patients in the United States. Data in this study were further obtained from the SEER 18 Regs (1973–2015 varying). Patients who were included into the analysis would meet the following criteria: Ewing sarcoma cases (histological code 9260/3) diagnosed from 2010 to 2015, only one primary tumor in “bones and joints”. Cases diagnosed made by death certificate or autopsy were excluded from our analysis. The variables in our research included age, race, sex, 7th AJCC stage, 7th AJCC T stage, 7th AJCC N stage, 7th AJCC M stage, and metastatic status to lung, brain, liver and bone. Overall survival was defined as the period from diagnosis to death or time of the last follow-up.
Nomogram construction
The patients were divided into a training set (n = 406) and a validation set (n = 172) by performing the package of caret (Classification and Regression Training) in R version 3.6.1. The nomogram construction was based on the analysis in the training set. To identify factors related to prognosis, univariate and multivariate Cox proportional hazards regression analysis were performed. The results of multivariate Cox regression analysis were further used to formulate the nomogram by performing rms package in R version 3.6.1.
Nomogram validation
Two criteria, concordance index (c-index) and the calibration curve, were used to validate the nomogram model in both the training and the validation sets. C-index, a value range between 0 and 1, is to assess performance of the model. The larger c-index (> 0.70) is, the better performance the model has [10]. Calibration curves closer to ideal ones were thought to have the accurate predictive ability of this nomogram [11].
Statistical analysis
All statistical analyses were performed in R 3.6.1 (http://www.Rproject.org). P < 0.05 was considered statistically significant. The nomogram construction was based on Cox proportional hazard regression models. Kaplan-Meier method was used to display OS curves by survival and survminer packages in R 3.6.1.
Results
Demographics and clinic pathological characteristics of the training and validation sets
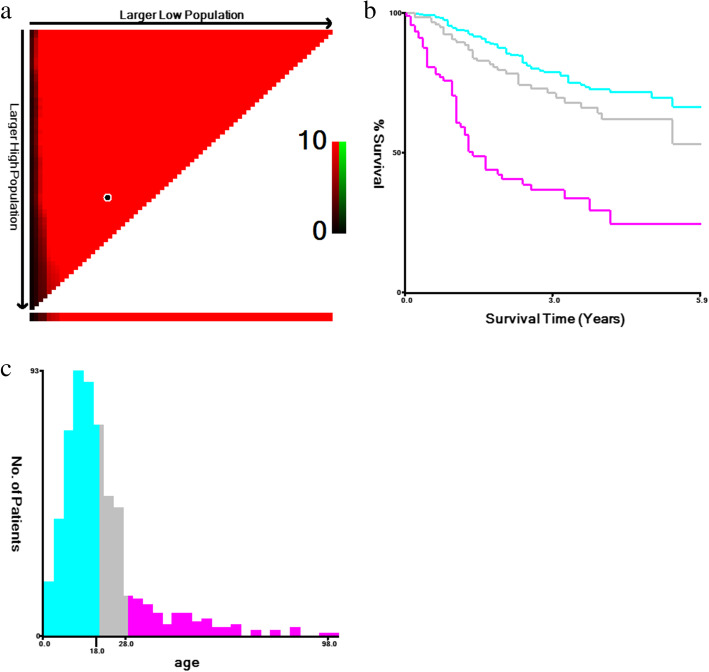
A total of 578 patients with Ewing sarcoma from the SEER database diagnosed from 2010 to 2015 were incorporated into the present study. The value of age was transformed into three categorical variables: ≤18, 19–27 and ≥ 28 years by performing X-tile (Fig. 1). As Table 1 showed, the demographic and clinicopathological characteristics of these two sets were similar.
Fig. 1.
Identification of optimal cutoff values of age of diagnosis via X-tile analysis. a The vertical axis represents all possible high OS populations, with the size of the high OS population increasing from top to bottom. The horizontal axis represents all possible low OS populations, with the size of the low OS population increasing from left to right. Coloration of the plot represents the strength of the association at each division, ranging from low (dark, black) to high (red). b Kaplan-Meier survival curves of three age groups. c The histogram of three age groups
OS, overall survival.
Table 1.
Demographics and clinicopathological characteristics of patients with Ewing sarcoma
| Characteristics | Training set(n = 406) | Percent (%) | Validation set(n = 172) | Percent (%) |
|---|---|---|---|---|
| Number of patients | Number of patients | |||
| Age (years) | ||||
| ≤ 18 | 248 | 61.1 | 107 | 62.2 |
| 19–27 | 89 | 21.9 | 38 | 22.1 |
| ≥ 28 | 69 | 17.0 | 27 | 15.7 |
| Sex | ||||
| Male | 250 | 61.6 | 104 | 60.5 |
| Female | 156 | 38.4 | 68 | 39.5 |
| Race | ||||
| White | 344 | 84.7 | 155 | 90.1 |
| Black | 18 | 4.5 | 6 | 3.5 |
| Others/unknown | 44 | 10.8 | 11 | 6.4 |
| stage | ||||
| II | 212 | 52.1 | 88 | 51.2 |
| III | 6 | 1.5 | 1 | 0.6 |
| IV | 141 | 34.7 | 57 | 33.1 |
| Others/unknown | 47 | 11.7 | 26 | 15.1 |
| T stage | ||||
| T0-T1 | 165 | 40.6 | 59 | 34.3 |
| T2 | 143 | 35.2 | 67 | 39.0 |
| T3 | 21 | 5.2 | 8 | 4.6 |
| Tx | 77 | 19.0 | 38 | 22.1 |
| N stage | ||||
| N0 | 345 | 85.0 | 147 | 85.5 |
| N1 | 28 | 6.9 | 12 | 7.0 |
| Nx | 33 | 8.1 | 13 | 7.5 |
| M stage | ||||
| M0 | 274 | 67.5 | 117 | 68.0 |
| M1 | 132 | 32.5 | 55 | 32.0 |
| Bone metastasis | ||||
| Yes | 56 | 13.8 | 26 | 15.1 |
| No/unknown | 350 | 86.2 | 146 | 84.9 |
| Brain metastasis | ||||
| Yes | 4 | 1.0 | 2 | 1.2 |
| No/unknown | 402 | 99.0 | 170 | 98.8 |
| Liver metastasis | ||||
| Yes | 4 | 1.0 | 2 | 1.2 |
| No/unknown | 402 | 99.0 | 170 | 98.8 |
| Lung metastasis | ||||
| Yes | 71 | 17.5 | 37 | 21.5 |
| No/unknown | 335 | 82.5 | 135 | 78.5 |
Identification of prognostic factors in the training set
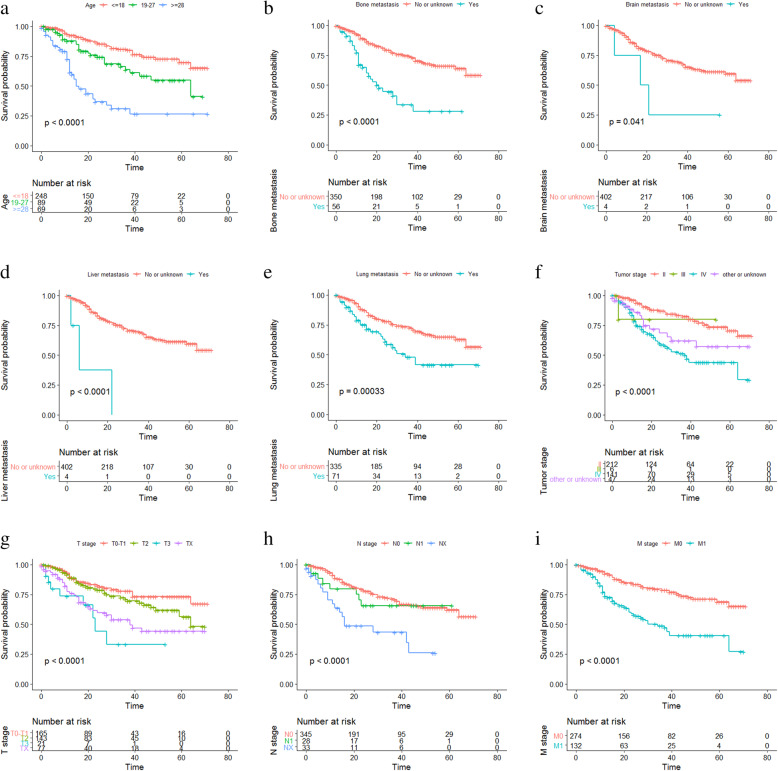
Univariate Cox analysis was carried out to work out the effect of demographics and clinic pathological characteristics on survival outcomes. As shown in Table 2, age, 7th AJCC stage, T stage, M stage, N stage, and the metastatic status to the liver, lung and bone were risk factors in patients with Ewing sarcoma. Multivariate Cox analysis was further performed and suggested that age, N stage and bone metastasis were independent prognostic factors for OS. In addition, Kaplan-Meier curve analysis was used to verify the prognostic abilities of these factors (Fig. 2a-j), indicating that longer OS was related to younger age (p < 0.0001), lower tumor stage (p < 0.0001), lower M stage (p < 0.0001), lower T stage (p < 0.0001), lower N stage (p < 0.0001), no metastasis to the bone and liver (P < 0.0001), no metastasis to the brain (P = 0.041), no metastasis to the lung (P = 0.00033). Gender (P = 0.9) and race (P = 0.26) had no significant impact on OS (Additional file 1).
Table 2.
Hazard ratio of overall survival for patients with Ewing sarcoma based on Cox regression
| Characteristics | Univariate analysis | 95% CI | P value | Multivariable analysis | 95% CI | P value |
|---|---|---|---|---|---|---|
| Hazard ratio | Hazard ratio | |||||
| Age (years) | ||||||
| ≤ 18 | Reference | Reference | ||||
| 19–27 | 1.928 | 1.200–3.097 | 0.007 | 1.778 | 1.092–2.895 | 0.021 |
| ≥ 28 | 5.324 | 3.434–8.254 | <0.001 | 5.145 | 3.231–8.192 | <0.001 |
| Sex | ||||||
| Male | Reference | Not included | ||||
| Female | 1.026 | 0.700–1.502 | 0.897 | |||
| Race | ||||||
| White | Reference | Not included | ||||
| Black | 1.828 | 0.887–3.767 | 0.102 | |||
| Others/unknown | 1.075 | 0.560–2.066 | 0.827 | |||
| stage | ||||||
| II | Reference | Reference | ||||
| III | 2.022 | 0.276–14.793 | 0.488 | 2.545 | 0.289–28.446 | 0.400 |
| IV | 3.266 | 2.142–4.977 | <0.001 | 1.100 | 0.117–10.312 | 0.933 |
| Others/unknown | 2.144 | 1.168–3.937 | 0.014 | 1.195 | 0.484–2.945 | 0.699 |
| T stage | ||||||
| T0-T1 | Reference | Reference | ||||
| T2 | 1.384 | 0.857–2.234 | 0.184 | 1.284 | 0.769–2.144 | 0.340 |
| T3 | 3.905 | 1.845–8.264 | <0.001 | 1.367 | 0.558–3.347 | 0.494 |
| Tx | 2.558 | 1.565–4.181 | <0.001 | 1.453 | 0.731–2.888 | 0.286 |
| N stage | ||||||
| N0 | Reference | Reference | ||||
| N1 | 1.335 | 0.646–2.758 | 0.436 | 0.686 | 0.258–1.825 | 0.450 |
| Nx | 3.188 | 1.912–5.312 | <0.001 | 3.392 | 1.848–6.224 | <0.001 |
| M stage | ||||||
| M0 | Reference | Reference | ||||
| M1 | 2.992 | 2.055–4.356 | <0.001 | 1.981 | 0.205–19.147 | 0.555 |
| Bone metastasis | ||||||
| No/unknown | Reference | Reference | ||||
| Yes | 3.476 | 2.271–5.320 | <0.001 | 2.309 | 1.315–4.056 | 0.004 |
| Brain metastasis | ||||||
| No/unknown | Reference | Not included | ||||
| Yes | 3.087 | 0.979–9.735 | 0.054 | |||
| Liver metastasis | ||||||
| No/unknown | Reference | Reference | ||||
| Yes | 8.918 | 2.801–28.390 | <0.001 | 2.861 | 0.651–12.564 | 0.164 |
| Lung metastasis | ||||||
| No/unknown | Reference | Reference | ||||
| Yes | 2.121 | 1.393–3.227 | <0.001 | 1.226 | 0.699–2.148 | 0.477 |
Fig. 2.
Kaplan-Meier survival curves of OS. Kaplan-Meier survival curves based on a age, b bone metastasis, c brain metastasis, d liver metastasis, e lung metastasis, f tumor stage, g T stage, h N stage, i M stage. OS, overall survival
Construction of the nomogram in the training set
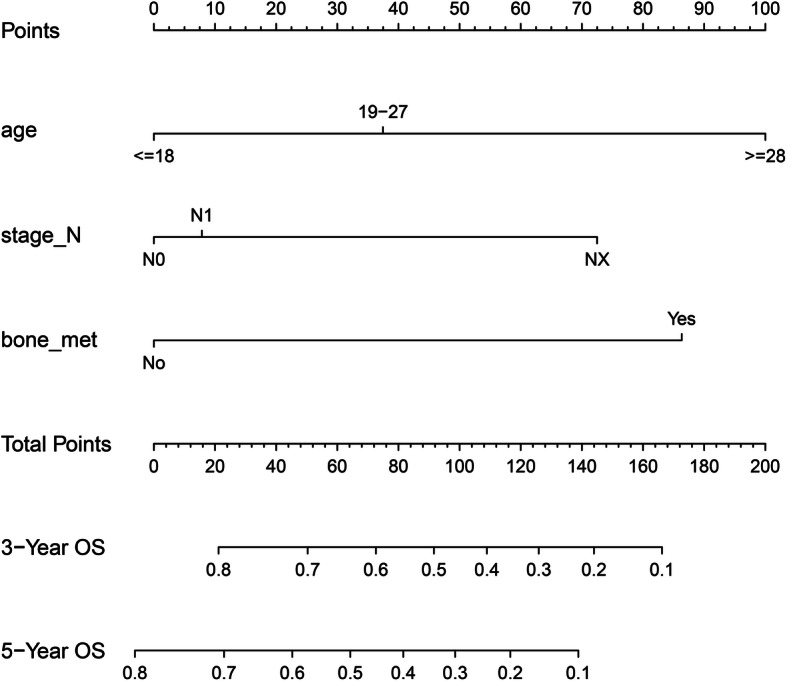
To explore a quantitative approach to predicting 3- and 5-year OS, a nomogram that included all the clinic pathological independent risk factors was formulated (Fig. 3). The scores of the items displayed in the nomogram should be added up. As it showed in Fig. 3, age contributed most to prognosis, followed by bone metastasis and N stage.
Fig. 3.

Nomogram for the prediction of 3- and 5-year OS in patients with Ewing sarcoma. OS, overall survival
Validation of predictive accuracy of the nomogram in the training and validation sets
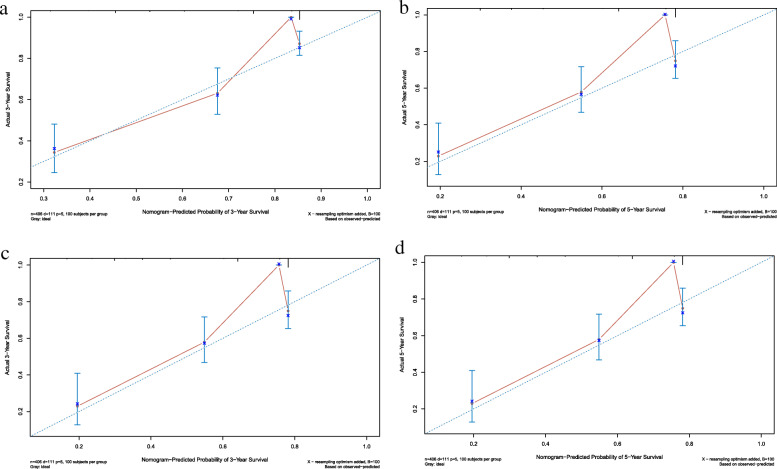
To validate the predictive accuracy of the nomogram, c-index and calibration curves were used to evaluate this model. C-indexes were observed in both the training (0.757) and validation sets (0.697), which suggested the good accuracy of this model. Next, the packages of rms, foreign and survival were performed in R 3.6.1, and high agreements between ideal curves and calibration curves were observed in both training and validation sets (Fig. 4a-d). These results revealed a good discrimination ability of the nomogram model.
Fig. 4.
Calibration curves of the nomogram predicting 3- and 5-year OS in patients with Ewing sarcoma. a Calibration curve of 3-year OS in the training cohort. b Calibration curve of 5-year OS in the training cohort. c Calibration curve of 3-year OS in the validation cohort. d Calibration curve of 5-year OS in the validation cohort. OS, overall survival
Discussion
In this study, we built an individualized nomogram, which integrated routinely available information such as age, N stage, and metastasis to bone, to predict OS in a large cohort of patients with Ewing sarcoma. C-indexes and calibration curves were used in the validation.
The results of Kaplan-Meier curve showed that gender had no significant impact on OS, which was consistent with that of S.E. Bosma, Friedman Danielle Novetsky and Ren Yingqing et al. [3, 4, 7], who found that female patients with Ewing sarcoma had similar OS to male patients. In the process of developing the nomogram, we found that age played a pivotal role in total points. Those aged over 28 had a high risk and a shorter OS (19–27 years: hazard ratio (HR) =1.928, 95% confidence interval (CI) = 1.200–3.097; ≥28 years: HR = 5.324, 95% CI = 3.434–8.254). This finding was consistent with the results of other studies [3–6], except S.E. Bosma et al., who indicated by a system review that the level of evidence for an association with OS for age was inconclusive.
In childhood and adolescence, tumor metastasizes to the liver, bone and lung at an early stage [13, 14]. Despite timely treatment, patients suffered from metastasis usually have a poor OS [15–17]. Accordingly, the multivariate Cox analysis results revealed that metastasis to the bone was another independent factor for OS, and patients with bone metastasis in our analysis lived shorter than those without metastasis (bone metastasis: HR = 3.476, 95% CI = 2.271–5.320). In addition, as we constructed the nomogram, N stage (AJCC, 7th ed.) was also taken into account. The applications of nomogram models in several tumors were found to have a better prognostic performance than the staging systems alone [10, 11]. In intrahepatic cholangiocarcinoma patients who underwent partial hepatectomy, Wang et al. [10] included both laboratory indices and demographic data in construction of nomogram, finding that this nomogram was more accurate in predicting OS than different staging systems. Wang et al. [11] combined staging system with demographic information of patients and then developed a nomogram, leading to a similar conclusion. Taken together, the nomogram combining demographics with staging system predicted OS in a more accurate way.
This study had some limitations. First, although c-indexes and calibration curves had been applied to validate the nomogram, the present research lacked external validation. More work should be done to strengthen the validity of the model. Second, the data of treatment were not collected, so that the predictive value of OS was not absolutely precise due to the fact that survival is affected partly by the treatment [18]. However, not including surgery, chemotherapy and radiotherapy in the nomogram could make this model more applicable to patients initially presenting to clinic who are waiting for evaluation from oncologists. Third, this model was constructed based on a retrospective cohort, which means that the inherent biases were unavoidable. Thus further prospective researchers are required for validation.
Conclusions
The nomogram demonstrated a good ability in prognostic prediction for patients with Ewing sarcoma.
Supplementary information
Acknowledgements
Not applicable
Abbreviations
- OS
Overall survival
- SEER
Surveillance, Epidemiology, and End Results
- c-index
Concordance index
- HR
Hazard ratio
- CI
Confidence interval
Authors’ contributions
ZZ was primarily responsible for the conception and the design of this retrospective study: ZZ developed the procedural techniques, application, inclusion of patients, and data acquisition (with support from JM). JW, LF, and MG were responsible for the analysis and the interpretation of the data. ZZ, JW, LF, JM and MG all participated in the drafting and revising of the manuscript. All authors read and approved the final manuscript.
Funding
There was no funding provided for this investigator-initiated retrospective analysis.
Availability of data and materials
The raw data in our study are in the SEER database and a registered account is required for requesting data. The datasets supporting the conclusions of this article are included within the article and its additional files.
Ethics approval and consent to participate
Consent to participate was not applicable because data from the SEER were anonymous, and the study was an observational one.
Consent for publication
Not Applicable.
Competing interests
The authors declare that they have no competing interests.
Footnotes
Publisher’s Note
Springer Nature remains neutral with regard to jurisdictional claims in published maps and institutional affiliations.
Supplementary information
Supplementary information accompanies this paper at 10.1186/s12891-020-03706-3.
References
- 1.Grunewald TGP, Cidre-Aranaz F, Surdez D, Tomazou EM, de Alava E, Kovar H, et al. Ewing sarcoma. Nat Rev Dis Primers. 2018;4(1):5. doi: 10.1038/s41572-018-0003-x. [DOI] [PubMed] [Google Scholar]
- 2.Liu HF, Wang JX, Zhang DQ, Lan SH, Chen QX. Clinical features and prognostic factors in elderly Ewing sarcoma patients. Med Sci Monit. 2018;24:9370–9375. doi: 10.12659/MSM.911882. [DOI] [PMC free article] [PubMed] [Google Scholar]
- 3.Ren Y, Zhang Z, Shang L, You X. Surgical resection of primary Ewing's sarcoma of bone improves overall survival in patients presenting with metastasis. Med Sci Monit. 2019;25:1254–1262. doi: 10.12659/MSM.913338. [DOI] [PMC free article] [PubMed] [Google Scholar]
- 4.Friedman DN, Chastain K, Chou JF, Moskowitz CS, Adsuar R, Wexler LH, et al. Morbidity and mortality after treatment of Ewing sarcoma: A single-institution experience. Pediatr Blood Cancer. 2017;64(11):e26562. 10.1002/pbc.26562. [DOI] [PubMed]
- 5.Seitz G, Urla C, Sparber-Sauer M, Schuck A, Vokuhl C, Blank B, et al. Treatment and outcome of patients with thoracic tumors of the Ewing sarcoma family: A report from the Cooperative Weichteilsarkom Studiengruppe CWS-81, −86, −91, −96, and -2002P trials. Pediatr Blood Cancer. 2019;66(Suppl 3):e27884. doi: 10.1002/pbc.27537. [DOI] [PubMed] [Google Scholar]
- 6.Fukushima T, Ogura K, Akiyama T, Takeshita K, Kawai A. Descriptive epidemiology and outcomes of bone sarcomas in adolescent and young adult patients in Japan. BMC Musculoskelet Disord. 2018;19(1):297. doi: 10.1186/s12891-018-2217-1. [DOI] [PMC free article] [PubMed] [Google Scholar]
- 7.Bosma SE, Ayu O, Fiocco M, Gelderblom H, Dijkstra PDS. Prognostic factors for survival in Ewing sarcoma: a systematic review. Surg Oncol. 2018;27(4):603–610. doi: 10.1016/j.suronc.2018.07.016. [DOI] [PubMed] [Google Scholar]
- 8.Iasonos A, Schrag D, Raj GV, Panageas KS. How to build and interpret a nomogram for cancer prognosis. J Clin Oncol. 2008;26(8):1364–1370. doi: 10.1200/JCO.2007.12.9791. [DOI] [PubMed] [Google Scholar]
- 9.Chen LT, Macarulla T, Blanc JF, Mirakhur B, Jong FA, Belanger B, et al. Nomogram for Predicting Survival in Patients Treated with Liposomal Irinotecan Plus Fluorouracil and Leucovorin in Metastatic Pancreatic Cancer. Cancers (Basel). 2019;11(8):1608. 10.3390/cancers11081068. [DOI] [PMC free article] [PubMed]
- 10.Wang Y, Li J, Xia Y, Gong R, Wang K, Yan Z, et al. Prognostic nomogram for intrahepatic cholangiocarcinoma after partial hepatectomy. J Clin Oncol. 2013;31(9):1188–1195. doi: 10.1200/JCO.2012.41.5984. [DOI] [PubMed] [Google Scholar]
- 11.Wang S, Yang L, Ci B, Maclean M, Gerber DE, Xiao G, et al. Development and validation of a Nomogram prognostic model for SCLC patients. J Thorac Oncol. 2018;13(9):1338–1348. doi: 10.1016/j.jtho.2018.05.037. [DOI] [PMC free article] [PubMed] [Google Scholar]
- 12.Chen D, Chen G, Jiang W, Fu M, Liu W, Sui J, et al. Association of the Collagen Signature in the tumor microenvironment with lymph node metastasis in early gastric Cancer. JAMA Surg. 2019;154(3):e185249. doi: 10.1001/jamasurg.2018.5249. [DOI] [PMC free article] [PubMed] [Google Scholar]
- 13.Ginsberg JP, Goodman P, Leisenring W, Ness KK, Meyers PA, Wolden SL, et al. Long-term survivors of childhood Ewing sarcoma: report from the childhood cancer survivor study. J Natl Cancer Inst. 2010;102(16):1272–1283. doi: 10.1093/jnci/djq278. [DOI] [PMC free article] [PubMed] [Google Scholar]
- 14.Grier HE, Krailo MD, Tarbell NJ, Link MP, Fryer CJ, Pritchard DJ, et al. Addition of ifosfamide and etoposide to standard chemotherapy for Ewing's sarcoma and primitive neuroectodermal tumor of bone. N Engl J Med. 2003;348(8):694–701. doi: 10.1056/NEJMoa020890. [DOI] [PubMed] [Google Scholar]
- 15.Balamuth NJ, Womer RB. Ewing's sarcoma. Lancet Oncol. 2010;11(2):184–192. doi: 10.1016/S1470-2045(09)70286-4. [DOI] [PubMed] [Google Scholar]
- 16.Krakorova DA, Kubackova K, Dusek L, Tomas T, Janicek P, Tucek S, et al. Advantages in prognosis of adult patients with Ewing sarcoma: 11-years experiences and current treatment management. Pathol Oncol Res. 2018;24(3):623–630. doi: 10.1007/s12253-017-0291-6. [DOI] [PubMed] [Google Scholar]
- 17.Gaspar N, Hawkins DS, Dirksen U, Lewis IJ, Ferrari S, Le Deley MC, et al. Ewing sarcoma: current management and future approaches through collaboration. J Clin Oncol. 2015;33(27):3036–3046. doi: 10.1200/JCO.2014.59.5256. [DOI] [PubMed] [Google Scholar]
- 18.Chen J, Jiang Q, Zhang Y, Yu Y, Zheng Y, Chen J, et al. Clinical features and long-term outcome of primary intracranial Ewing sarcoma/peripheral primitive Neuroectodermal tumors: 14 cases from a single institution. World Neurosurg. 2019;122:e1606–e1e14. doi: 10.1016/j.wneu.2018.11.151. [DOI] [PubMed] [Google Scholar]
Associated Data
This section collects any data citations, data availability statements, or supplementary materials included in this article.
Supplementary Materials
Data Availability Statement
The raw data in our study are in the SEER database and a registered account is required for requesting data. The datasets supporting the conclusions of this article are included within the article and its additional files.


