

Abstract
The force–length relation is one of the most defining features of muscle contraction, and yet a topic of debate in the literature. The sliding filament theory predicts that the force produced by muscle fibres is proportional to the degree of overlap between myosin and actin filaments, producing a linear descending limb of the active force–length relation. However, several studies have shown forces that are larger than predicted, especially at long sarcomere lengths (SLs). Studies have been conducted with muscle fibres, preparations containing thousands of sarcomeres that make measurements of individual SL challenging. The aim of this study was to evaluate force production and sarcomere dynamics in isolated myofibrils and single sarcomeres from the rabbit psoas muscle to enhance our understanding of the theoretically predicted force–length relation. Contractions at varying SLs along the plateau (SL = 2.25–2.39 µm) and the descending limb (SL > 2.39 µm) of the force–length relation were induced in sarcomeres and myofibrils, and different modes of force measurements were used. Our results show that when forces are measured in single sarcomeres, the experimental force–length relation follows theoretical predictions. When forces are measured in myofibrils with large SL dispersions, there is an extension of the plateau and forces elevated above the predicted levels along the descending limb. We also found an increase in SL non-uniformity and slowed rates of force production at long lengths in myofibrils but not in single sarcomere preparations. We conclude that the deviation of the descending limb of the force–length relation is correlated with the degree of SL non-uniformity and slowed force development.
Keywords: force–length relation, sarcomere length non-uniformity, myofibril, single sarcomere
1. Background
The sliding filament theory [1,2] with independent force generators [3,4] has been widely accepted to explain the mechanism of force production in striated muscles. Accordingly, the relative sliding of actin and myosin filaments causes shortening of the sarcomeres, governed by the turnover of myosin cross-bridges [4,5]. Among the best evidence for this mechanism of contraction is the relation between force production and sarcomere length (SL), which is a putative indicator of the degree of filament overlap. The force–length relation has been studied for many decades [6–10], but it has not been without controversy. Several studies have shown that, during activation, there is a substantial degree of SL non-uniformity within muscle fibres [6,11,12], which is associated with slowed force development—also called force ‘creep'—at long SLs [5,11]. Therefore, investigators have developed methods to isometrically clamp segment lengths of the muscle fibres during force development [5,7,8] and have used an extrapolated force value to avoid the ‘creep' effect [5]. These studies show that force production proportionally relies on the amount of filament overlap [5]. Other studies have used fixed-end experiments, in which individual sarcomeres can shorten at the expense of other sarcomeres that may lengthen. These studies measure the total active force produced by the fibres instead of extrapolated force values. With this method, researchers have found that the force produced by muscle fibres significantly exceeds those predicted by filament overlap along the descending limb of the force–length relation [7,8].
It is known that SL non-uniformity develops during muscle fibre activation [6,11,13]. SL non-uniformity has been used to explain force ‘creep', and force values that are larger than those predicted at long lengths during fixed-end contractions [7,8]. Accordingly, shorter sarcomeres within myofibrils produce stronger forces and stretch longer sarcomeres that are weaker due to less filament overlap. This non-homogeneity in SLs is often explained by an inherent instability that may be present along the descending limb of the force–length relation [14], although some studies argue that sarcomeres may be stable at long SLs [15–17]. To this day, the exact mechanism responsible for the force ‘creep' and the large forces produced at long SLs remains disputed. This gap in our understanding may be due to technical limitations—in muscle fibre preparations, an average of thousands of sarcomeres is used as an indication of SL, or segment lengths are held constant by a length-clamp technique [5,7,8,13].
In this study, we investigated the force–length relation in single sarcomeres and myofibrils containing varying numbers of sarcomeres. We developed a technique to isolate single sarcomeres, a preparation that, by definition, will not show length non-uniformities [10], while we can also select myofibrils with pre-determined numbers of sarcomeres. Comparing the two techniques allows for a detailed evaluation of the effects of SL non-uniformities on force production. We looked for a potential association between force and SL non-uniformity, and its possible effect on ‘creep' forces commonly found in muscle fibres activated at long SLs. We hypothesize that SL non-uniformities will be directly associated with the force ‘creep’ and force levels that are higher than those predicted by the classic force–length relation based on the average filament overlap.
2. Methods
(a). Preparation of myofibrils and sarcomere isolation
Myofibril preparations from rabbit psoas were obtained as previously done in our laboratory [18]. Briefly, small pieces of muscles (3–4 cm) were tied to wooden sticks, kept in a rigour solution for 3 h at 4°C, transferred to a rigour : glycerol (50 : 50) solution and stored overnight. The solution was replaced by new rigour : glycerol solution containing a protease inhibitor cocktail (Roche Diagnostics) and samples were stored in the freezer (−20°C) for 7 days. This protocol has been approved by the McGill University Animal Care Committee and complies with the guidelines of the Canadian Council on Animal Care.
On the day of the experiment, small sections of the muscle were transferred to a fresh rigour solution, left to defrost for 1 h at 4°C, and dissected into smaller pieces.
To obtain single myofibrils, the muscle portions were homogenized in rigour two times for 10 s at 10 000 rpm, two times for 7 s at 15 000 rpm, and two times for 4 s at 22 000 rpm (Advanced Homogenizing System 250; VWR). The homogenate was placed in a temperature-controlled experimental chamber (10°C) for 10 min to allow myofibrils to settle on the surface of a glass coverslip (thickness: 0.16–0.19 mm). The chamber was fixed on top of an inverted microscope (NIKON Eclipse TE 2000U) that achieves high levels of magnification (150 x ) through an oil immersion phase-contrast lens (Nikon plan-fluor, X100, numerical aperture 1.30). After the myofibrils settled, the surrounding solution was replaced with the relaxing solution to minimize the unwanted debris. A myofibril on the surface was selected based on its striation pattern for further mechanical experimentation.
(b). Solutions
The compositions of rigour, relaxing, and activating solutions used during this study are listed in table 1.
Table 1.
Composition of experimental solutions.
| rigour solution | relaxing solution | activating solution | |
|---|---|---|---|
| Tris (mM) | 50 | — | — |
| KCl (mM) | 100 | 70 | 50 |
| MgCl2 (mM) | 4 | 5 | 5 |
| EGTA (mM) | 10 | 7 | 7.2 |
| imidazole (mM) | — | 20 | 20 |
| ATP (mM) | — | 5 | 5 |
| CrP (mM) | — | 14.5 | 14.5 |
| pCa2+ | 9.0 | 4.5 | |
| pH | 7.0 | 7.0 | 7.0 |
| ionic strength (mM) | 110 | 93 | 77 |
(c). Microneedle production and calibration
Two microneedles were produced from glass capillary rods (5 µl calibrated pipettes; VWR) using a vertical pipette puller (KOPF 720, David Kopf Instruments). Calibration of the needles was done with a stepwise cross-bending method using a pre-calibrated atomic force cantilever (ATEC-CONTPt-20; Nanosensor; stiffness: 34.89 nN µm−1 calculated by scanning electron microscopy [10]), as previously done in our laboratory [19]. The experiments conducted with myofibrils used needle stiffness ranging between 28.5 nN µm−1 and 40.29 nN µm−1, and the experiments conducted with single sarcomeres used needle stiffness ranging between 154.49 nN µm−1 and 158.37 nN µm−1.
(d). Mechanical isolation and visualization of sarcomeres
The two microneedles were controlled by micromanipulators (Narishige NT-88-V3, Tokyo, Japan) and used to transversally pierce selected myofibrils parallel to the Z-lines. Single sarcomeres or myofibrils were lifted off the coverslip surface by 0.5–1.0 µm and visualized under high magnification (150 x ) (figure 1). Although isolating a single sarcomere is challenging, this preparation has been used reproducibly in our laboratory [10].
Figure 1.

Images of isolated sarcomeres and myofibrils held between two glass needles and visualized at high magnification (X100). (a) Plot profile of a single sarcomere matching the greyscale pattern of the sarcomere image, in which the A-band can be visualized. The two glass needles produce larger peaks at the beginning and end of the plots. (b) Myofibril with four sarcomeres in series before (top) and during (bottom) contraction. (c) Myofibril with 18 sarcomeres in series before (top) and during (bottom) contraction. (Online version in colour.)
(e). Sarcomere length and contractile force measurements
Individual sarcomeres could be identified through a phase-contrast microscope and a video was recorded of each contraction for subsequent analysis. Measurements of the cross-sectional area and SL were taken from a video snapshot using the software Fiji by ImageJ (National Institutes of Health). SL was defined as the difference between two adjacent Z-lines and was measured using a greyscale plot of the myofibril and a calibrated measuring tool from the software. Using the sofware's image tracking function, the two needles fixating the myofibril were tracked to establish the needle displacement. The total displacement (d) together with known needle stiffness (k) allowed for the calculation of the force (F) produced by a given preparation, according to the following formula:
The force values reflect the active forces produced by the sarcomeres and myofibrils; the total forces would be higher if the passive forces developed at long SLs were added to the calculation.
SL dispersion was defined as the absolute difference in length of each sarcomere within a myofibril and the average SL of that myofibril [16,20].
The analysis provides (i) the sarcomere dispersion for each sarcomere in a given myofibril, during each contraction induced at different average SLs, and (ii) the average SL dispersion of all myofibrils contracting at given SLs.
Naturally, SL dispersion was absent in single sarcomeres.
(f). Myofibril manipulation
Contraction of the myofibril was achieved by exchange of the surrounding relaxing solution with activating solution via a double-barrel pipette connected to a multichannel perfusion system (VC-6, Harvard Apparatus) [21]. This method allows for fast solution switching, enabling time-sensitive quantification of force production and the rate of force development.
(g). Experimental protocol
Individual sarcomeres or myofibrils were selected for mechanical experimentation. A given myofibril was set up at an average initial SL ranging from 1.6 µm to 4.0 µm, and successive contractions were induced. Force was allowed to develop until it reached a steady-state, before it was terminated. The same myofibril was set up at a different initial SL, and another contraction was induced. This was repeated at 3–12 different initial SLs in a randomized fashion. The obtained force readings produced a force–length relation for each sarcomere or myofibril tested during the experiments.
For a myofibril to be included in data analysis, the experimental force values had to be measured in both the theoretical plateau region (SL = 2.24–2.39 µm) and on the descending limb (SL = 2.39–3.87 µm) of the force–length relation [10,22]. Data points in both regions ensure proper normalization of the results after the experiments. Furthermore, two contractions at similar SLs (usually SL = 2.7 µm) were compared at the beginning and end of an experiment for control purposes. Only myofibrils that produced force differences of ≤5% between the first and last control contractions during the experiments were included in the dataset, to ensure that myofibrils did not lose contractile ability after several consecutive contractions. The initial passive forces observed at long SLs were not changed as a result of repeated contractions.
(h). Data analysis
We analysed single sarcomeres (figure 1a, n = 11), and myofibrils containing several sarcomeres in series, separated into two groups for comparison: short myofibrils containing 2–10 sarcomeres (figure 1b, n = 19) and long myofibrils containing ≥11 sarcomeres (figure 1c, n = 12). The differentiation of the three groups was for the purpose of comparing SL dispersion and its relation to the number of sarcomeres in series, while other variables investigated, focused on the comparison of single sarcomeres (n = 11) and myofibrils (n = 31). The rate of force development during contractions was calculated using an exponential one-phase association equation.
(i). Statistical analysis
The force–length relation for contractions developed along the descending limb (SL > 2.39 µm) was fitted with both a linear regression and a second-order polynomial equation for all experiments. The fits were then compared in each measurement—force developed by single sarcomeres, extrapolated forces measured by myofibrils, and total active forces developed by myofibrils—using a sum-of-square F test.
The rate of force development, and the SL dispersion, were compared across the three groups by a multiple regression analysis using SL as a continuous variable. Differences in the slopes of the fitted lines were evaluated. When the slopes were not different, we compared the elevations (positions) of the fitted lines across the three groups.
For all analyses, a level of significance of p ≤ 0.05 was set. The results that present mean values also show the standard errors of the mean (±SEM).
3. Results
(a). Force production and rate constants
Figure 1 shows a typical experimental set-up used in this study. Myofibrils with one (a), four (b), and 18 (c) sarcomeres are suspended between two pre-calibrated glass needles. The greyscale plot in 1a corresponds to the image of the single sarcomere above and shows the individual peaks produced by one sarcomere. This plot was used to determine SLs. Larger peaks at the beginning and end of the plot represent the two glass needles, while small peaks mark the beginning and end of the A-band. The bottom images in 1b and 1c show the contracted state of the myofibril above. The amount of SL non-uniformity is more apparent in the contraction of the myofibril with more sarcomeres in series (c) compared to the myofibril with fewer sarcomeres in series (b).
Analysis of the relative displacement of the two microneedles during contraction resulted in force traces, as shown in figure 2. In all panels of figure 2, the onset of the rise in force marks the time point at which the activation solution started to surround the sarcomere(s). After the rise phase, the force started to stabilize. The force values used for subsequent comparisons in this study were averaged over a 5 s period after the force stabilized. After a period of force stabilization, relaxation solution replaced the activation solution and the sarcomere(s) relaxed, seen as the return of force to baseline levels. We did not observe incomplete relaxation in the experiments of this study.
Figure 2.

Typical force traces during a contraction. (a) Force traces of a single sarcomere contracting from an initial SL (SLi) of 2.09 µm shortening to a final SL (SLf) of 1.65 µm (orange, i), and contracting from a SLi of 2.39 µm shortening to a final SL of 2.11 µm (red, ii); total active forces reached 120.49 nN µm−2 and 104.56 nN µm−2, respectively. Note the similarity of rates of force development in both contractions. (b) Force traces of a myofibril containing 12 sarcomeres in series contracting from a SLi of 2.27 µm shortening to a final SL of 2.20 µm (green, i) and contracting from a SLi of 2.79 µm shortening to a final SL of 2.47 µm (blue, ii); total active forces reached 83.27 nN µm−2 and 66.10 nN µm−2, respectively. The rate of force development is noticeably slower in the contraction induced at a SLi at 2.97 µm compared to the contraction induced at SLi 2.27 µm. (Online version in colour.)
We first evaluated the total force values produced during each contractile event at a given SL. Force values from contractions observed in this study were well within the range of those produced previously [10,21]. Single sarcomeres (n = 11) reached force values of up to 135.2 nN µm−2 while myofibrils with sarcomeres in series (n = 31) produced a maximal force of 113.6 nN µm−2. Figure 2a shows force traces of an individual sarcomere activated at an initial SL of 2.09 µm (orange, i) and 2.93 µm (red, ii). In this example, the contraction developed at the initial length of 2.09 µm—a length on the theoretical plateau region—produced a force of 120.49 nN µm−2. At a longer SL of 2.93 µm, on the theoretical descending limb, force was 13.2% lower than in the previous contraction, with a value of 104.56 nN µm−2. Figure 2b shows contractions of a myofibril with 12 sarcomeres in series that reached a force of 66.10 nN µm−2 and 83.27 nN µm−2 at SLs of 2.27 µm (green, i, plateau) and 2.97 µm (blue trace, ii, descending limb), respectively, showing a 20.6% decrease in force.
Next, we analysed the rate of force development of each contraction. Figure 2 compares contractions at two initial SLs in a single sarcomere (a) and a myofibril with 12 sarcomeres in series (b). Figure 2a shows that the single sarcomere produces similar rise phases during force development in both contractions, whereas the myofibril in 2b shows a noticeable change in the rate of force development between the two contractions; a steeper rise phase is seen in the contraction at 2.27 µm—on the theoretical plateau—compared to the contraction initiated at 2.97 µm, a SL on the theoretical descending limb.
Figure 3 shows the rate constant for force development during contractions conducted at various final SLs for single sarcomeres (red, top line), myofibrils with 2–10 sarcomeres in series (green), and myofibrils with ≥11 sarcomeres (black). The rate of force development was calculated using a one-phase association fit of the rise phase and force plateau for each contraction (details in figure 5a). When performing multiple regression analyses on the raw data, the results revealed that all groups present a negative slope, with lower rate constants at longer average SLs compared to shorter average SLs (p < 0.001 in the three lines; table 2). The slopes were not statistically different (p = 0.39), but had different elevations (p < 0.001), showing that, overall, the single sarcomeres had a faster rate constant of force development compared to the myofibrils.
Figure 3.
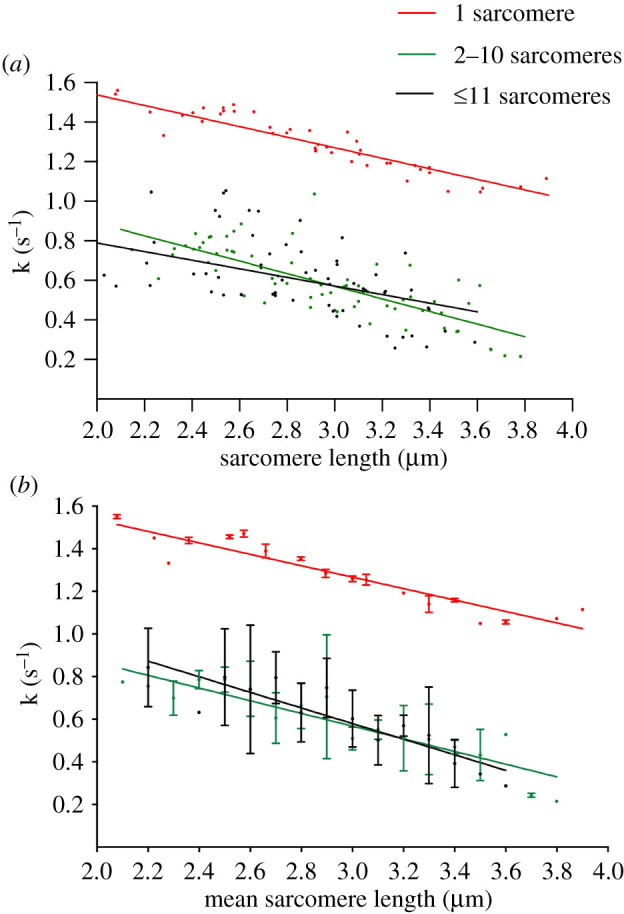
Rate constants of force development in single sarcomeres (red, top line), myofibrils with 2–10 sarcomeres (green), and myofibrils with ≥11 sarcomeres (black) using all data collected in our experiments. (a) All data points for rate constant values in the three groups. (b) Average values of rate constants obtained during similar final SLs. The trends in rate change with increasing SLs were fitted with linear regressions obtaining slopes of −0.29 ± 0.03 µm s−1 for single sarcomeres (red, r2 = 0.86), −0.30 ± 0.03 µm s−1 for 2–10 sarcomeres (green, r2 = 0.83), and −0.37 ± 0.05 µm s−1 for ≥11 sarcomeres (black, r2 = 0.81). (Online version in colour.)
Figure 5.

Trace of a myofibril with 13 sarcomeres in series, contracting at an initial SL of 3.1 µm. (a) The red trace shows the one-phase association fit, obtaining a rate constant of force development (k) of 0.57/s, and a value for the total active force obtained during the contraction (F) of 74.44 nN µm−2. (b) The method for defining force using the extrapolation method. The method uses two tangents: one along the initial rise phase and one along the span of the stabilization region of the contraction. The extrapolated force in this myofibril was 66.5 nN µm−2. (Online version in colour.)
Table 2.
A summary of minimum and maximum values of rate constants of force development, and the slopes of the linear regression fits. The SL at which the rate was reached is indicated in brackets in the rate columns. All values are presented as means ± SEM.
| group | min rate (s−1) | max rate (s−1) | slope (μm/s) |
|---|---|---|---|
| 1 sarcomere | 1.05 (at 3.60 µm) | 1.56 (at 2.09 µm) | −0.29 (r2 = 0.86) |
| 2–10 sarcomeres | 0.21 (at 3.78 µm) | 1.04 (at 2.91 µm) | −0.30 (r2 = 0.83) |
| 11+ sarcomeres | 0.26 (at 3.23 µm) | 1.05 (at 2.54 µm) | −0.37 (r2 = 0.81) |
Single sarcomeres reached a maximal rate of 1.56/s, while longer myofibrils produced a maximal rate of 1.05/s. The minimum values for rate constants show a similar difference, with single sarcomeres reaching 1.05/s, and myofibrils reaching 0.21/s (short) and 0.26/s (long). All values are listed in table 2.
(b). Sarcomere length dispersion
We measured SL dispersion within a myofibril to evaluate the degree of SL non-uniformity during contractions. SL dispersion was calculated as the difference between each individual SL in a myofibril and the average SL within the same myofibril. SL dispersion in a single sarcomere was considered constant (and equal to 1).
In figure 1c, an increase in SL non-uniformity can be seen in myofibrils; this result was confirmed when we averaged all results (figure 4). Linear fits of the dataset present positive slopes for both groups (p < 0.001, table 3), showing that short myofibrils and long myofibrils present a significantly larger dispersion when contracted at long average SLs compared to short average SLs (p < 0.01). Multiple regression analyses failed to detect a significant difference between the slopes of the three lines (p = 0.12), but the positions were different, with long myofibrils showing an overall larger SL dispersion than short myofibrils (p < 0.001), and both showing a larger dispersion than the relaxed myofibrils (p < 0.001). We combined both groups of myofibrils in the resting state, as preliminary analysis did not show a difference in SL non-uniformity before activation.
Figure 4.

Data in green (middle line) represents myofibrils with 2–10 sarcomeres in series. Data in black (top line) represents myofibrils containing ≥11 sarcomeres in series. Data in blue (bottom line) represents the SL dispersion from both groups while at rest. (a) Individual SL dispersions per myofibril, including all data from all preparations investigated in the study. (b) Average values of SL dispersion at a given final SL. The dataset of each group was fitted using a linear regression, obtaining slopes of 0.08 ± 0.01 (green, middle, r2 = 0.70) and 0.16 ± 0.01 (black, top, r2 = 0.94) for 2–10 sarcomeres, ≥11 sarcomeres, and all myofibrils in the relaxed state, respectively. (Online version in colour.)
Table 3.
A summary of minimum and maximum values of SL dispersion for each myofibril group, and the slopes of the linear fits. Values of dispersion during the contracted state, at the final SL (SLf), are listed for the two groups separately (myofibrils with 2–10 sarcomeres (green) and myofibrils with ≥11 sarcomeres (black)). Values of dispersion in the relaxed state (at SLi) are listed for all myofibrils combined (blue). The SL at which the dispersion was reached is indicated in brackets in the dispersion columns. All values are presented as means ± SEM.
| group | min average dispersion (μm) | max average dispersion (μm) | slope |
|---|---|---|---|
| 2–10 sarcomeres (at SLf) | 0.07 (at 2.6 µm) | 0.43 (at 3.5 µm) | 0.08 ± 0.01 (r2 = 0.70) |
| 11+ sarcomeres (at SLf) | 0.12 (at 2.0 µm) | 0.55 (at 3.0 µm) | 0.16 ± 0.01 (r2 = 0.94) |
| all myofibrils at SLi | 0.02 (at 2.7 µm) | 0.25 (at 3.0 µm) | 0.06 ± 0.01 (r2 = 0.31) |
The minimum values of SL dispersion were reached along the theoretical plateau of the force–length relation. The minimum dispersion in short myofibrils was 0.07 µm, while the values were slightly higher in long myofibrils at 0.12 µm. Maximum values of dispersion were obtained at longer SLs along the theoretical descending limb; short myofibrils showed a maximum dispersion of 0.43 µm while long myofibrils reached a value of 0.55 µm. All values are listed in table 3.
(c). The force–length relation
Each contraction produced by a sarcomere or myofibril was evaluated in two ways to explore the force ‘creep'. We used the extrapolation method originally developed by Gordon et al. [5] and compared the resulting values to the maximal active force obtained during the contractions.
Figure 5a shows the total active forces, FTo, in which the force value is obtained from a curve fit of the rise phase and the stabilization phase of a contractile event. Figure 5b shows the method of force extrapolation using two tangents: one along the rise phase and the other along the stabilization phase of the contraction. The extrapolated force, FEx, is taken at the intercept of the two tangents. In this example, when comparing the two forces at a SL of 3.1 µm, FEx (66.5 nN µm−2) is lower than FTo (74.44 nN µm−2).
The two methods of force calculation lead to different values for total forces along the descending limb in myofibrils with sarcomeres in series but not in single sarcomeres. Figure 6a shows the descending limb of single sarcomeres as a linear regression fit of all obtained force values at SLs greater than 2.39 µm (r2 = 0.65). When the values were fitted with a second-order polynomial equation, the coefficient of correlation was smaller (r2 = 0.50). A comparison between the two models showed that the linear fit was the preferred model (p = 0.02). All panels of figure 6 also shows the theoretical force–length relation based on filament lengths of the rabbit psoas [10]. As seen in figure 6a, the descending limb of single sarcomeres (red) resembles that of the theoretical relation (grey).
Figure 6.

The force–length relation of different groups investigated in this study. In all graphs, the broken grey lines represent the theoretical force–length relation based on filament lengths and relative overlap [10,23]. Forces were normalized, and only points on the theoretical descending limb (SL > 2.39 µm) were considered for the fits. (a) Single sarcomere force values and linear regression analysis (r2 = 0.65). The data were collected from 11 individual sarcomeres, using 2–3 contractions for each sarcomere. (b) The data and the curve fits for myofibrils with several sarcomeres in series. The black line (curved line) represents the total active forces, FTo, while the green line (straight line) shows force values obtained with the extrapolation method shown in figure 5, FEx. Total active forces were fit with a second-order polynomial (r2 = 0.84) and extrapolated forces with a linear regression (r2 = 0.80). The data were collected from 31 individual myofibrils, using 3–12 contractions for each myofibril. (c) Lines of best fit for the descending limb of all three groups are shown on one graph: single sarcomere data (red, long straight line), total active force data (black, curved line), and extrapolated force data (green, short straight line). (Online version in colour.)
Figure 6b shows total active forces (black, curved line) and extrapolated forces (green, straight line) evaluated in experiments with myofibrils. There was a statistical difference in the preferred model to fit the force evaluated by the two methods. The best fit for the descending limb of the FTo data was represented by a second-order polynomial fit (r2 = 0.84). The linear fit presented a smaller coefficient of correlation (r2 = 0.84). When the models were compared by the sum-of-squares F-test, they showed a significant difference (p < 0.001). The FEx data was best fit with a linear regression (r2 = 0.80) when compared to the second-order polynomial fit (r2 = 0.72); the difference between the models was also statistically different (p = 0.01). Figure 6b shows that the descending limb of FTo data deviates from the theoretical relation in a curved fashion, while the descending limb of FEx data follows the predicted relation.
To compare the descending limb across all groups, we combined all fits in figure 6c and listed fit values of interest in table 4. The descending limb is best fit with linear regressions for the FEx (green, short straight line), single sarcomere (red, long straight line) data, and theoretically predicted values; the FTo data was best fit with a second-order polynomial.
Table 4.
A summary of x-intercept and half-maximum values of fits of the descending limb for each group shown in figure 6. The half-maximum represents the sarcomere, at which 50% of the peak force is produced by the sarcomere or myofibril, indicating a decline in force-producing capacity of 50%. The x-intercept represents the SL at which force production ceases completely.
| group | half-maximum (μm) |
x-intercept (μm) |
|---|---|---|
| theoretical | 3.12 | 3.85 |
| single sarcomere | 3.09 | 3.71 |
| total active force | 3.40 | 3.96 |
| extrapolated force | 3.06 | 3.85 |
Although similar, the fits of FEx and single sarcomere forces differ slightly. The SL at which 50% of the maximal force is produced is similar in both groups; the FEx and single sarcomere groups reached a half-maximum at a SL of 3.06 µm and 3.09 µm, respectively. However, the X-intercepts of the two groups differ to a larger degree at 3.85 µm and 3.71 µm for FEx and single sarcomere data, respectively (table 4). The fit of the FTo group deviated from the theoretical relation the most, reaching a half-maximum only at a SL of 3.4 µm. The X-intercept of the FTo group at 3.96 µm is similar to that of the FEx group at 3.85 µm (table 4).
The collective results in figure 6c show that there is a significant difference between methods of force evaluation (FTo versus FEx). Furthermore, the difference between single sarcomere forces and FTo is significantly different along the descending limb.
4. Discussion
In the present study, we revisited the shape of the descending limb of the force–length relation in skeletal muscles, which has been a matter of debate in the past [7,8,13,21]. While studies performed to date have used single muscle fibres and have continuously argued about the best way of measuring force, the present study used individual myofibrils and single sarcomeres, elucidating issues surrounding SL non-uniformities. Our main findings were: (i) the force–length relation evaluated in single sarcomeres presents a linear descending limb that resembles the theoretical force–length relation based on the degree of filament overlap, (ii) the force–length relation of myofibrils with several sarcomeres in series diverges from the theoretical force–length relation, as total active forces are higher than those predicted by filament overlap, (iii) the similarity of the force–length relation for myofibrils to the theoretical force–length relation is re-established when extrapolated force values are used, as originally proposed in several studies [5,8]. We also observed that (iv) the deviation of the force–length relation obtained from total active forces is strongly correlated with the degree of SL non-uniformity present during activation of the myofibril. Finally, we observed (v) a decrease in the rate of force production and the presence of force ‘creep' at long SLs in myofibrils, a finding that was absent in single sarcomeres.
In a classic study commonly used as a reference for the sliding filament theory, Gordon et al. [5] performed experiments with single muscle fibres from the frog to derive a force–length relation. The authors measured the average SL in a central segment of the fibres and used a feedback system to maintain the segment isometric during contractions. They observed force development at long lengths to happen in two distinct phases: a fast, initial rise followed by a slow rise, creating a ‘creep' phase of the contraction that prevents forces from reaching a steady-state. The slow ‘creep' during force development was explained by a change of SL distribution during the contraction due to the inherent instability associated with the negative slope of the descending limb of the force–length relation [14]. Gordon et al. [5] used an extrapolated force recorded before the maximal force was achieved to separate the slow and fast phases of force development, resulting in the classic force–length relation. The extrapolated force was maximal across SLs, where the overlap between the thick and thin filaments is optimal (between 2.00 µm and 2.25 µm in the case of frog muscle). At longer lengths, force declined linearly with the decrease in filament overlap and reached zero at a SL of 3.65 µm, where overlap ceases.
The original force–length relation investigated by Gordon et al. [5] has been repeated in other laboratories [7,13,24]. However, several later studies contradict these findings when using the maximal force obtained during the contractions instead of the extrapolated force to plot the force–length relation [7,8]. Results from studies using fixed-end contractions, in which sarcomeres are allowed to shorten during contractions, cast doubt on the reliability of the findings from studies using clamped sarcomeres and the use of the extrapolation method. In one of these studies, ter Keurs et al. [8] used fixed-end contractions in fibres that were purposely selected to present only a small degree of SL dispersion and observed an extended plateau of the force–length relation and forces significantly larger than those predicted by the degree of filament overlap. Half-maximal values were not reached until average SLs of approximately 3.4 µm, where only 10% of cross-bridges are available based on filament lengths and overlap [23].
The results observed in studies in which the force–length relation differs from the original study by Gordon et al. [5] have been attributed to SL non-uniformity, which develops when sarcomeres are allowed to shorten at the expense of other sarcomeres that may lengthen during an isometric fibre contraction before reaching maximal force [11,13]. Such a redistribution of segment lengths has also been associated with the ‘creep' observed during tetanic contractions [5]. Several studies with muscle fibres have found sarcomeres in segments near the ends of the fibres to be shorter than those in segments in the middle of the fibres, which may elongate during activation [6,11,13]. As a result, the total force produced by a myofibril will reflect the balance of the isometric forces of shorter sarcomeres that are stronger and longer (and lengthening) sarcomeres [25,26].
Our experiments with myofibrils and sarcomeres allow us to directly investigate these two groups of experimental observations for the first time. Our results show that increasing sarcomere inhomogeneities also increase the force produced by myofibrils at a given average SL. We also show that individual sarcomeres, preparation in which non-uniformity is absent, present a force–length relation with a linear descending limb, confirming that discrepancies in the literature are, in fact, derived from SL non-uniformities. Even more tellingly, when we compared the two methods of measuring force—extrapolated versus total active force—we also repeated the varying results from studies developed in different laboratories. Extrapolated forces show a descending limb resembling that theoretically predicted, while total forces deviate in form of an extended plateau and a curved descending limb, with a half-maximal force at 3.4 µm. The experiments with single sarcomeres remarkably showed that, without the occurrence of SL non-uniformities, the slowed force development during activation and the enhanced force production at long lengths were minimized. It must be recognized that the SL shortening during contraction could be higher in our experimental set-up when we have fewer sarcomeres. The rapid shortening would also lead to a faster rate of force development. However, when we compared the myofibrils with different lengths, we did not see a difference in the rates of force development, and thus the results with sarcomeres likely reflect the absence of SL non-uniformities. All our results confirm that the slow-rise phase of force development and the deviation of the force–length relation from theoretical predictions are due to SL non-uniformities.
In studies with single fibres, the development of passive forces at long SLs (usually greater than 3.0 µm depending on the preparation) may contribute to the total forces recorded during contractions and may be responsible for part of the extra force observed along the descending limb [5,7]. An increase in passive tension could counterbalance the decrease in active tension, so that SL non-uniformities may not be expected. The presence of a small passive stiffness would not avoid SL non-uniformities, which is consistent with our results. Passive forces are not substantially higher in the SLs that we investigated; previous studies with myofibrils and individual sarcomeres show that passive forces in preparations isolated from the psoas muscle start to rise at approximately 2.7 µm and are responsible for only 15–20% of the total forces at SLs of 3.4–3.5 µm [19,27–29]. Furthermore, in our study, myofibrils were set at an initial length, and force was measured based on the displacement of the needles from this position, and thus all comparisons that we made should not be influenced by differences in initial passive forces among the preparations.
It is known that half-sarcomeres may behave differently during myofibril activation and force generation, inducing shifts in the A-bands within sarcomeres [10,30]. Such behaviour of half-sarcomeres, not measured in our experiments, may cause even larger variations of filament overlap in individual sarcomeres and myofibrils during activation, but would not affect the measurements of SL that were performed in the current study.
Although single myofibrils and sarcomeres are preparations that allow for precise measurements of SL, providing important information on the sub-cellular mechanisms of contraction, they may not necessarily reflect the behaviour of larger preparations such as fibre bundles [31] or intact muscles [32]. In these preparations, the force–length relation may depend less on SL non-uniformity, which may be smaller than in individual myofibrils. Furthermore, it must be recognized that the myofibrils investigated in this study were allowed to shorten during contractions, a situation slightly different from experiments conducted with muscle fibres in which the degree of fibre shortening, if existent, is minimal.
5. Conclusion
Our findings indicate that SL non-uniformity plays an essential role in the slow force development and deviations of force along the descending limb of the force–length relation. When SL non-uniformity is eliminated or accounted for when measuring force, the force–length relation resembles that proposed in the original study by Gordon et al. [5] and follows the predictions of the sliding filament theory.
Supplementary Material
Acknowledgements
We would like to thank Andrea Mendoza for helpful comments and support. We also thank Alissa, Milton, and Ophir for their help with data analysis.
Ethics
The experimental protocol was approved by the McGill University Animal Care Committee and complied with the guidelines of the Canadian Council on Animal Care.
Data accessibility
Data used in this study are available from the Dryad Digital Repository: https://doi.org/10.5061/dryad.tht76hdwp [33].
Authors' contributions
D.R. is the corresponding author and supervisor of the study. R.H. is the primary author and experimenter. F.L. is the experimental contributor
Competing interests
We declare we have no competing interests
Funding
This work was supported by the National Science and Engineering Research Council (internal grant no. 210362). D.R. is a Canada Research Chair in muscle Biophysics. F.L. is a recipient of a São Paulo Research Foundation (FAPESP) fellowship (processes 2016/22318-0 and 2019/20208-1).
References
- 1.Huxley AF, Niedergerke R. 1954. Structural changes in muscle during contraction: interference microscopy of living muscle fibres. Nature 173, 971–973. ( 10.1038/173971a0) [DOI] [PubMed] [Google Scholar]
- 2.Huxley HE, Hanson J. 1954. Changes in the cross-striations of muscle during contraction and stretch and their structural interpretation. Nature 173, 973–976. ( 10.1038/173973a0) [DOI] [PubMed] [Google Scholar]
- 3.Huxley AF. 1957. Muscle structure and theories of contraction. Prog. Biophys. Biophys Chem. 7, 255–318. ( 10.1016/S0096-4174(18)30128-8) [DOI] [PubMed] [Google Scholar]
- 4.Huxley AF, Simmons RM. 1971. Proposed mechanism of force generation in striated muscle. Nature 233, 533–538. ( 10.1038/233533a0) [DOI] [PubMed] [Google Scholar]
- 5.Gordon AM, Huxley AF, Julian FJ. 1966. The variation in isometric tension with sarcomere length in vertebrate muscle fibres. J. Physiol. 184, 170–192. ( 10.1113/jphysiol.1966.sp007909) [DOI] [PMC free article] [PubMed] [Google Scholar]
- 6.Julian FJ, Morgan DL. 1979. The effect on tension of non-uniform distribution of length changes applied to frog muscle fibres. J. Physiol. 293, 379–392. ( 10.1113/jphysiol.1979.sp012895) [DOI] [PMC free article] [PubMed] [Google Scholar]
- 7.Granzier HL, Pollack GH. 1990. The descending limb of the force-sarcomere length relation of the frog revisited. J. Physiol. 421, 595–615. ( 10.1113/jphysiol.1990.sp017964) [DOI] [PMC free article] [PubMed] [Google Scholar]
- 8.ter Keurs HE, Iwazumi T, Pollack GH. 1978. The sarcomere length-tension relation in skeletal muscle. J. Gen. Physiol. 72, 565–592. ( 10.1085/jgp.72.4.565) [DOI] [PMC free article] [PubMed] [Google Scholar]
- 9.Rassier DE, Herzog W, Pollack GH. 2003. Stretch-induced force enhancement and stability of skeletal muscle myofibrils. Mol. Cell. Aspects Muscle Contraction 501–515. ( 10.1007/978-1-4419-9029-7_45) [DOI] [PubMed] [Google Scholar]
- 10.Pavlov I, Novinger R, Rassier DE. 2009. The mechanical behavior of individual sarcomeres of myofibrils isolated from rabbit psoas muscle. Am. J. Physiol.- Cell Physiol. 297, C1211–C1219. ( 10.1152/ajpcell.00233.2009) [DOI] [PubMed] [Google Scholar]
- 11.Edman KA, Reggiani C. 1984. Redistribution of sarcomere length during isometric contraction of frog muscle fibres and its relation to tension creep. J. Physiol. 351, 169–198. ( 10.1113/jphysiol.1984.sp015240) [DOI] [PMC free article] [PubMed] [Google Scholar]
- 12.Morgan DL. 1990. New insights into the behavior of muscle during active lengthening. Biophys. J. 57, 209–221. ( 10.1016/S0006-3495(90)82524-8) [DOI] [PMC free article] [PubMed] [Google Scholar]
- 13.Edman KA, Reggiani C. 1987. The sarcomere length-tension relation determined in short segments of intact muscle fibres of the frog. J. Physiol. 385, 709–732. ( 10.1113/jphysiol.1987.sp016516) [DOI] [PMC free article] [PubMed] [Google Scholar]
- 14.Hill AV. 1953. The mechanics of active muscle. Proc. R. Soc. B 141, 104–117. ( 10.1098/rspb.1953.0027) [DOI] [PubMed] [Google Scholar]
- 15.Joumaa V, Leonard TR, Herzog W. 2008. Residual force enhancement in myofibrils and sarcomeres. Proc. R. Soc. B 275, 1411–1419. ( 10.1098/rspb.2008.0142) [DOI] [PMC free article] [PubMed] [Google Scholar]
- 16.Pavlov I, Novinger R, Rassier DE. 2009. Sarcomere dynamics in skeletal muscle myofibrils during isometric contractions. J. Biomech. 42, 2808–2812. ( 10.1016/j.jbiomech.2009.08.011) [DOI] [PubMed] [Google Scholar]
- 17.Rassier DE, Herzog W, Pollack GH. 2003. Dynamics of individual sarcomeres during and after stretch in activated single myofibrils. Proc. R. Soc. B 270, 1735–1740. ( 10.1098/rspb.2003.2418) [DOI] [PMC free article] [PubMed] [Google Scholar]
- 18.Rassier DE. 2008. Pre-power stroke cross bridges contribute to force during stretch of skeletal muscle myofibrils. Proc. R. Soc. B 275, 2577–2586. ( 10.1098/rspb.2008.0719) [DOI] [PMC free article] [PubMed] [Google Scholar]
- 19.Leite FS, et al. 2016. Reduced passive force in skeletal muscles lacking protein arginylation. Am. J. Physiol. Cell Physiol. 310, C127–CC35. ( 10.1152/ajpcell.00269.2015) [DOI] [PMC free article] [PubMed] [Google Scholar]
- 20.Pun C, Syed A, Rassier DE. 2010. History-dependent properties of skeletal muscle myofibrils contracting along the ascending limb of the force–length relationship. Proc. Biol. Sci. B 277, 475–484. ( 10.1098/rspb.2009.1579) [DOI] [PMC free article] [PubMed] [Google Scholar]
- 21.Rassier DE, Pavlov I. 2012. Force produced by isolated sarcomeres and half-sarcomeres after an imposed stretch. Am. J. Physiol. Cell Physiol. 302, C240–C248. ( 10.1152/ajpcell.00208.2011) [DOI] [PubMed] [Google Scholar]
- 22.Rassier DE, MacIntosh BR, Herzog W. 1999. Length dependence of active force production in skeletal muscle. J. Appl. Physiol. 86, 1445–1457. ( 10.1152/jappl.1999.86.5.1445) [DOI] [PubMed] [Google Scholar]
- 23.Sosa H, Popp D, Ouyang G, Huxley HE. 1994. Ultrastructure of skeletal muscle fibers studied by a plunge quick freezing method: myofilament lengths. Biophys. J. 67, 283–292. ( 10.1016/S0006-3495(94)80479-5) [DOI] [PMC free article] [PubMed] [Google Scholar]
- 24.Bagni MA, Cecchi G, Colomo F, Tesi C. 1988. Plateau and descending limb of the sarcomere length-tension relation in short length-clamped segments of frog muscle fibres. J. Physiol. 401, 581–595. ( 10.1113/jphysiol.1988.sp017181) [DOI] [PMC free article] [PubMed] [Google Scholar]
- 25.Morgan DL, Mochon S, Julian FJ. 1982. A quantitative model of intersarcomere dynamics during fixed-end contractions of single frog muscle fibers. Biophys. J. 39, 189–196. ( 10.1016/S0006-3495(82)84507-4) [DOI] [PMC free article] [PubMed] [Google Scholar]
- 26.Morgan DL, Claflin DR, Julian FJ. 1991. Tension as a function of sarcomere length and velocity of shortening in single skeletal muscle fibres of the frog. J. Physiol. 441, 719–732. ( 10.1113/jphysiol.1991.sp018775) [DOI] [PMC free article] [PubMed] [Google Scholar]
- 27.Cornachione AS, Leite F, Bagni MA, Rassier DE. 2016. The increase in non-cross-bridge forces after stretch of activated striated muscle is related to titin isoforms. Am. J. Physiol. Cell Physiol. 310, C19–C26. ( 10.1152/ajpcell.00156.2015) [DOI] [PMC free article] [PubMed] [Google Scholar]
- 28.Cornachione AS, Rassier DE. 2012. A non-cross-bridge, static tension is present in permeabilized skeletal muscle fibers after active force inhibition or actin extraction. Am. J. Physiol. Cell Physiol. 302, C566–C574. ( 10.1152/ajpcell.00355.2011) [DOI] [PubMed] [Google Scholar]
- 29.Bartoo ML, Popov VI, Fearn LA, Pollack GH. 1993. Active tension generation in isolated skeletal myofibrils. J. Muscle Res. Cell Motility 14, 498–510. ( 10.1007/BF00297212) [DOI] [PubMed] [Google Scholar]
- 30.Telley IA, Denoth J, Stüssi E, Pfitzer G, Stehle R. 2006. Half-sarcomere dynamics in myofibrils during activation and relaxation studied by tracking fluorescent markers. Biophys. J. 90, 514–530. ( 10.1113/jphysiol.2006.105809) [DOI] [PMC free article] [PubMed] [Google Scholar]
- 31.Roots H, Offer GW, Ranatunga KW. 2007. Comparison of the tension responses to ramp shortening and lengthening in intact mammalian muscle fibres: crossbridge and non-crossbridge contributions. J. Muscle Res. Cell Motil. 28, 123–139. ( 10.1007/s10974-007-9110-0) [DOI] [PubMed] [Google Scholar]
- 32.Elmubarak MH, Ranatunga KW. 1984. Temperature sensitivity of tension development in a fast-twitch muscle of the rat. Muscle Nerve 7, 298–303. ( 10.1002/mus.880070408) [DOI] [PubMed] [Google Scholar]
- 33.Haeger R, de Souza Leite F, Rassier DE. 2020. Data from: Sarcomere length non-uniformities dictate force production along the descending limb of the force–length relation Dryad Digital Repository. ( 10.5061/dryad.tht76hdwp) [DOI] [PMC free article] [PubMed]
Associated Data
This section collects any data citations, data availability statements, or supplementary materials included in this article.
Data Citations
- Haeger R, de Souza Leite F, Rassier DE. 2020. Data from: Sarcomere length non-uniformities dictate force production along the descending limb of the force–length relation Dryad Digital Repository. ( 10.5061/dryad.tht76hdwp) [DOI] [PMC free article] [PubMed]
Supplementary Materials
Data Availability Statement
Data used in this study are available from the Dryad Digital Repository: https://doi.org/10.5061/dryad.tht76hdwp [33].