

Abstract
The evolution of ferritin levels in hepatitis C virus (HCV)-infected patients with sustained virological responses (SVRs) following various therapy regimens remains elusive. An 8-year prospective cohort study of 1194 HCV-infected patients [interferon-based therapy (n = 620), direct-acting antiviral agent (DAA) therapy (n = 355)] was conducted. At baseline, sex, alanine aminotransferase (ALT), triglycerides, homeostatic model assessment of insulin resistance (HOMA-IR), estimated glomerular filtration rate (eGFR), hemoglobin, iron/total iron-binding capacity (Fe/TIBC) and IFNL3-rs12979860 genotypes were associated with ferritin levels. At 24 weeks posttherapy, ALT, triglycerides, total cholesterol, eGFR, Fe/TIBC and the therapy regimen were associated with ferritin levels in SVR patients. Among interferon-treated patients, ferritin levels increased at 24 weeks posttherapy, regardless of SVR, and 24-week posttherapy ferritin levels were higher in non-SVR patients (n = 111) than in SVR patients (n = 509); ferritin levels began decreasing at 3 years posttherapy and were lower than pretherapy levels since 4 years posttherapy in SVR patients. Among DAA-treated SVR patients (n = 350), ferritin levels decreased and remained stable since 24 weeks posttherapy. ALT, triglycerides, eGFR, and Fe/TIBC were HCV-unrelated factors associated with ferritin levels; sex, HOMA-IR, total cholesterol, hemoglobin and IFNL3-rs12979860 genotype were HCV-related factors associated with ferritin levels. In interferon-treated SVR patients, the increased trend of posttherapy ferritin levels was not reversed until 4 years posttherapy. In DAA-treated SVR patients, ferritin levels decreased since 24 weeks posttherapy.
Subject terms: Biochemistry, Gastroenterology
Introduction
Hepatitis C virus (HCV) is a human pathogen responsible for acute and chronic liver disease that chronically infects an estimated 71.1 million individuals worldwide1 and is classified into 8 genotypes2. Chronic HCV infection (CHC) is characterized by hepatic iron overload, hyperferraemia and hyperferritinaemia3,4, as an estimated 30–40% of CHC patients have elevated ferritin levels5. Ferritin keeps iron in a nontoxic form and reflects body iron stores6; it is also an acute phase protein and becomes elevated as inflammation occurs in chronic liver injury7. Transfusion (an important risk factor for HCV infection)8, oxidative stress9–11, steatosis12 and fibrosis12,13 are all associated with hyperferritinaemia in CHC patients. Iron overload with hyperferremia might suppress functions of the complement system14 and accelerate the persistence of HCV infection. In addition, compared with patients who respond to interferon-based anti-HCV therapy, CHC patients who do not respond had higher baseline serum ferritin levels15,16, and a serum ferritin level that is higher during therapy than at baseline was shown to be associated with a favorable treatment response16. Serum ferritin levels thus might be affected not only by HCV-related hepatic injury but also by interferon-based anti-HCV therapy, as interferon has been associated with increases in lipid levels17 and with immune modulation in patients18. With the advent of direct-acting antiviral agents (DAAs), which target specific proteins of HCV during its life cycle19, anti-HCV therapy has resulted in a high cure rate with a short treatment duration in CHC patients, and HCV-associated ferritin level alterations may not be masked by any interferon effect. The factors that affect the ferritin levels in CHC patients and how the anti-HCV therapeutic regimens and responses affect the serum ferritin levels remain elusive but are crucial for the prognosis of CHC patients, as ferritin is essential for iron homeostasis and is involved in a wide range of physiologic and pathologic processes20, and the ferritin levels in CHC patients with sustained virological response (SVR) might serve as a prognostic marker. Comparing the pre- and posttreatment variables in SVR patients has provided an excellent opportunity to eliminate the interference caused by individual bias21 when reviewing the impact of HCV on alterations in ferritin levels. Accordingly, we sought to fill the aforementioned knowledge gaps by conducting an 8-year prospective cohort study analyzing the serum ferritin levels and crucial confounders of CHC patients before and after interferon-based or DAA-based anti-HCV therapy.
Materials and methods
Patients
The study group comprised subjects aged 18 years or older with CHC, defined as serum HCV-RNA detectable by polymerase chain reaction (PCR) for > 24 weeks. Subjects with human immunodeficiency virus; hepatitis B virus infection; hemochromatosis; primary biliary cholangitis; primary sclerosing cholangitis; autoimmune hepatitis; autoimmune diseases including Sjogren's syndrome, systemic lupus erythematous, rheumatoid arthritis and psoriasis; alcoholism; or malignancy and recipients of solid organ transplants were excluded22,23.
Study design
A schematic flow chart for all enrolled patients is shown in Fig. 1. In total, 1194 CHC patients were consecutively recruited at a Taiwan tertiary referral center between January 2010 and December 2019. Of the 1194 patients, 620 had completed a course of anti-HCV therapy with weight-based pegylated interferon-α-2b and ribavirin for either 24 or 48 weeks22, and 355 patients had completed a course of various combinations of DAAs (Supplementary Table 1). HCV-RNA levels, genotypes, and single-nucleotide polymorphisms of interferon-λ3 (IFNL3)-rs12979860 were assessed as previously described22. Several baseline factors, including sex, age, body mass index (BMI), HCV genotype, the presence of hepatic cirrhosis, levels of HCV-RNA, serum ferritin (normal range: male: 30–400 ng/mL; female: 13–150 ng/mL), iron, iron/total iron-binding capacity (Fe/TIBC) (i.e., transferrin saturation percentage), neutrophil–lymphocyte ratio (NLR), estimated glomerular filtration rate (eGFR), homeostatic model assessment of insulin resistance (HOMA-IR) index (fasting insulin [μU/mL] × fasting glucose [mmol/L]/22.5), total cholesterol (TC), triglycerides (TG), alanine aminotransferase (ALT), aspartate aminotransferase (AST), platelets and fibrosis-4 (FIB-4) index [age (years) × AST (U/L)/[PLT(109/L) × ALT(U/L)1/2] were recorded in all patients. Biochemical tests were performed at the clinical pathology laboratories of the hospital using routine automated techniques in an automated clinical chemistry analyzer (Hitachi LST008). The diagnosis of hepatic steatosis was based on sonographic findings. The diagnosis of liver cirrhosis was made by earlier histologic findings or ultrasonographic findings compatible with cirrhosis and supplemented with esophageal or gastric varices, splenomegaly and/or thrombocytopenia, as described elsewhere24. For the CHC patients who completed the anti-HCV therapy, the aforementioned variable levels were evaluated 2 weeks before therapy and 24 weeks posttherapy. SVR was defined as undetectable levels of HCV-RNA 24 weeks after the completion of therapy. Ferritin levels were surveyed every 24–48 weeks posttherapy in SVR patients.
Figure 1.
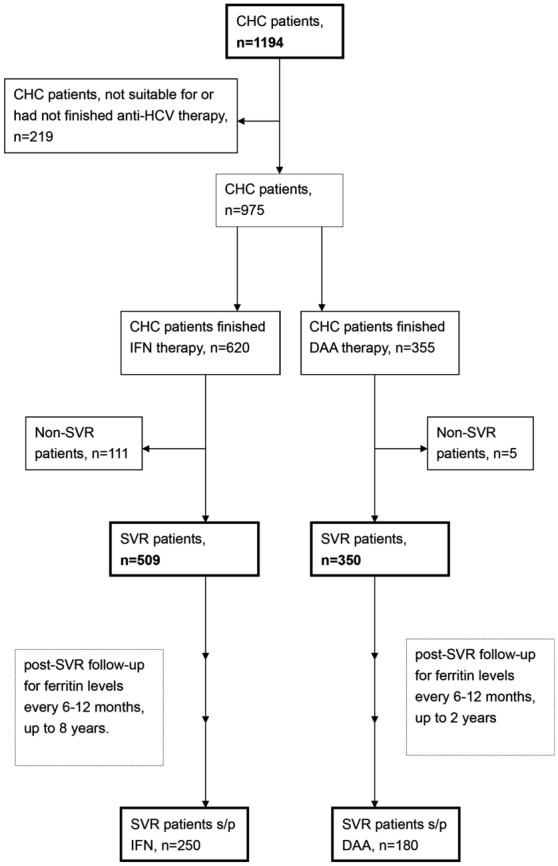
A schematic flow chart of the enrolled patients. CHC chronic hepatitis C virus infection, IFN interferon-based therapy, DAA direct-acting antiviral, s/p status post, SVR sustained virological response.
Statistics
All statistical analyses were performed using the Statistical Package for Social Science (SPSS package version 21, SPSS Inc., Chicago, IL, USA) software. Continuous variables were analyzed using Student’s t-test, and categorical variables were analyzed using a chi-square test or Fisher’s exact test as appropriate. Nonparametric tests were performed where indicated. Multivariate linear or logistic regression models were used to assess relationships between various dependent and independent variables by adjusting for all the independent variables with a p value < 0.1 in univariate analyses. The collinearity of variables was determined by linear regression tests. A paired t-test was used to analyze the same variables before and after therapy within the same individuals. Statistical significance was assessed at the 5% level based on two-tailed tests of the null hypothesis22,23.
Ethics approval
The study protocol conformed to the ethical guidelines of the 1975 Declaration of Helsinki and was approved by the local institutional review board (Chang Gung Memorial Hospital).
Consent to participate
Written informed consent was obtained from each patient.
Consent for publication
Not applicable.
Results
Baseline characteristics of the enrolled CHC patients
Of 1194 enrolled CHC patients with a mean age of 56.93 years, 627 (52.5%) were males, 679 (56.9%) were infected with genotype 1 HCV, and 240 (20.4%) had liver cirrhosis. The mean ferritin level was 386.0 ng/mL. Of the 1194 patients, 553 (46.3%) had high baseline ferritin levels. The comparisons between patients who underwent interferon-based therapy (n = 620) and those who underwent DAA therapy (n = 355) showed that the former were more frequently male, younger, infected with genotypes 1 and 2 HCV and had higher levels of ALT, eGFR, uric acid and hemoglobin; lower levels of NLR and FIB-4 index; and lower rates of hepatic steatosis (Table 1).
Table 1.
Baseline characteristics of the 1194 CHC patients.
| All (n = 1194) | Interferon-based therapy (n = 620) | DAA therapy (n = 355) | p values* | |
|---|---|---|---|---|
| Male, n (%) | 627 (52.5) | 353 (56.9) | 166 (46.8) | 0.001 |
| Age (years) | 56.93 ± 12.75 | 53.96 ± 11.72 | 60.33 ± 12.99 | < 0.001 |
| BMI (kg/m2) | 24.80 ± 3.85 | 24.96 ± 3.76 | 24.80 ± 4.01 | 0.523 |
| HCV genotype | ||||
| Genotype 1, n (%) | 679 (56.9) | 327 (52.7) | 244 (63.1) | 0.001 |
| Genotype 2, n (%) | 412 (34.5) | 247 (39.8) | 106 (29.9) | 0.001 |
| Genotype 3, n (%) | 25 (2.1) | 16 (2.6) | 5 (1.4) | 0.16 |
| Log HCV RNA (logIU/mL) | 6.00 ± 0.991 | 6.02 ± 1.05 | 6.03 ± 0.83 | 0.809 |
| ALT (U/L) | 91.89 ± 96.59 | 96.92 ± 98.24 | 81.69 ± 89.55 | 0.016 |
| eGFR (mL/min/1.73 m2) | 95.97 ± 38.40 | 102.73 ± 36.06 | 89.08 ± 39.86 | < 0.001 |
| TG (mg/dL) | 103.54 ± 53.45 | 103.70 ± 52.77 | 103.97 ± 53.70 | 0.939 |
| TC (mg/dL) | 170.30 ± 33.49 | 171.52 ± 31.60 | 170.58 ± 33.78 | 0.666 |
| HOMA-IR | 3.23 ± 5.26 | 3.14 ± 4.45 | 3.24 ± 5.12 | 0.77 |
| Uric acid (mg/dL) | 5.86 ± 1.59 | 5.94 ± 1.55 | 5.71 ± 1.62 | 0.041 |
| Ferritin (ng/mL) | 386.0 ± 492.3 | 375.3 ± 434.1 | 381.7 ± 532.1 | 0.858 |
| High ferritin, n (%) | 553 (46.3) | 296 (47.7) | 164 (46.2) | 0.853 |
| Iron (μg/dL) | 132.5 ± 56.5 | 138.9 ± 55.3 | 136.3 ± 58.7 | 2.678 |
| Fe/TIBC (%) | 0.404 ± 0.185 | 0.410 ± 0.181 | 0.40 ± 0.187 | 0.736 |
| Hb (g/dL) | 13.92 ± 1.85 | 14.30 ± 1.65 | 13.69 ± 1.92 | < 0.001 |
| NLR | 1.75 ± 0.96 | 1.63 ± 0.84 | 1.88 ± 1.03 | < 0.001 |
| Platelet (103/μL) | 175.0 ± 66.3 | 176.9 ± 56.56 | 176.2 ± 72.2 | 0.884 |
| Steatosis, n (%) | 630 (52.8) | 297 (47.9) | 204 (57.5) | 0.06 |
| Liver cirrhosis, n (%) | 243 (20.4) | 136 (21.9) | 84 (23) | 0.38 |
| FIB-4 index | 3.39 ± 3.39 | 3.09 ± 3.23 | 3.86 ± 3.64 | 0.003 |
|
IFNL3-rs12979860 CC genotype, n (%) |
1018 (85.3) | 533 (85.9) | 300 (84.5) | 0.371 |
CHC chronic hepatitis C virus infection, DAA direct-acting antivirals, BMI body mass index, HCV hepatitis C virus, RNA ribonucleic acid, ALT alanine transaminase, eGFR estimated glomerular filtration rate, TG triglycerides, TC total cholesterol, HOMA-IR homeostatic model assessment for insulin resistance, Fe/TIBC serum Iron/total iron binding capacity, Hb hemoglobin, NLR neutrophil lymphocyte ratio, FIB-4 fibrosis-4, IFNL3 interferon-λ3.
*p values between CHC patients underwent interferon-based or DAA therapy.
Factors associated with ferritin levels of CHC patients at baseline
At baseline, the variables including male sex, levels of ALT and TG, HOMA-IR, Fe/TIBC and CC genotype of IFNL3-rs12979860 were positively associated, while levels of eGFR and hemoglobin were negatively associated with ferritin levels among the 1194 CHC patients (Table 2). While we regarded high baseline ferritin levels as the dependent factor, the independent factors were age, ALT, eGFR, TGs, Fe/TIBC and fatty liver status (Supplementary Table 2). Of 620 patients who underwent interferon-based therapy, 509 achieved an SVR; of 355 patients who underwent DAA therapy, 350 achieved an SVR (Fig. 1). No differences in pretherapy ferritin levels were noted between SVR and non-SVR patients, regardless of therapy regimen (p = 0.912 for all patients, p = 0.417 for patients who underwent interferon-based therapy; p = 0.409 for patients who underwent DAA therapy). Furthermore, pretherapy ferritin levels were not associated with SVR, regardless of therapy regimens (p = 0.911 for all patients, p = 0.418 for patients who underwent interferon-based therapy; p = 0.353 for patients who underwent DAA therapy).
Table 2.
Associations of ferritin levels in CHC patients at baseline.
| Baseline factors | Univariate analyses | Multivariate analyses | ||
|---|---|---|---|---|
| 95% CI of OR (OR) | p values | 95% CI of OR (OR) | p values | |
| Male, yes | 98.3 ~ 225.5 (161.9) | < 0.001 | 2.935 ~ 130.3 (66.6) | 0.04 |
| Age (years) | 0.667 ~ 5.741 (3.20) | 0.013 | − 4.366 ~ 1.196 (− 1.58) | 0.264 |
| BMI (kg/m2) | − 0.348 ~ 12.89 (4.71) | 0.26 | ||
| HCV genotype | − 27.77 ~ 18.99 (− 4.39) | 0.712 | ||
| Log HCV RNA (logIU/mL) | − 60.1 ~ 7.4 (− 26.3) | 0.126 | ||
| ALT (U/L) | 1.457 ~ 2.055 (1.756) | < 0.001 | 0.841 ~ 1.381 (1.111) | < 0.001 |
| eGFR (mL/min/1.73 m2) | − 1.69 ~ − 1.007 (− 0.849) | 0.048 | − 1.97 ~ − 0.162 (− 1.066) | 0.021 |
| TG (mg/dL) | 1.452 ~ 2.657 (2.055) | < 0.001 | 0.793 ~ 1.904 (1.349) | < 0.001 |
| TC (mg/dL) | − 0.9 ~ 1.032 (0.066) | 0.893 | ||
| HOMA-IR | 2.054 ~ 15.057 (8.655) | 0.01 | 0.806 ~ 12.073 (6.439) | 0.025 |
| Uric acid (mg/dL) | 33.87 ~ 76.18 (55.0) | < 0.001 | − 14.864 ~ 23.74 (4.438) | 0.652 |
| Fe/TIBC (%) | 1428 ~ 1722 (1575) | < 0.001 | 1252 ~ 1565 (1409) | < 0.001 |
| Hb (g/dL) | 6.91 ~ 41.69 (24.3) | 0.006 | − 50.21 ~ − 13.5 (− 31.86) | 0.001 |
| NLR | − 23.8 ~ 43.4 (9.8) | 0.567 | ||
| Platelet (103/μL) | − 1.557 ~ − 0.588 (− 1.07) | < 0.001 | − 3.46 ~ − 0.875 (0.265) | 0.395 |
| Steatosis, yes | − 8.2 ~ 118.5 (55.1) | 0.188 | ||
| Liver cirrhosis, yes | − 107.7 ~ 52.4 (− 26.6) | 0.519 | ||
| Fibrosis-4 index | 16.4 ~ 34.8 (25.4) | < 0.001 | − 3.20 ~ 20.42 (8.606) | 0.153 |
|
IFNL3-rs12979860 CC genotype, yes |
− 227.7 ~ − 34.7 (− 131.2) | 0.008 | − 181.9 ~ − 31.46 (− 106.2) | 0.005 |
CHC chronic hepatitis C virus infection, OR odds ratio, CI confidence interval, BMI body mass index, HCV hepatitis C virus, RNA ribonucleic acid, ALT alanine transaminase, eGFR estimated glomerular filtration rate, TG triglycerides, TC total cholesterol, HOMA-IR homeostatic model assessment for insulin resistance, Fe/TIBC serum Iron/total iron binding capacity, Hb hemoglobin, NLR neutrophil lymphocyte ratio, FIB-4 fibrosis-4, IFNL3 interferon-λ3.
Factors associated with ferritin levels of SVR patients at 24 weeks posttherapy
At 24 weeks posttherapy, the levels of ALT, TG, and TC and the ratio of Fe/TIBC were positively associated, while the levels of eGFR and DAA therapy were negatively associated, with the ferritin levels of SVR patients (Table 3).
Table 3.
Associations of ferritin levels in SVR patients at 24 weeks posttherapy.
| 24-week post-therapy factors | Univariate analyses | Multivariate analyses | ||
|---|---|---|---|---|
| 95% CI of OR (OR) | p values | 95% CI of OR (OR) | p values | |
| Male, yes | − 47.83 ~ 132.4 (42.29) | 0.357 | ||
| Age, (years) | − 1.49 ~ 5.71 (2.1) | 0.251 | ||
| BMI (kg/m2) | − 16.7 ~ 7.286 (− 4.7) | 0.44 | ||
| ALT (U/L) | 6.19 ~ 11.91 (9.052) | < 0.001 | 3.007 ~ 8.107 (5.557) | < 0.001 |
| eGFR (mL/min/1.73 m2) | − 4.526 ~ − 1.821 (− 3.17) | < 0.001 | − 3.9 ~ − 1.61 (− 2.76) | < 0.001 |
| TG (mg/dL) | 0.331 ~ 1.228 (0.779) | 0.001 | 0.146 ~ 0.909 (0.527) | 0.017 |
| TC (mg/dL) | 0.956 ~ 3.423 (2.189) | 0.001 | 0.211 ~ 2.346 (1.278) | 0.019 |
| HOMA-IR | − 0.689 ~ 29.63 (14.47) | 0.061 | − 5.03 ~ 20.09 (7.53) | 0.239 |
| Uric acid (mg/dL) | 33.59 ~ 91.36 (62.474) | < 0.001 | − 7.11 ~ 40.52 (16.70) | 0.169 |
| Fe/TIBC (%) | 1811 ~ 2338 (2075) | < 0.001 | 1521 ~ 2030 (1776) | < 0.001 |
| Hb (g/dL) | − 34.76 ~ 18.93 (− 7.91) | 0.563 | ||
| NLR | − 34.1 ~ 66.98 (16.45) | 0.523 | ||
| Platelet (103/μL) | − 2.06 ~ − 0.591 (− 1.29) | 0.001 | − 1.12 ~ 0.661 (− 0.234) | 0.608 |
| Steatosis, yes | − 177.8 ~ 86.3 (− 45) | 0.495 | ||
| Liver cirrhosis, yes | − 77.0 ~ 256.8 (89.92) | 0.29 | ||
| Fibrosis-4 index | − 2.56 ~ 42.1 (19.755) | 0.083 | − 4.36 ~ 47.8 (21.72) | 0.102 |
|
IFNL3-rs12979860 CC genotype, yes |
− 189.3 ~ 80.9 (− 54.2) | 0.431 | ||
| Therapy (interferon = 1, DAA = 2) | − 352 ~ − 170 (− 261) | < 0.001 | − 331 ~ − 161 (− 246) | < 0.001 |
OR odds ratio, BMI body mass index, ALT alanine transaminase, eGFR estimated glomerular filtration rate, TG triglycerides, TC total cholesterol, HOMA-IR homeostatic model assessment for insulin resistance, Fe/TIBC serum Iron/total iron binding capacity, Hb hemoglobin, NLR neutrophil lymphocyte ratio, FIB-4 fibrosis-4, IFNL3 interferon-λ3, DAA direct-acting antivirals.
A summary of the associations (baseline and 24 weeks posttherapy) identified between independent factors and ferritin levels is shown in Fig. 2.
Figure 2.
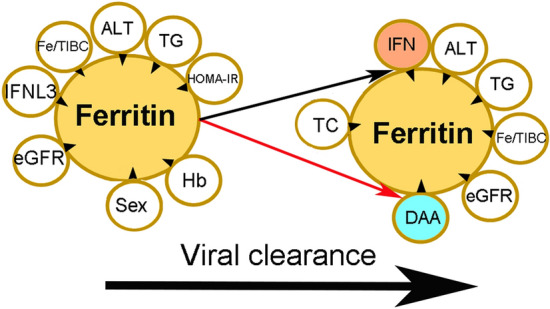
Associations between independent factors and ferritin levels at baseline and at 24 weeks post-anti-HCV therapy. The tips of the black arrowheads indicate dependent factors, and the bases of the black arrowheads indicate independent factors. IFNL3 interferon λ3, Fe/TIBC iron/total iron-binding capacity, ALT alanine aminotransferase, TG triglycerides, HOMA-IR homeostasis model assessment-estimated insulin resistance, eGFR estimated glomerular filtration rate, Hb hemoglobin, IFN interferon-based therapy, DAA direct-acting antiviral, TC total cholesterol. Upward-facing black arrow: increased ferritin levels in patients who underwent interferon-based therapy; downward-facing red arrow: decreased ferritin levels in patients who underwent DAA therapy.
Longitudinal alteration of ferritin levels in SVR patients
Among patients who received interferon-based therapy, compared with baseline, levels of ferritin increased at 24 weeks posttherapy, regardless of SVR [SVR (+) patients: 515 ± 672 vs. 365 ± 447 ng/mL, p < 0.001; SVR(−) patients: 896 ± 1281 vs. 418 ± 430 ng/mL, p = 0.001]. However, 24-week posttherapy levels of ferritin were higher in non-SVR patients than in SVR patients (896 ± 1281 vs. 515 ± 672 ng/mL, p = 0.001). Among patients who received DAA therapy and achieved an SVR (n = 350), the levels of ferritin decreased at 24 weeks posttherapy (227 ± 326 vs. 468 ± 632 ng/mL, p < 0.001), while among patients who received DAA therapy without an SVR (n = 5), the comparison between pretherapy and 24-week posttherapy levels of ferritin did not indicate a significant difference (180 ± 28.4 vs. 194 ± 129 ng/mL, p = 0.798). Among all SVR patients, lower levels of 24-week posttherapy ferritin were noted in patients who underwent DAA therapy than in those who underwent interferon-based therapy (227 ± 326 vs. 515 ± 672 ng/mL, p < 0.001) (Fig. 2). Furthermore, the percentage of patients with high ferritin levels was lower among SVR patients who underwent DAA therapy than among those who underwent interferon-based therapy (25.7% vs. 48.4%, p < 0.001).
Longitudinally, as shown in Fig. 3, for SVR patients who underwent interferon-based therapy, compared with pretherapy levels, higher posttherapy ferritin levels were noted until 2 years posttherapy (p = 0.042), while the post- and pretherapy differences disappeared at 3 years posttherapy (p = 0.585), and the posttherapy levels were lower than pretherapy levels from 4 years (p = 0.004) to 8 years posttherapy (p = 0.012) (follow-up duration: mean ± standard deviation: 1736 ± 753 days, median: 1712 days, range 700–2920 days). For the SVR patients who underwent DAA therapy, posttherapy ferritin levels were lower than pretherapy ferritin levels from 24 weeks to 2 years posttherapy (p < 0.001) (final follow-up duration: mean ± standard deviation: 628 ± 196 days, median: 630 days, range 363–730 days). The ferritin levels in DAA-treated SVR patients remained steady beginning at 24 weeks posttherapy, as all the comparisons between posttherapy ferritin levels were nonsignificant (p values 0.471–0.646). Moreover, all the posttherapy ferritin levels of SVR patients who underwent DAA were lower than those of SVR patients who underwent interferon-based therapy with the same follow-up time (i.e., at 24 weeks and 1 and 2 years posttherapy) (Fig. 3, Supplementary Table 3).
Figure 3.

Longitudinal alteration in ferritin levels (mean ± standard error) in SVR patients following interferon (IFN)-based (solid line) and DAA (dashed line) therapies.
Discussion
The most compelling results of the current study are as follows:
(1) At baseline, sex, ALT, TG, HOMA-IR, eGFR, hemoglobin, Fe/TIBC and IFNL3-rs12979860 genotype were associated with ferritin levels of CHC patients. (2) At 24 weeks posttherapy, ALT, TG, TC eGFR, Fe/TIBC, and therapy regimen were associated with ferritin levels of SVR patients. (3) Among patients who received interferon-based therapy, the levels of ferritin increased at 24 weeks posttherapy, regardless of SVR. However, 24-week post-therapy ferritin levels were higher in non-SVR patients than in SVR patients. Among SVR patients who received DAA therapy, the levels of ferritin decreased at 24 weeks posttherapy. (4) During the 8-year follow-up, the trend of increased ferritin levels was reversed beginning at 4 years posttherapy in interferon-treated SVR patients; however, a stable trend of decreased ferritin levels remained in DAA-treated SVR patients starting at 24 weeks posttherapy.
It has been proposed that HCV controls iron both by intracellular iron sequestration and intercellular iron mobilization via ferritin, as a means toward enhanced replication3. However, consistent with a previous study13, no significant correlations were identified between HCV viral load and any iron markers. The factors consistently associated with ferritin levels both pretherapy in CHC patients and at 24 weeks posttherapy in SVR patients, such as ALT, TG, eGFR, and Fe/TIBC, exhibited fundamental links with ferritin, regardless of HCV infection. For example, ferritin levels > 1.5 times higher than normal are usually seen in patients with a > 6 month history of elevated ALT25, high TG levels are strongly associated with ferritin levels26, every 100 μg/L increase in ferritin levels was correlated with 0.26 mL/min per 1.73 m2 decrease in eGFR27, and the positive association between ferritin levels and transferrin saturation (Fe/TIBC) reflects the correlation between iron store and iron availability28. In contrast, the pretherapy-only factors (sex, HOMA-IR, hemoglobulin and IFNL3-rs12979860 genotype) and posttherapy-only factors (TC and anti-HCV therapy) suggested potential links, direct or indirect, between HCV infection and ferritin levels. Consistently, higher hepatic iron concentrations were observed in male CHC patients29; the connection between HOMA-IR and ferritin levels in CHC patients has been reported30 and may correlate with the grade of hepatic iron deposition31,32; the negative association between hemoglobin and ferritin levels among CHC patients seemed to reflect the links between fibrosis (portal hypertension subsequent to hepatic fibrosis might lead to variceal bleeding with anemia and then low hemoglobin levels) and ferritin levels, as elevated serum ferritin levels are independently associated with advanced liver fibrosis in CHC patients12. Of note, it is a novel finding that the IFNL3-rs12979860 CC genotype was negatively associated with baseline ferritin levels, which echoes previous studies revealing that baseline ferritin levels were independently associated with poor response to interferon-based therapy12,33,34; the association might occur through advanced hepatic fibrosis12,35, hepatic steatosis12,36,37 or high necroinflammatory activity35. However, the baseline ferritin levels were not associated with SVR among interferon-treated patients in the current study, and a prevalent IFNL3-rs12979860 CC genotype in Taiwan22,23 might blunt the impact of baseline ferritin levels on SVR. Interestingly, HCV nonstructural proteins upregulate the ferritin heavy chain, which in turn inhibits apoB-100 secretion, and serum ferritin and apoB-100 concentrations are inversely correlated in HCV-infected patients38. The positive association between ferritin and TC among SVR patients might reflect the reversal of HCV-associated inhibition of the secretion of apoB-100, the main apolipoprotein of TC, after HCV clearance. Given that sex, HOMA-IR, TC, hemoglobin and IFNL3-rs12979860 genotype were HCV-related factors associated with serum ferritin levels, special caution is demanded in male CHC patients with high HOMA-IR and TC but low Hb levels and an IFNL3-rs12979860 non-CC genotype due to the potential poor prognosis linked with high ferritin levels. Namely, the demographic, genetic and metabolic profiles, in particular lipid and glucose parameters, might affect the outcomes of CHC patients by interfering with ferritin levels.
Therapy regimens also affect ferritin levels in CHC patients. Serum ferritin levels were significantly decreased at the end of therapy39, at 12 weeks40, 24 weeks41, or up to 1 year42 from baseline in SVR patients following DAA therapy. Since ferritin might work as an acute phase protein and reflect hepatic injury, it is conceivable that ferritin levels decreased after SVR in CHC patients following DAA therapy. Compared with baseline levels, the lower ferritin levels persisted up to 2 years posttherapy among DAA-treated SVR patients in the current study, suggesting a long-term improvement in iron homeostasis20. On the other hand, although iron overload improved after SVR in CHC patients who underwent interferon-based therapy43, how ferritin levels evolved in these patients remains inconclusive, as ferritin levels had been reported to increase44, decrease45,46 or remain steady42 in studies with case numbers ranging from 73 to 191. Based on a cohort of 620 CHC patients who underwent interferon-based therapy, our study demonstrated that the levels of ferritin increased at 24 weeks posttherapy, rather than decreased, regardless of SVR, although the 24-week posttherapy ferritin levels were lower in the SVR patients than in the non-SVR patients. The fact that ferritin levels increased at 24 weeks posttherapy in CHC patients who underwent interferon monotherapy regardless of viral clearance47 suggests that interferon per se increases ferritin levels. On the other hand, ribavirin-induced hemolysis was shown to significantly increase serum ferritin levels, intrahepatic iron deposition and liver fibrosis in renal transplant patients receiving ribavirin monotherapy48. Additionally, ribavirin-induced hemolysis floods hepatocytes and Kupffer cells with heme, which is metabolized and detoxified by heme oxygenase-1 to carbon monoxide, biliverdin and free iron, which induces ferritin49. Together, pegylated interferon and ribavirin of interferon-based therapy might synergistically increase serum ferritin levels in CHC patients. This idea explained why both SVR and non-SVR patients treated with interferon-based therapy had increased 24-week posttherapy ferritin levels. Surprisingly, it took at least 4 years to eliminate interferon- and ribavirin-related biases, as the trend of increased ferritin levels was not reversed until 4 years posttherapy. Thus, compared with interferon-based therapy, DAA therapy is not only more effective, safer and more tolerable50 but also leads to a less vulnerable iron homeostasis status, evidenced by earlier reversal of high ferritin levels after SVR.
Given that most non-SVR patients following interferon-based therapy had received further therapeutic courses of DAA, their long-term post-interferon-based-therapy ferritin levels cannot be acquired. Thus, the major limitation of the current study is that the long-term posttherapy ferritin levels between the SVR and non-SVR patients following interferon-based therapy cannot be compared. However, as mentioned21, the comparisons between the pre- and posttherapy ferritin levels in the same individuals might be a better alternative to compare the levels between SVR and non-SVR patients in terms of eliminating the individual biases.
In summary, ALT, TG, eGFR, and Fe/TIBC were HCV-unrelated factors associated with ferritin levels, while sex, HOMA-IR, TC, hemoglobin and IFNL3-rs12979860 genotype were HCV-related factors associated with serum ferritin levels. During a follow-up of 8 years, in interferon-treated SVR patients, the trend of increased posttherapy ferritin levels was not reversed until 4 years posttherapy. In SVR patients treated with DAA therapy, ferritin levels decreased at 24 weeks posttherapy and remained stable afterward. These specific evolutions and associations of ferritin levels indicated that a tailored follow-up protocol for hyperferritinaemia and associated complications in CHC patients with SVR needs to be conducted according to antiviral regimens.
Supplementary information
Acknowledgements
The authors thank Ms. Shu-Chun Chen, Ms. Chia-Hui Tsai, Mr. Chun-Kai Liang and Mr. Shuen-Shian Shiau from the Liver Research Center, Chang Gung Memorial Hospital, Taiwan, for their assistance with data mining.
Author contributions
M.L.C. and R.N.C.: study design and implementation, manuscript drafting, and critical revision of the manuscript for important intellectual content. J.H.H., C.H.Y., K.H.C., C.J.K., M.S.L. and S.C.C.: data collection and manuscript writing. C.H.L.: statistical analysis and manuscript writing. All authors read and approved the final manuscript.
Funding
This study was supported by grants from the Chang Gung Medical Research Program (CMRPG3I0412 and CMRPG3K0721) and the National Science Council (MOST 108-2314-B-182-051, 109-2314-B-182-024 and 109-2629-B-182-002) to MLC. The funders had no role in the study design, data collection and analysis, decision to publish, or preparation of the manuscript. All authors have read the journal's authorship agreement and policy on disclosure of potential conflicts of interest.
Data availability
The data that support the findings of this study are available on request from the corresponding author (MLC).
Competing interests
The authors declare no competing interests.
Footnotes
Publisher's note
Springer Nature remains neutral with regard to jurisdictional claims in published maps and institutional affiliations.
Contributor Information
Ming-Ling Chang, Email: mlchang8210@gmail.com.
Rong-Nan Chien, Email: ronald@cgmh.org.tw.
Supplementary information
is available for this paper at 10.1038/s41598-020-76871-z.
References
- 1.Spearman CW, Dusheiko GM, Hellard M, Sonderup M. Hepatitis C. Lancet. 2019;394:1451–1466. doi: 10.1016/S0140-6736(19)32320-7. [DOI] [PubMed] [Google Scholar]
- 2.Borgia SM, et al. Identification of a novel hepatitis C virus genotype from Punjab, India: Expanding classification of hepatitis C virus into 8 genotypes. J. Infect. Dis. 2018;218:1722–1729. doi: 10.1093/infdis/jiy401. [DOI] [PubMed] [Google Scholar]
- 3.Foka P, et al. Alterations in the iron homeostasis network: A driving force for macrophage-mediated hepatitis C virus persistency. Virulence. 2016;7:679–690. doi: 10.1080/21505594.2016.1175700. [DOI] [PMC free article] [PubMed] [Google Scholar]
- 4.Shan Y, et al. Association of hepatitis C virus infection with serum iron status: Analysis of data from the third National Health and Nutrition Examination Survey. Clin. Infect. Dis. 2005;40:834–841. doi: 10.1086/428062. [DOI] [PubMed] [Google Scholar]
- 5.Georgopoulou U, et al. Hepcidin and the iron enigma in HCV infection. Virulence. 2014;5:465–476. doi: 10.4161/viru.28508. [DOI] [PMC free article] [PubMed] [Google Scholar]
- 6.Fiorelli G. Serum ferritin and erythrocyte indices in iron overload. Blood Transfus. 2007;5:187–188. doi: 10.2450/2007.0036-07. [DOI] [PMC free article] [PubMed] [Google Scholar]
- 7.Ruddell RG, et al. Ferritin functions as a proinflammatory cytokine via iron-independent protein kinase C zeta/nuclear factor kappaB-regulated signaling in rat hepatic stellate cells. Hepatology. 2009;49:887–900. doi: 10.1002/hep.22716. [DOI] [PMC free article] [PubMed] [Google Scholar]
- 8.Richard S, Billett HH. Liver function tests in sickle cell disease. Clin. Lab. Haematol. 2002;24:21–27. doi: 10.1046/j.1365-2257.2002.0378a.x. [DOI] [PubMed] [Google Scholar]
- 9.Nishina S, et al. Hepatitis C virus-induced reactive oxygen species raise hepatic iron level in mice by reducing hepcidin transcription. Gastroenterology. 2008;134:226–238. doi: 10.1053/j.gastro.2007.10.011. [DOI] [PubMed] [Google Scholar]
- 10.Fujita N, et al. Comparison of hepatic oxidative DNA damage in patients with chronic hepatitis B and C. J. Viral. Hepat. 2008;15:498–507. doi: 10.1111/j.1365-2893.2008.00972.x. [DOI] [PubMed] [Google Scholar]
- 11.Fujita N, et al. Hepatic oxidative DNA damage correlates with iron overload in chronic hepatitis C patients. Free Radic. Biol. Med. 2007;42:353–362. doi: 10.1016/j.freeradbiomed.2006.11.001. [DOI] [PubMed] [Google Scholar]
- 12.Lange CM, et al. Serum ferritin levels are associated with a distinct phenotype of chronic hepatitis C poorly responding to pegylated interferon-alpha and ribavirin therapy. Hepatology. 2012;55:1038–1047. doi: 10.1002/hep.24787. [DOI] [PubMed] [Google Scholar]
- 13.Vagu C, et al. Serum iron markers in patients with chronic hepatitis C infection. Hepat. Mon. 2013;13:e13136. doi: 10.5812/hepatmon.13136. [DOI] [PMC free article] [PubMed] [Google Scholar]
- 14.Walker EM, Jr, Walker SM. Effects of iron overload on the immune system. Ann. Clin. Lab. Sci. 2000;30:354–365. [PubMed] [Google Scholar]
- 15.Distante S, et al. Raised serum ferritin predicts non-response to interferon and ribavirin treatment in patients with chronic hepatitis C infection. Liver. 2002;22:269–275. doi: 10.1046/j.0106-9543.2002.01672.x. [DOI] [PubMed] [Google Scholar]
- 16.Barut S, et al. Serum ferritin levels in chronic hepatitis C patients during antiviral therapy and prediction of treatment response. Scand. J. Infect. Dis. 2012;44:761–765. doi: 10.3109/00365548.2012.677545. [DOI] [PubMed] [Google Scholar]
- 17.Hamamoto S, et al. Changes in serum lipid concentrations in patients with chronic hepatitis C virus positive hepatitis responsive or non-responsive to interferon therapy. J. Gastroenterol. Hepatol. 2005;20:204–208. doi: 10.1111/j.1440-1746.2004.03526.x. [DOI] [PubMed] [Google Scholar]
- 18.Teijaro JR. Pleiotropic roles of type 1 interferons in antiviral immune responses. Adv. Immunol. 2016;132:135–158. doi: 10.1016/bs.ai.2016.08.001. [DOI] [PMC free article] [PubMed] [Google Scholar]
- 19.Halfon P, Locarnini S. Hepatitis C virus resistance to protease inhibitors. J. Hepatol. 2011;55:192–206. doi: 10.1016/j.jhep.2011.01.011. [DOI] [PubMed] [Google Scholar]
- 20.Knovich MA, et al. Ferritin for the clinician. Blood Rev. 2009;23:95–104. doi: 10.1016/j.blre.2008.08.001. [DOI] [PMC free article] [PubMed] [Google Scholar]
- 21.Chang ML, et al. Distinct patterns of the lipid alterations between genotype 1 and 2 chronic hepatitis C patients after viral clearance. PLoS ONE. 2014;9:e104783. doi: 10.1371/journal.pone.0104783. [DOI] [PMC free article] [PubMed] [Google Scholar]
- 22.Cheng YT, et al. Rheumatoid factor and immunoglobulin M mark hepatitis C-associated mixed cryoglobulinaemia: An 8-year prospective study. Clin. Microbiol. Infect. 2020;26:366–372. doi: 10.1016/j.cmi.2019.06.018. [DOI] [PubMed] [Google Scholar]
- 23.Chang ML, et al. Interactive impacts from hepatitis C virus infection and mixed cryoglobulinemia on complement levels. Dig. Dis. Sci. 2020;1:1. doi: 10.1007/s10620-020-06507-9. [DOI] [PubMed] [Google Scholar]
- 24.Chang ML, Jeng WJ, Liaw YF. Clinical events after cessation of lamivudine therapy in patients recovered from hepatitis B flare with hepatic decompensation. Clin. Gastroenterol. Hepatol. 2015;13:979–986. doi: 10.1016/j.cgh.2014.10.023. [DOI] [PubMed] [Google Scholar]
- 25.Sanal MG. Biomarkers in nonalcoholic fatty liver disease-the emperor has no clothes? World J. Gastroenterol. 2015;21:3223–3231. doi: 10.3748/wjg.v21.i11.3223. [DOI] [PMC free article] [PubMed] [Google Scholar]
- 26.Suárez-Ortegón MF, et al. Ferritin, metabolic syndrome and its components: A systematic review and meta-analysis. Atherosclerosis. 2018;275:97–106. doi: 10.1016/j.atherosclerosis.2018.05.043. [DOI] [PubMed] [Google Scholar]
- 27.Zhu Y, et al. Association between iron status and risk of chronic kidney disease in Chinese adults. Front. Med. (Lausanne) 2020;6:303. doi: 10.3389/fmed.2019.00303. [DOI] [PMC free article] [PubMed] [Google Scholar]
- 28.Kotze MJ, et al. Pathogenic mechanisms underlying iron deficiency and iron overload: New insights for clinical application. EJIFCC. 2009;20:108–123. [PMC free article] [PubMed] [Google Scholar]
- 29.Silva IS, et al. Iron overload in patients with chronic hepatitis C virus infection: clinical and histological study. J. Gastroenterol. Hepatol. 2005;20:243–248. doi: 10.1111/j.1440-1746.2004.03549.x. [DOI] [PubMed] [Google Scholar]
- 30.Himoto T, et al. Insulin resistance derived from zinc deficiency in non-diabetic patients with chronic hepatitis C. Exp. Ther. Med. 2010;1:707–711. doi: 10.3892/etm_00000109. [DOI] [PMC free article] [PubMed] [Google Scholar]
- 31.Sumida Y, et al. Hepatic iron accumulation may be associated with insulin resistance in patients with chronic hepatitis C. Hepatol. Res. 2007;37:932–940. doi: 10.1111/j.1872-034X.2007.00152.x. [DOI] [PubMed] [Google Scholar]
- 32.Furutani M, et al. YInsulin resistance/beta-cell function and serum ferritin level in non-diabetic patients with hepatitis C virus infection. Liver Int. 2003;23:294–299. doi: 10.1034/j.1600-0676.2003.00841.x. [DOI] [PubMed] [Google Scholar]
- 33.Hwang EW, et al. Implications of rapid virological response in hepatitis C therapy in the US veteran population. Aliment. Pharmacol. Ther. 2012;35:105–115. doi: 10.1111/j.1365-2036.2011.04903.x. [DOI] [PubMed] [Google Scholar]
- 34.Jorquera F, et al. Impairment of metabolic function in chronic hepatitis C is related to factors associated with resistance to therapy. Am. J. Gastroenterol. 2001;96:2456–2461. doi: 10.1111/j.1572-0241.2001.04053.x. [DOI] [PubMed] [Google Scholar]
- 35.Petta S, et al. Insulin resistance and diabetes increase fibrosis in the liver of patients with genotype 1 HCV infection. Am. J. Gastroenterol. 2008;103:1136–1144. doi: 10.1111/j.1572-0241.2008.01813.x. [DOI] [PubMed] [Google Scholar]
- 36.Sumida Y, et al. Impact of amino acid substitutions in hepatitis C virus genotype 1b core region on liver steatosis and glucose tolerance in non-cirrhotic patients without overt diabetes. J. Gastroenterol. Hepatol. 2011;26:836–842. doi: 10.1111/j.1440-1746.2010.06568.x. [DOI] [PubMed] [Google Scholar]
- 37.Sebastiani G, et al. Hepatic iron, liver steatosis and viral genotypes in patients with chronic hepatitis C. J. Viral. Hepat. 2006;13:199–205. doi: 10.1111/j.1365-2893.2005.00662.x. [DOI] [PubMed] [Google Scholar]
- 38.Mancone C, et al. Ferritin heavy chain is the host factor responsible for HCV-induced inhibition of apoB-100 production and is required for efficient viral infection. J. Proteome. Res. 2012;11:2786–2797. doi: 10.1021/pr201128s. [DOI] [PubMed] [Google Scholar]
- 39.Mehta R, et al. Safety and efficacy of sofosbuvir and daclatasvir for hepatitis C virus infection in patients. J. Clin. Exp. Hepatol. 2018;8:3–6. doi: 10.1016/j.jceh.2017.06.002. [DOI] [PMC free article] [PubMed] [Google Scholar]
- 40.Origa R, et al. Treatment of hepatitis C virus infection with direct-acting antiviral drugs is safe and effective in patients with hemoglobinopathies. Am. J. Hematol. 2017;92:1349–1355. doi: 10.1002/ajh.24911. [DOI] [PubMed] [Google Scholar]
- 41.IInomata S, et al. Changes in the serum hepcidin-to-ferritin ratio with erythroferrone after hepatitis C virus eradication using direct-acting antiviral agents. Intern. Med. 2019;58:2915–2922. doi: 10.2169/internalmedicine.2909-19. [DOI] [PMC free article] [PubMed] [Google Scholar]
- 42.Carvalho JR, et al. Lipids, glucose and iron metabolic alterations in chronic hepatitis C after viral eradication—comparison of the new direct-acting antiviral agents with the old regimens. Scand. J. Gastroenterol. 2018;53:857–863. doi: 10.1080/00365521.2018.1473486. [DOI] [PubMed] [Google Scholar]
- 43.Fujita N, et al. Patients with chronic hepatitis C achieving a sustained virological response to peginterferon and ribavirin therapy recover from impaired hepcidin secretion. J. Hepatol. 2008;49:702–710. doi: 10.1016/j.jhep.2008.05.014. [DOI] [PubMed] [Google Scholar]
- 44.Mangia A, et al. Randomised clinical trial: Sofosbuvir and ledipasvir in patients with transfusion-dependent thalassaemia and HCV genotype 1 or 4 infection. Aliment. Pharmacol. Ther. 2017;46:424–431. doi: 10.1111/apt.14197. [DOI] [PubMed] [Google Scholar]
- 45.Amanzada A, et al. Vitamin D status and serum ferritin concentration in chronic hepatitis C virus type 1 infection. J. Med. Virol. 2013;85:1534–1541. doi: 10.1002/jmv.23632. [DOI] [PubMed] [Google Scholar]
- 46.Ladero JM, et al. Oscillations in serum ferritin associated with antiviral therapy in chronic hepatitis C. Rev. Esp. Enferm. Dig. 2009;101:31–40. doi: 10.4321/S1130-01082009000100004. [DOI] [PubMed] [Google Scholar]
- 47.Nagashima M, et al. Elevated serum ALT levels during pegylated interferon monotherapy may be caused by hepatic iron overload. Intervirology. 2008;1:76–85. doi: 10.1159/000122604. [DOI] [PubMed] [Google Scholar]
- 48.Kamar N, et al. Factors accelerating liver fibrosis progression in renal transplant patients receiving ribavirin monotherapy for chronic hepatitis C. J. Med. Virol. 2005;76:61–68. doi: 10.1002/jmv.20323. [DOI] [PubMed] [Google Scholar]
- 49.Soota K, Maliakkal B. Ribavirin induced hemolysis: A novel mechanism of action against chronic hepatitis C virus infection. World. J. Gastroenterol. 2014;20:16184–16190. doi: 10.3748/wjg.v20.i43.16184. [DOI] [PMC free article] [PubMed] [Google Scholar]
- 50.Saab S, et al. Toward the elimination of hepatitis C in the United States. Hepatology. 2018;67:2449–2459. doi: 10.1002/hep.29685. [DOI] [PubMed] [Google Scholar]
Associated Data
This section collects any data citations, data availability statements, or supplementary materials included in this article.
Supplementary Materials
Data Availability Statement
The data that support the findings of this study are available on request from the corresponding author (MLC).