Abstract
Background
Nuclear receptor-interacting protein 1 (NRIP1), also named NR140, has been observed differentially express in multiple cancers, but the expression levels and the prognostic role of NRIP1 in stomach adenocarcinoma (STAD) remain unclear.
Methods
We used the Gene Expression Profiling Interactive Analysis (GEPIA) to analyze the NRIP1 expression levels in STAD, subgroups analysis of expression of NRIP1 via the UALCAN dataset. Further, cBioPortal was used to investigate the aberration type, co-mutations status, and located mutation of NRIP1. Correlated genes, and kinases, microRNA (miRNA), and transcription factor (TF) targets were identified using LinkedOmics. The Kaplan-Meier (K-M) plotter was used to analyze the prognosis of NRIP1 and the significantly correlated genes in STAD. Then, the tumor immune estimation resource (Timer) was used to explore the relation between NRIP1 and the immune cell infiltration, and the role of immune cells in STAD. The Human Protein Atlas (HPA) was used to confirm the NRIP1 protein express in STAD stomach tissue and normal stomach tissue.
Results
NRIP1 significantly overexpress in STAD, and the NRIP1 expression levels were impacted by clinical features. Overexpression of NRIP1 indicated the poor prognosis of STAD. Functional enrichment analysis showed the NRIP1 mainly enriched in immune response-regulating signaling pathway, cell-substrate adhesion, mRNA processing, and pathway in cancer. Overexpression USP25, SNYJ1 indicated the poor outcome of STAD, but the overexpression of BACH1 indicated protective biomarker. MIR-331 and MIR-132 have important role in STAD. Further, NRIP1 had a significant relation with immune infiltrates and other defined genes that significantly impact immune infiltrates. Immunohistochemical showed NRIP1 protein was higher in STAD than normal sample.
Conclusions
In this study, we revealed that overexpression of NRIP1 in the STAD sample compared to normal samples, NRIP1 significantly associated with macrophage. The high expression levels of NRIP1 and more macrophage infiltration led to poor prognosis of STAD.
Keywords: Nuclear receptor-interacting protein 1 (NRIP1), stomach adenocarcinoma, prognostic role
Introduction
Last century, gastric cancer (GC), also named stomach adenocarcinoma (STAD), was the most common cancer type in the United States. With the development of therapy and diagnostic methods, the incidence and mortality of GC have decreased in the past five decades, but GC remains the primary cause of cancer-associated death. Each year, there are about 1 million individuals be newly diagnosed with GC, and 782,685 people die of this cancer worldwide (1). With the high morbidity and mortality, GC is a considerable challenge for global public health. Thus, it is urgently needed the explore the more sensitive and efficient biomarker for diagnosing, even as the targeted therapy of STAD. Nowadays, combination surgery with systemic multi-line chemotherapy could prolong the longevity of STAD patients, but these treatment regimens only saved less 30% STAD patients’ life (2). For the metastatic STAD, the cornerstone is remaining cytotoxic chemotherapy. To date, there were several studies that investigated the efficacy of target therapy for STAD such as apatinib, trastuzumab, and ramucirumab (3-5). With the rapid development of immunotherapy in cancer therapy, several studies also explored the efficacy and safety of immunotherapy for STAD as well (6,7).
In 1995, nuclear receptor-interacting protein 1 (NRIP1) was the first time be found in the cancer cell, and the NRIP1 function is it interacts with estrogen receptor α (ER-α) (8). From then on, the interaction of NRIP1 and other nuclear receptors and transcription factors (TFs) had been found. Further, studies also found that NRIP1 expressed in multiple cancer types and served as a critical role in tumorigenesis, treatment response, and prognosis. For breast cancer, the NRIP1 downregulation may be associated with basal-like tumors (9). Turashvili et al. revealed the NRIP1 higher expression in ductal carcinomas than lobular carcinomas (10). The role of NRIP1 was the regulator or interactor of ER signaling and E2F signaling to affect breast cancer progression (11,12). The inhibition of NRIP1 can decrease the growth of breast cancer cells (13). Compared with normal samples, the NRIP1 was downregulated in hepatocellular carcinoma (HCC), and downregulation of NRIP1 leads to improve growth and migration ability HCC cancer cells (14). And the cir-NRIP1 accelerates the glycolysis and tumor progression via regulating miR-186-5p/MYH9 axis in STAD (15). This indicated the circulating NRIP1 also as the oncogenic roles. NRIP1 not only play a key role in cancer process but also acts as a significant part in the other diseases. NRIP1 also severed as an important regulator of energy metabolism and coronary artery disease (16,17). These results showed that NRIP1 expression levels had a significant role in cancer patients’ prognosis. However, the NRIP1biological functions in these cancers and the NRIP1 expression levels and prognostic role in STAD still unclear. With these, we found the expression levels and prognostic role of NRIP1 and further analyzed the potential biological functions in STAD via comprehensive bioinformatics analysis. We present the following article in accordance with the MDAR reporting checklist (available at http://dx.doi.org/10.21037/atm-20-6197).
Methods
The Gene Expression Profiling Interactive Analysis (GEPIA) analysis
GEPIA is a web-based tool to deliver fast and customizable functionalities from The Cancer Genome Atlas (TCGA), and Genotype-Tissue Expression (GTEx) project provides essential interactive functions, including differential expression analysis, profiling plotting, correlation analysis, and patient survival analysis (18). We used the GEPIA to analyze the NRIP1 expression levels in STAD.
UALCAN database analysis
The UALCAN (http://ualcan.path.uab.edu) is an easy-to-use, interactive web-portal that can perform in-depth analyses of TCGA gene expression data (19). To further analyze the factors that affect the NRIP1 expression in STAD. We use the UALCAN dataset to perform the subgroup analysis. In our study, UALCAN, as used to confirm the expression data of NRIP1, has examined via the “Expression Analysis” module and the “STAD” dataset.
Analyzing the mutation types, mutated location, and the structure of NRIP1 through cBioPortal
The cBioPortal for Cancer Genomics (http://cbioportal.org) provides a Web resource for exploring, visualizing, and analyzing multidimensional cancer genomics data (20). We explored the aberration type of subgroups and investigated the location and structure of NRIP1 in GC via cBioPortal.
Kaplan-Meier (K-M) plotter analysis
The K-M plotter is capable of assessing the effect of 54 k genes [mRNA, microRNA (miRNA), protein] on survival in 21 cancer types, including breast, ovarian, lung, and GC. Sources for the databases include GEO, EGA, and TCGA (21). The primary purpose of the tool is a meta-analysis-based discovery and validation of survival biomarkers. We used KM plotter to confirm the prognostic values of NRIP1 and the significantly correlated genes in STAD.
Protein-Protein network construction via GeneMANIA
GeneMANIA is a commonly used website for performing protein-protein interaction (PPI) network analysis and predicting the function of preferred genes (22). This user-friendly online tool can display gene or gene lists using bioinformatics methods, including gene co-expression, physical interaction, gene co-location, gene enrichment analysis, and website prediction. We constructed the NRIP1 PPI network via GeneMANIA.
The LinkedOmics dataset
The LinkedOmics database (http://www.linkedomics.org) contains multi-omics data and clinical data for 32 cancer types comprising 11,158 patients from the TCGA project. It provides a unique platform for scholars to access, analyze, and compare cancer multi-omics data within and across tumor types (23). The “LinkFinder” module was used to investigate differentially expressed genes within the TCGA STAD cohort. The “LinkInterpreter” module was used to perform analysis of kinase target s, miRNA target, and TF target for NRIP1. Results were analyzed for significance using the spearman’s correlation test. The P value cutoff was 0.05.
Tumor Immune Estimation Resource (Timer) analysis
TIMER web server is a comprehensive resource for systematical analysis of immune infiltrates across diverse cancer types. The abundances of six immunes infiltrate (B cells, CD4+ T cells, CD8+ T cells, Neutrophils, Macrophages, and Dendritic cells) are estimated by the TIMER algorithm. TIMER web server allows users to input function-specific parameters, with resulting figures dynamically displayed to conveniently access the tumor immunological, clinical, and genomic features (24). We investigated the relation NRIP1 between immune infiltration, the association prognosis with immune cell infiltration, and the effect factors of immune infiltration and outcomes of STAD via TIMER dataset.
The analysis of Human Protein Atlas (HPA)
The HPA (http://www.proteinatlas.org) aims to map all the human proteins in cells, tissues, and organs using the integration of various omics technologies, including antibody-based imaging, mass spectrometry-based proteomics, transcriptomics, and systems biology (25). All the data in the knowledge resource is open access to allow scientists both in academia and industry to access the data for exploration of the human proteome freely. Finally, we used the HPA database to investigate the NRIP1 expression levels in normal and STAD tissue.
The study was conducted in accordance with the Declaration of Helsinki (as revised in 2013).
Statistics analysis
The statistics analysis of NRIP1 expression levels and the prognostics values for STAD via the public database statistics analysis methods.
Results
Expression analysis
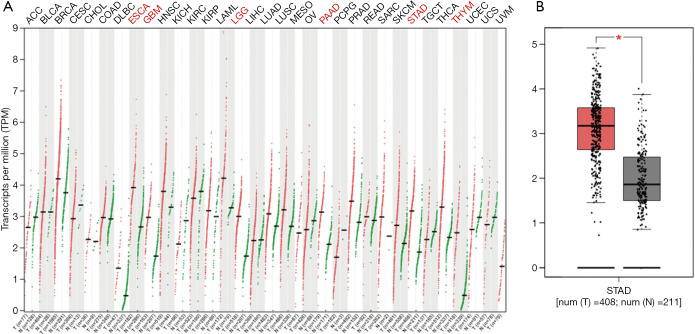
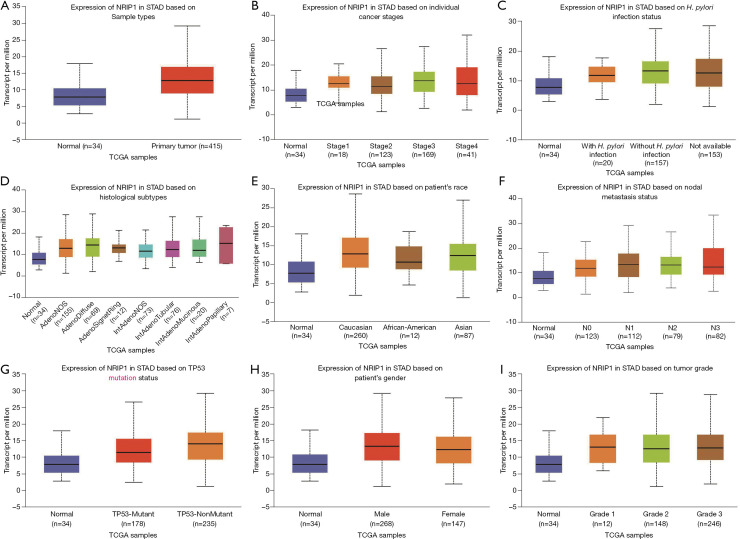
To explore the NRIP1 differentially express in different cancer types and GC. We used the GEPIA primarily to investigate the NRIP1 expression in human cancers, and independently used GEPIA to perform NRIP1 expression levels in GC. Further, we used the UALCAN database to analyze the relationship between clinical features and the NRIP1 expression. NRIP1 was found significantly express in six cancer types that including cervical squamous cell carcinoma and endocervical adenoma (ESCA), glioblastoma multiform (GBM), brain lower-grade glioma (LGG), pancreatic adenocarcinoma (PAAD), STAD, and thymoma (Figure 1A), and we independently performed the expression of NRIP1 in STAD (Figure 1B). These results showed that NRIP1 is an upregulated expression in multiple cancers. Further, we used the UALCAN to perform a subgroup analysis of NRIP1 expression of STAD. These results showed that the NRIP1 significantly overexpressed in the STAD samples compared to normal samples. On the clinical features, we also reanalyzed the NRIP1 expression levels in different clinical status. The results showed that the NRIP1 was the higher expression in STAD samples compared with normal samples (Figure 2A), the more tumor burden the higher NRIP1 expression (Figure 2B). NRIP1 expression levels may affect H. pylori infection, with H. pylori infection would have lower NRIP1 expression than without infection (Figure 2C). Histological subtypes influence NRIP1 expression as well. The intestinal adenocarcinoma (Papillary) does not have a difference in NRIP1 expression between tumor tissue and normal tissue (Figure 2D). The patient’s race did not have a deep influence on NRIP1 expression (Figure 2E). There was no difference found between nodal metastasis status and NRIP1 expression (Figure 2F). The co-mutated status of TP53 also affected the NRIP1 expression that co-mutation with TP53 led to downregulation (Figure 2G). Gender did not have any impact (Figure 2H). Tumor grade was associated with NRIP1 expression. The grade 1 and grade 3 had a significant difference (Figure 2I).
Figure 1.
NRIP1 expression levels in different human cancers. (A) Increased or decreased NRIP1 in data sets of different cancers compared with normal tissues in the GEPIA. (B) NRIP1 expression in STAD samples and paired normal samples determined by GEPIA. NRIP1, nuclear receptor-interacting protein 1; GEPIA, Gene Expression Profiling Interactive Analysis; STAD, stomach adenocarcinoma.
Figure 2.
The relation between NRIP1 expression levels and clinical features via UALCAN. (A) Compared cancer and normal samples; cancer sample with higher expression of NRIP1. (B) Stage of STAD; advance cancer patients may have higher NRIP1 expression. (C) H. pylori infection status; H. pylori infection may decrease NRIP1 expression. (D) Histological subtypes. (E) Race. (F) Nodal metastasis status; the more nodal metastasis, the higher expression NRIP1. (G) Co-mutated with TP53; TP53 mutation leads to downregulation of NRIP1. (H) Patients gender. (I) Tumor grade. NRIP1, nuclear receptor-interacting protein 1; STAD, stomach adenocarcinoma.
c-BioPortal analysis
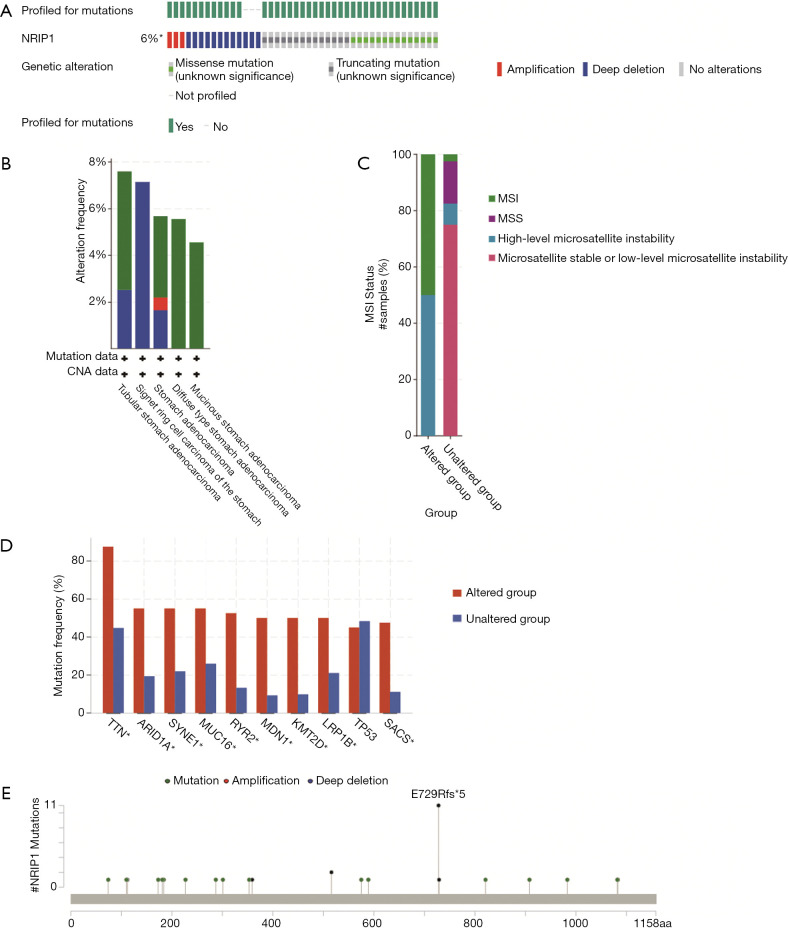
There are many mutation types for genes, including missense, amplification, and deep deletion. The different mutated types may be distinct functions of genes. We used c-Bioportal to analyze the mutated-types, co-mutations, and the structure of NRIP1. The results showed that the mutate types of NRIP1, including missense mutation, truncating mutation, amplification, and deep deletion (Figure 3A). The aberration types in different histological subtypes and microsatellite instability (Figure 3B,C). The most often co-mutated genes, including TTN, ARID1A, SYNE1, MUC16, RYR2, MDN1, KMT2D, LRP1B, TP53, SACS for the altered group and unaltered group of NRIP1 (Figure 3D). The located mutation of NRIP1 was performed via cBioPortal as well (Figure 3E).
Figure 3.
Aberration types, located mutation, the co-mutation status of NRIP1, and the relation between microsatellite instability and NRIP1 mutations. (A) Aberration types and frequency of NRIP1 in STAD; missense and deep deletion mutation types are the most common, 6% mutations of NRIP1 in STAD. (B) The aberration types and histological subtypes. (C) The relation between microsatellite instability and NRIP1 mutations; NRIP1 mutations may have higher levels microsatellite instability. (D) Co-mutations with NRIP1. (E) Locations of NRIP1 mutations. NRIP1, nuclear receptor-interacting protein 1; STAD, stomach adenocarcinoma.
Survival analysis of NRIP1
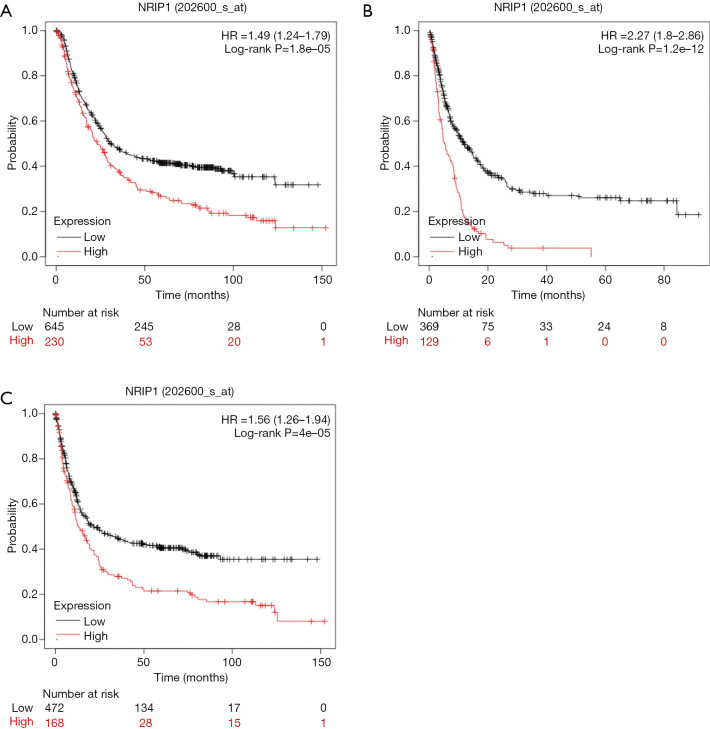
We used the K-M plotter to confirm the NRIP1 prognostics role in STAD. We analyze the relationship between NRIP1 expression levels and post-progression survival (PPS), free-progression (FP), and overall survival for STAD via K-M plotter. The results showed that overexpression of NRIP1 led to shortening the OS (HR =1.49, log-rank P=1.8e−05), FP (HR =1.56, log-rank P=4e−05), PPS of STAD patients (Figure 4A,B,C).
Figure 4.
The prognostic role of the NRIP1 gene (Kaplan-Meier plotter). (A,B,C) High NRIP1 expression was correlated with poor prognosis of OS, PPS, and FS in STAD. NRIP1, nuclear receptor-interacting protein 1; STAD, stomach adenocarcinoma; os, overall survival; PPS, post-progression survival; FS, free-progression.
Correlated significant genes analysis
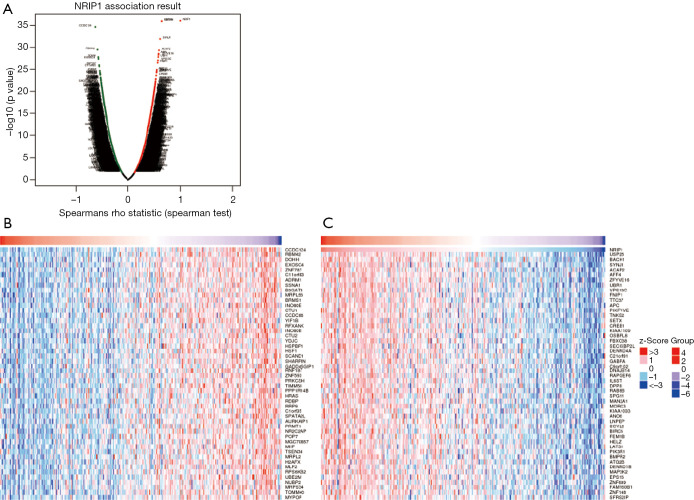
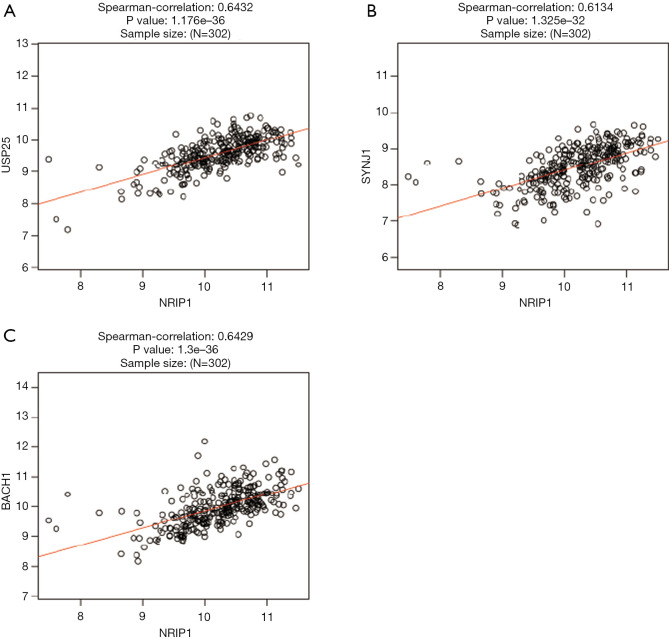
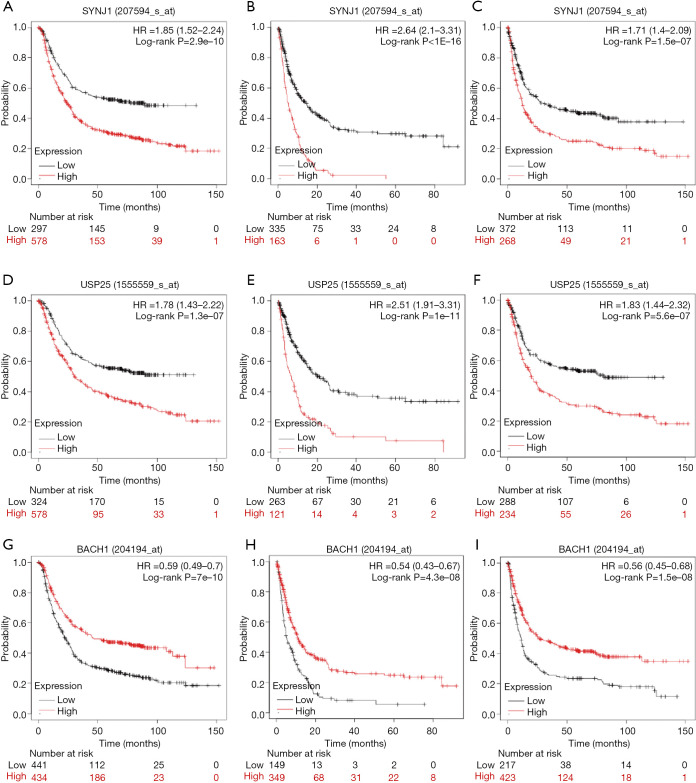
Tumorigenesis is a complicated process; this process may include many genes aberration. So, we use the LinkedOmics to find the top 50 associated genes of NRIP1, further selected the correlated significant (cor ≥0.6) genes of NRIP1 to conduct prognosis analysis. The results showed that the top 50 positively and negatively correlated significant genes (Figure 5A,B,C). There were three correlated significant genes of NRIP1 that USP25 (Spearman correlation =6.432-01, P value =1.176e−36), BACH1(Spearman correlation =6.429e−01, P value =1.300e−36), and SNYJ1 (Spearman correlation =6.134e−01, P value =1.325e−32)consistent with the selected threshold (Figure 6A,B,C). The prognostics value of selected genes in STAD showed that overexpression USP25, SNYJ1 indicated the poor outcome of STAD (Figure 7A,B,C,D,E,F), but the overexpression of BACH1 indicated a satisfactory prognosis (Figure 7G,H,I).
Figure 5.
Correlated significant genes of NRIP1 (LinkedOmics). (A,B,C) Volcano plots and heat maps showing genes positively and negatively genes correlated with NRIP1 in STAD, respectively (top 50). Red suggests positively correlated genes and green shows negatively correlated genes. NRIP1, nuclear receptor-interacting protein 1; STAD, stomach adenocarcinoma.
Figure 6.
Gene correlation expression analysis for NRIP1 (LinkedOmics). (A,B,C) The scatter plots show spearman-correlation of NRIP1 expression with expression of USP25, SYNJ1, and BACH1 in STAD. NRIP1, nuclear receptor-interacting protein 1; STAD, stomach adenocarcinoma; SYNJ1, Synaptojanin 1; BACH1, BTB and CNC homology 1, basic leucine zipper transcription factor 1; USP25, ubiquitin-specific protease 25.
Figure 7.
Prognostic analysis of genes correlated with NRIP1 in STAD (Kaplan-Meier plotter). (A,B,C) The overall survival, post-progression survival, free-progress curves of SYJN1. (D,E,F) The overall survival, post-progression survival, free-progress curves of USP25. (G,H,I) The overall survival, post-progression survival, free-progress curves of BACH1. NRIP1, nuclear receptor-interacting protein 1; STAD, stomach adenocarcinoma.
Enrichment functions of NRIP1
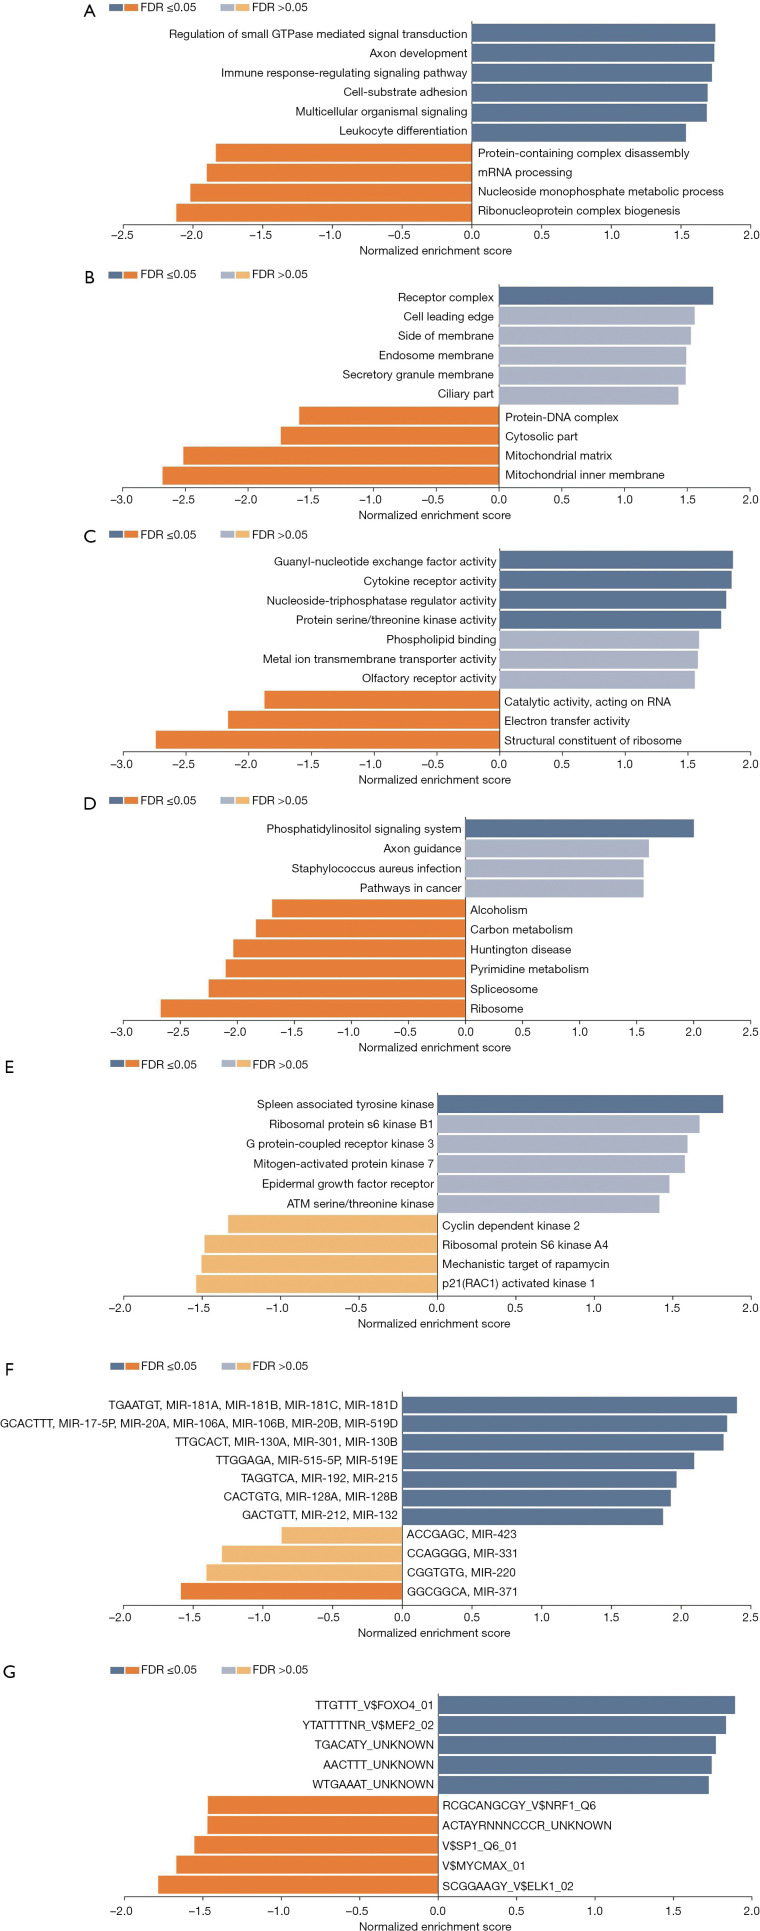
To investigate the potential biological functions of NRIP1. We used the Linkomics dataset to analyze the biological process (BP), cellar component (CC), molecular function (MF), and the KEGG pathway. The results showed that the functions of NRIP1, including regulation of small GTPase mediated signal transduction, immune response-regulating signaling pathway, cell-substrate adhesion, mRNA processing, and protein production (Figure 8A,B,C). And NRIP1 may take part in the crucial pathways, including a pathway in cancer, ribosome, carbon mentalism, and phosphatidylinositol signaling system (Figure 8D).
Figure 8.
Functions enrichment and miRNA targets, transcription factors targets, kinases targets of NRIP1 (LinkedOmics). (A) Biological process (BP) of NRIP1 in STAD. (B) Cellar component (CC) of NRIP1 in STAD. (C) Molecular functions (MF) of NRIP1 in STAD. (D) Kyoto Encyclopedia of Genes and Genomes (KEGG) pathway in STAD. (E) Kinases targets of NRIP1. (F) miRNA targets of NRIP1. (G) Transcription factors of NRIP1. NRIP1, nuclear receptor-interacting protein 1. STAD, stomach adenocarcinoma.
Kinase targets, TFs targets, and miRNA targets of NRIP1
Gene expression is affected by many factors, the most important regulators, including kinase, TFs, and miRNA. To incite regulators that regulate NRIP1 expression in STAD, we used the LinkedOmics database to find the significant kinase, TFs, miRNA targets of NRIP1. The results showed the significant miRNAs targets including (TGAATGT)MIR-181A, MIR-181B, MIR-181C, MIR-181D, (GCACTTT)MIR-17-5P, MIR-20A, MIR-106A, MIR-106B, MIR-20B, MIR-519D, (TTGCACT)MIR-130A, MIR-301, MIR-130B, (TTGGAGA)MIR-515-5P, MIR-519E, (TAGGTCA)MIR-192,MIR-215, (CACTGTG)MIR-128A, MIR-128B, (GACTGTT)MIR-212, MIR-132, (ACCGAGC)MIR-423, (CCAGGGG)MIR-331, (CGGTGTG)MIR-220, and (GGCGGCA)MIR-371 (Figure8E). The kinases target including spleen associated tyrosine kinase (SYK), epidermal growth factor receptor (EGFR), ATM serine/threonine kinase, cyclin-dependent kinase 2 (CDK2), p21 (RAC1) activated kinase 1, and other important kinase targets (Figure 8F). TFs targets results showed that TTGTTT_V$FOXO4_01, YTATTTTNR_V$MEF2_02, RCGCANGCGY_V$NRF1_Q6, V$SP1_Q6_01, V$MYCMAX_01, and SCGGAAGY_V$ELK1_02 are the significant TFs targets for NRIP1 (Figure 8G). These clues further showed that NRIP1 functioned as an important function in various cancers.
PPI network analysis of NRPI1
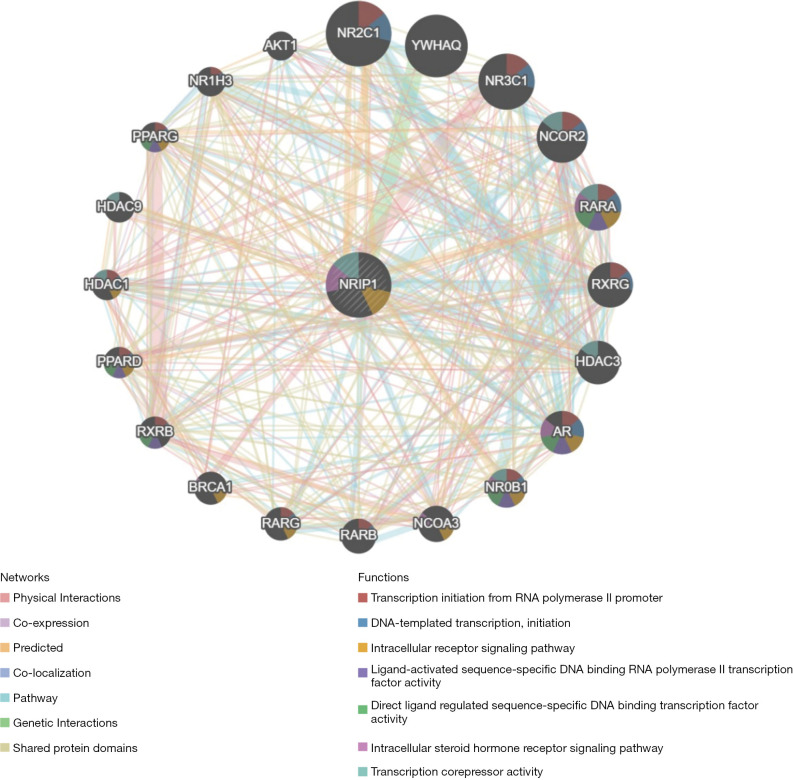
Further, we constructed the PPI network to analyze the NRIP1 interacts with other genes. The PPI network showed that NRIP1 significantly interacted with BRCA1, NR0B1, AR, RARA, HDAC1, and other essential genes. The biological functions of these genes may include the transcription initiation from RNA polymerase II promoter DNA-templated transcription, initiation intracellular receptor signaling pathway, ligand-activated sequence-specific DNA binding RNA polymerase II TF activity, direct ligand regulated sequence-specific DNA binding TF activity, intracellular steroid hormone receptor signaling pathway, and transcription corepressor activity (Figure 9). These results showed the NRIP1 played a crucial role in cancer.
Figure 9.
Protein-protein interaction network of NRIP1 (GeneMANIA). Protein-protein interaction (PPI) network and functional analysis showing the gene set enriched in the target network of NRIP1. Distinct colors of the network edge indicate the bioinformatics methods applied: physical interactions, co-expression, predicted, co-localization, pathway, genetic interactions, and shared protein domains. The distinct colors for the network nodes show the biological functions of the sets of enrichment genes.
Timer analysis
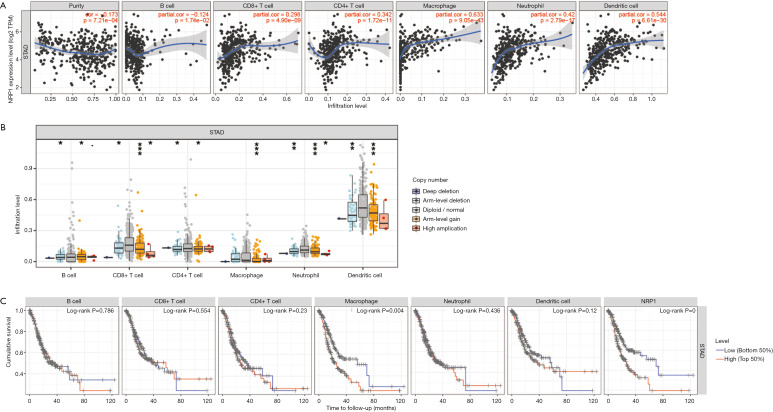
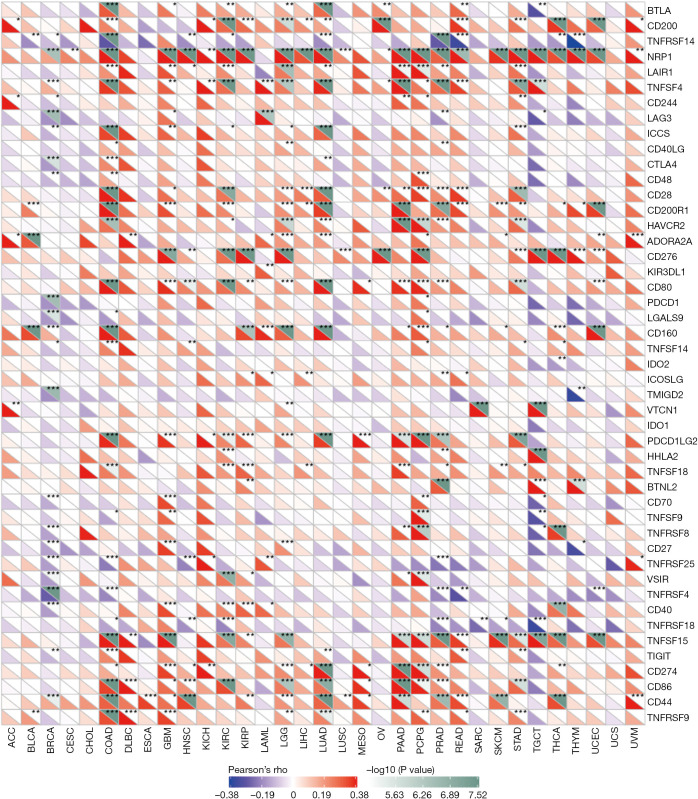
The immune cell infiltration has a deep influence on the prognosis of some cancer types. We aimed to investigate the relationship between NRIP1 and immune cell infiltration and to explore further whether immune cell infiltration is associated with the prognosis of STAD via Timer. The results showed that NRIP1 had a positively significant correlation with macrophage(cor =0.633, P=9.05e−43) and dendritic (cor =0.544, P=6.61e−30) cell infiltration, and NRIP1 had the positive relation with CD8+ T Cell (cor =0.298, P=4.90e−09), CD4+ T Cell (cor =0.342, p=1.72e−11), and neutrophil (cor =0.42, P=2.79e−17) as well (Figure 10A). Further, we investigated the relationship between somatic copy number aberration (CAN) and an abundance of immune infiltrates. The results showed that arm-level gain and arm-level deletion were the most significant impactors for immune infiltrates, and high amplification affected the CD8+ T Cell and neutrophil infiltration (Figure 10B). Finally, we explored the relationship between immune cell infiltration and prognosis for STAD. The results showed that high macrophage cell infiltration and overexpression NRIP1 indicated the poor outcome of STAD (Figure 10C). Further, the relation between immune cell filtration and other important genes was performed (Figure 11)
Figure 10.
The relation between immune cells infiltration and NRIP1 in STAD (Timer). (A) Association between NRIP1 and several types of immune cell infiltration. (B) Relation between aberration types and immune cell infiltration. (C) The prognostic role of various immune cells in STAD. Timer, Tumor Immune Estimation Resource; STAD, stomach adenocarcinoma.
Figure 11.
The relations between the defined significant genes of immune cell infiltration and STAD. STAD, stomach adenocarcinoma.
HPA analysis
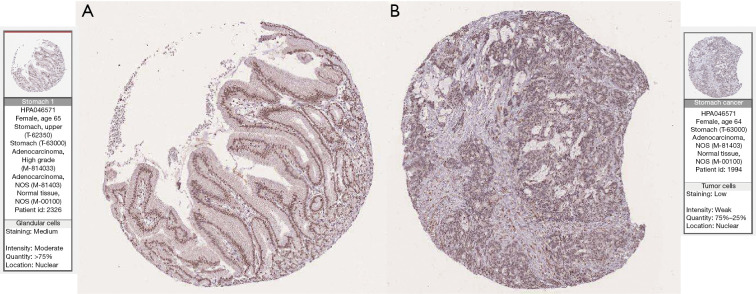
To investigate the difference, NRIP1 protein expression levels between normal and STAD tissue. We used the HPA to analyze. Interestingly, the results showed the NRIP1 protein downregulation in STAD (Figure 12A) compared to normal tissue (Figure 12B).
Figure 12.
The NRIP1 protein expression in stomach tissue (HPA). (A) NRIP1 protein expression in stomach adenocarcinoma tissue. (B) NRIP1 protein expression in normal stomach tissue. HPA, Human Protein Atlas.
Discussion
Although the advance of diagnosing and therapy methods, the STAD is still one of the significant cancer-related death causes worldwide. The underlying mechanisms of STAD tumorigenesis are still unclear, resistance therapy, and the tumor immune response, leading to the STAD patients, could not have been managed. Therefore, a more sensitive and specific novel biomarker for diagnosing STAD, even as the therapy target is urgently needed. From the past, many studies’ results showed that genetic changes acted as one of the most critical promotors for tumorigenesis and therapy resistance. Among the genetic changes, the NRIP1 had been observed aberration in multiple cancer types (9,14). The fundamental function of NRIP1 in cancer is still unclear. The functions of NRIP1 may be the regulator of the WNT signaling pathway, E2F signaling pathway, and ER signaling. And these signaling pathways play a crucial role in multiple cancers.
From these, we used bioinformatics to investigate the difference of NRIP1 expression level between normal and cancer samples, further analyze the relationship of NRIP1 expression level with STAD outcomes. The results showed that NRIP1 significantly overexpressed in STAD samples compared to normal samples, and the STAD patients’ clinical features, including age, cancer status, nodal metastasis, and co-mutations, had an influence on NRIP1 expression as well. And the higher expression of NRIP1 indicated the poor prognosis of STAD. To date, there is not any study that investigated the fundamental function of NRIP1 in STAD. The significantly correlated genes, including USP25, BACH1, and SYNJ1. The overexpression of USP25 and SYNJ1 indicated the poor prognosis of STAD, but the overexpression of BACH1 lead to positive outcomes. Upregulations of BACH1 was found in prostate cancer, and the high expression of BACH1 improved the invasion and migration of cancer cell (26). Ou et al. study revealed that overexpression of BACH1 was associated with poor prognosis of breast cancer patients (27). No study investigates the functions of USP25 and SYNJ1 in any cancer. The association these defined correlated significant genes with NRIP1 is not evident now. The fundamental biological functions of NRIP1 are needed to be further classified.
The PPI network and the enrichment functions of NRIP1 showed that the essential biological functions, including GTPase mediated signal transduction, immune response-regulating signaling pathway, cell-substrate adhesion, DNA transcription, mRNA processing, and transcription corepressor activity. Among these biological processes, the immune response, and the cell-substrate adhesion is one of the critical functions in cancer (28,29). With these, NRIP1 further is an integral part of tumorigenesis and progression.
Tumorigenesis is a complicated process. Many factors regulate oncogene expression, including TFs, kinases, and miRNAs. So, we further explored the TFs, kinases, and miRNAs potential targets of NRIP1. From the kinase targets of NRPI1, we can see that SYK, EGFR, CDK2, and P21 activated kinases (PAKs) targets of NRIP1. The overexpression of SYK indicated the poor prognosis of defined solid tumor types (30). In squamous cell carcinoma of the head and neck (SCCHN), higher expression SYK led to more mortality (31). These show SYK may function as the promoter of cancer progression. EGFR mutation was observed in multiple cancer types, including lung cancer (32), head and neck cancer (33), and pancreatic cancer (34), and use inhibitor of EGFR can improve the prognosis of these patients. According to CDK2, it is an essential regulator of normal or cancer cell cycle, and its activity is vital for loss of proliferative control during oncogenesis. The aberration of CDK2 is found in various cancers, including glioblastoma (35) and B cell lymphoma (36). CDK2 promotes breast cancer progression via phosphorylating and activating hormone receptors (37). The PAKs are a family of serine-threonine kinases that consist of 6 members, PAKs 1-6. In colorectal cancer cells, PAK1 knockdown resulted in inhibiting cell growth, cell survival, and cell invasiveness (38). Overexpression of PAK1 was observed in pancreatic ductal adenocarcinoma (PDAC), and the upregulation of PAK1 was related to aggressiveness (39). These results showed that the significant kinases target of NRIP1 might play a key role in STAD. Regrettably, the apparent relationship between NRPI1 and these significantly correlated genes remains understood, no study investigates these genes in STAD.
miRNAs are critical for post-transcriptional regulation of gene expression and function as a significant role in carcinogenesis. In this study, we found several significant miRNAs of NRIP1, including MIR-181, MIR-331, MIR-132, MIR-212, MIR-128, MIR-215, MIR-130, and MIR-106. Downregulation of MIR-181b associated with drug resistance for AML (40), MIR-181a, and MIR-181c can improve the therapeutic sensitivity for chronic myeloid leukemia patients (CML) (41,42). Dysregulation of the MIR-181 family has been observed in solid cancer, including breast cancer (43), cervical cancer (44), and ovarian cancer (45). In STAD, MIR-331 acts as the inhibit regulator of homolog 2 (HER2), in which over-expression resulted in epithelial-mesenchymal transition (EMT) (46). Overexpression of MIR-132 was found in GC, and the upregulation of MIR-132 can improve cell Proliferation via retinoblastoma 1 targeting (47). The upregulation of MIR-132 promotes the invasion and migration of pancreatic carcinoma cells by inhibiting PTEN (48). High expression MIR-212 functioned as tumor-suppressor of NSCLC by inhibition SOX4. For STAD, miR-212-3p was a regulator of carcinogenesis via targeting MeCP2 (49). Further analysis showed that MIR-212 inhibited the proliferation of GC by directly suppressing the retinoblastoma binding protein 2 (50). Liu et al. study revealed that MIR-128 had an association with response to chemotherapy (51). Therefore, MIR-106 appeared as a biomarker for STAD (52). MIR-130a was found in STAD, and miR-130a may promote cell migration and invasion by targeting RUNX3 (53). Among the miRNA’s targets of NRIP1, there are several miRNAs have been approved. They correlate with STAD, but the fewer miRNAs’ functions in STAD remain unclear. Further analysis should be conducted.
Except for these factors, the cancer microenvironment also has a vital role in tumorigenesis and progression. The immune cell infiltration is one of the most critical elements of the cancer microenvironment. Few studies explore the relation of immune cell infiltration between the prognosis of STAD. In our study, the results showed that NRIP1 positively significant correlation with macrophage infiltration in STAD, and the higher macrophage infiltration, the poorer outcomes of STAD patients. Tumor-associated macrophages (TAMs), show significant phenotypic heterogeneity and diverse functional capabilities under the influence of the local tumor microenvironment. The vital role of TAMs is that it accelerated the angiogenesis (54), metastasis (55), drug resistance, and growth of cancer cell stemness (56). Thus, the TAMs infiltration shows the adverse outcome of the defined cancer type.
Conclusions
In the present study, we comprehensively analyzed the expression and prognostic role of NRIP1 and preliminary explored the BP related to STAD progression. Our study results showed that NRIP1 significantly expressed in STAD samples compared to normal samples, and the overexpression of NRIP1 indicated the poor prognosis of STAD. The results of the enrichment function of NRIP1 showed that NRIP1 takes part in the cell-substrate adhesion, DNA transcription, mRNA processing, and transcription corepressor activity signaling pathways. The significant miRNAs (MIR-130, MIR-132, and MIR-106) targets and kinases (EGFR, PAK1, CDK2, and SYK) of NRIP1 are also taken part in several cancer pathways. These clues indicated NRIP1 might act as an essential role in STAD, but there are limitations of our study, including cannot construct a model to explore other factors that potentially affect the STAD prognosis, lackingthe validation of NRIP1 expression levels in STAD and normal samples, no vitro validated experiments.
Supplementary
The article’s supplementary files as
Acknowledgments
Funding: None.
Ethical Statement: The authors are accountable for all aspects of the work in ensuring that questions related to the accuracy or integrity of any part of the work are appropriately investigated and resolved. The study was conducted in accordance with the Declaration of Helsinki (as revised in 2013).
Reporting Checklist: The authors have completed the MDAR reporting checklist. Available at http://dx.doi.org/10.21037/atm-20-6197
Conflicts of Interest: Both authors have completed the ICMJE uniform disclosure form (available at http://dx.doi.org/10.21037/atm-20-6197). The authors have no conflicts of interest to declare.
(English Language Editor: J. Chapnick)
References
- 1.Bray F, Ferlay J, Soerjomataram I, et al. Global cancer statistics 2018: GLOBOCAN estimates of incidence and mortality worldwide for 36 cancers in 185 countries. CA Cancer J Clin 2018;68:394-424. 10.3322/caac.21492 [DOI] [PubMed] [Google Scholar]
- 2.Sun Z, Jia J, Du F, et al. Clinical significance of serum tumor markers for advanced gastric cancer with the first-line chemotherapy. Transl Cancer Res 2019;8:2680-90. 10.21037/tcr.2019.10.27 [DOI] [PMC free article] [PubMed] [Google Scholar]
- 3.Chen W, Yu J, Zhang Y, et al. First-line application of apatinib combined with S-1 based on peripheral circulating tumor cell screening to treat advanced gastric adenocarcinoma: a case report. Ann Transl Med 2019;7:181. 10.21037/atm.2019.03.68 [DOI] [PMC free article] [PubMed] [Google Scholar]
- 4.Bang YJ, Van Cutsem E, Feyereislova A, et al. Trastuzumab in combination with chemotherapy versus chemotherapy alone for treatment of HER2-positive advanced gastric or gastro-oesophageal junction cancer (ToGA): a phase 3, open-label, randomised controlled trial. Lancet 2010;376:687-97. 10.1016/S0140-6736(10)61121-X [DOI] [PubMed] [Google Scholar]
- 5.Fuchs CS, Tomasek J, Yong CJ, et al. Ramucirumab monotherapy for previously treated advanced gastric or gastro-oesophageal junction adenocarcinoma (REGARD): an international, randomised, multicentre, placebo-controlled, phase 3 trial. Lancet 2014;383:31-9. 10.1016/S0140-6736(13)61719-5 [DOI] [PubMed] [Google Scholar]
- 6.Kang YK, Boku N, Satoh T, et al. Nivolumab in patients with advanced gastric or gastro-oesophageal junction cancer refractory to, or intolerant of, at least two previous chemotherapy regimens (ONO-4538-12, ATTRACTION-2): a randomised, double-blind, placebo-controlled, phase 3 trial. Lancet 2017;390:2461-71. 10.1016/S0140-6736(17)31827-5 [DOI] [PubMed] [Google Scholar]
- 7.Zaanan A, Taieb J. How to better select patients with advanced gastric cancer for immunotherapy. Transl Gastroenterol Hepatol 2019;4:6. 10.21037/tgh.2019.01.06 [DOI] [PMC free article] [PubMed] [Google Scholar]
- 8.Cavaillès V, Dauvois S, L'Horset F, et al. Nuclear factor RIP140 modulates transcriptional activation by the estrogen receptor. Embo j 1995;14:3741-51. 10.1002/j.1460-2075.1995.tb00044.x [DOI] [PMC free article] [PubMed] [Google Scholar]
- 9.Docquier A, Harmand PO, Fritsch S, et al. The transcriptional coregulator RIP140 represses E2F1 activity and discriminates breast cancer subtypes. Clin Cancer Res 2010;16:2959-70. 10.1158/1078-0432.CCR-09-3153 [DOI] [PMC free article] [PubMed] [Google Scholar]
- 10.Turashvili G, Bouchal J, Baumforth K, et al. Novel markers for differentiation of lobular and ductal invasive breast carcinomas by laser microdissection and microarray analysis. BMC Cancer 2007;7:55. 10.1186/1471-2407-7-55 [DOI] [PMC free article] [PubMed] [Google Scholar]
- 11.Rosell M, Nevedomskaya E, Stelloo S, et al. Complex formation and function of estrogen receptor α in transcription requires RIP140. Cancer Res 2014;74:5469-79. 10.1158/0008-5472.CAN-13-3429 [DOI] [PubMed] [Google Scholar]
- 12.DeGregori J, Johnson DG. Distinct and Overlapping Roles for E2F Family Members in Transcription, Proliferation and Apoptosis. Curr Mol Med 2006;6:739-48. [DOI] [PubMed] [Google Scholar]
- 13.Aziz MH, Chen X, Zhang Q, et al. Suppressing NRIP1 inhibits growth of breast cancer cells in vitro and in vivo. Oncotarget 2015;6:39714-24. 10.18632/oncotarget.5356 [DOI] [PMC free article] [PubMed] [Google Scholar]
- 14.Zhang D, Wang Y, Dai Y, et al. Downregulation of RIP140 in hepatocellular carcinoma promoted the growth and migration of the cancer cells. Tumour Biol 2015;36:2077-85. 10.1007/s13277-014-2815-y [DOI] [PubMed] [Google Scholar]
- 15.Liu Y, Jiang Y, Xu L, et al. circ-NRIP1 Promotes Glycolysis and Tumor Progression by Regulating miR-186-5p/MYH9 Axis in Gastric Cancer. Cancer Manag Res 2020;12:5945-56. 10.2147/CMAR.S245941 [DOI] [PMC free article] [PubMed] [Google Scholar]
- 16.Du L, Xu Z, Wang X, et al. Integrated bioinformatics analysis identifies microRNA-376a-3p as a new microRNA biomarker in patient with coronary artery disease. Am J Transl Res 2020;12:633-48. [PMC free article] [PubMed] [Google Scholar]
- 17.De Marinis Y, Sun J, Bompada P, et al. Regulation of Nuclear Receptor Interacting Protein 1 (NRIP1) Gene Expression in Response to Weight Loss and Exercise in Humans. Obesity (Silver Spring) 2017;25:1400-9. 10.1002/oby.21899 [DOI] [PubMed] [Google Scholar]
- 18.Tang Z, Li C, Kang B, et al. GEPIA: a web server for cancer and normal gene expression profiling and interactive analyses. Nucleic Acids Res 2017;45:W98-W102. 10.1093/nar/gkx247 [DOI] [PMC free article] [PubMed] [Google Scholar]
- 19.Chandrashekar DS, Bashel B, Balasubramanya SAH, et al. UALCAN: A Portal for Facilitating Tumor Subgroup Gene Expression and Survival Analyses. Neoplasia 2017;19:649-58. 10.1016/j.neo.2017.05.002 [DOI] [PMC free article] [PubMed] [Google Scholar]
- 20.Gao J, Aksoy BA, Dogrusoz U, et al. Integrative analysis of complex cancer genomics and clinical profiles using the cBioPortal. Sci Signal 2013;6:pl1. 10.1126/scisignal.2004088 [DOI] [PMC free article] [PubMed] [Google Scholar]
- 21.Nagy Á, Lánczky A, Menyhárt O, et al. Validation of miRNA prognostic power in hepatocellular carcinoma using expression data of independent datasets. Sci Rep 2018;8:9227. 10.1038/s41598-018-27521-y [DOI] [PMC free article] [PubMed] [Google Scholar]
- 22.Montojo J, Zuberi K, Rodriguez H, et al. GeneMANIA: Fast gene network construction and function prediction for Cytoscape. F1000Res 2014;3:153. 10.12688/f1000research.4572.1 [DOI] [PMC free article] [PubMed] [Google Scholar]
- 23.Vasaikar SV, Straub P, Wang J, et al. LinkedOmics: analyzing multi-omics data within and across 32 cancer types. Nucleic Acids Res 2018;46:D956-63. 10.1093/nar/gkx1090 [DOI] [PMC free article] [PubMed] [Google Scholar]
- 24.Li T, Fan J, Wang B, et al. TIMER: A Web Server for Comprehensive Analysis of Tumor-Infiltrating Immune Cells. Cancer Res 2017;77:e108-10. 10.1158/0008-5472.CAN-17-0307 [DOI] [PMC free article] [PubMed] [Google Scholar]
- 25.Uhlén M, Fagerberg L, Hallström BM, et al. Proteomics. Tissue-based map of the human proteome. Science 2015;347:1260419. 10.1126/science.1260419 [DOI] [PubMed] [Google Scholar]
- 26.Shajari N, Davudian S, Kazemi T, et al. Silencing of BACH1 inhibits invasion and migration of prostate cancer cells by altering metastasis-related gene expression. Artif Cells Nanomed Biotechnol 2018;46:1495-504. 10.1080/21691401.2017.1374284 [DOI] [PubMed] [Google Scholar]
- 27.Ou X, Gao G, Bazhabayi M, et al. MALAT1 and BACH1 are prognostic biomarkers for triple-negative breast cancer. J Cancer Res Ther 2019;15:1597-602. 10.4103/jcrt.JCRT_282_19 [DOI] [PubMed] [Google Scholar]
- 28.Singh A, Winterbottom E, Daar IO. Eph/ephrin signaling in cell-cell and cell-substrate adhesion. Front Biosci (Landmark Ed) 2012;17:473-97. 10.2741/3939 [DOI] [PMC free article] [PubMed] [Google Scholar]
- 29.Dumauthioz N, Labiano S, Romero P. Tumor Resident Memory T Cells: New Players in Immune Surveillance and Therapy. Front Immunol 2018;9:2076. 10.3389/fimmu.2018.02076 [DOI] [PMC free article] [PubMed] [Google Scholar]
- 30.Chakraborty G, Rangaswami H, Jain S, et al. Hypoxia regulates cross-talk between Syk and Lck leading to breast cancer progression and angiogenesis. J Biol Chem 2006;281:11322-31. 10.1074/jbc.M512546200 [DOI] [PubMed] [Google Scholar]
- 31.Luangdilok S, Box C, Patterson L, et al. Syk tyrosine kinase is linked to cell motility and progression in squamous cell carcinomas of the head and neck. Cancer Res 2007;67:7907-16. 10.1158/0008-5472.CAN-07-0331 [DOI] [PubMed] [Google Scholar]
- 32.da Cunha Santos G, Shepherd FA, Tsao MS. EGFR mutations and lung cancer. Annu Rev Pathol 2011;6:49-69. 10.1146/annurev-pathol-011110-130206 [DOI] [PubMed] [Google Scholar]
- 33.Beck TN, Georgopoulos R, Shagisultanova EI, et al. EGFR and RB1 as Dual Biomarkers in HPV-Negative Head and Neck Cancer. Mol Cancer Ther 2016;15:2486-97. 10.1158/1535-7163.MCT-16-0243 [DOI] [PMC free article] [PubMed] [Google Scholar]
- 34.Fitzgerald TL, Lertpiriyapong K, Cocco L, et al. Roles of EGFR and KRAS and their downstream signaling pathways in pancreatic cancer and pancreatic cancer stem cells. Adv Biol Regul 2015;59:65-81. 10.1016/j.jbior.2015.06.003 [DOI] [PubMed] [Google Scholar]
- 35.Wang J, Yang T, Xu G, et al. Cyclin-Dependent Kinase 2 Promotes Tumor Proliferation and Induces Radio Resistance in Glioblastoma. Transl Oncol 2016;9:548-56. 10.1016/j.tranon.2016.08.007 [DOI] [PMC free article] [PubMed] [Google Scholar]
- 36.Faber AC, Chiles TC. Inhibition of cyclin-dependent kinase-2 induces apoptosis in human diffuse large B-cell lymphomas. Cell Cycle 2007;6:2982-9. 10.4161/cc.6.23.4994 [DOI] [PubMed] [Google Scholar]
- 37.Trowbridge JM, Rogatsky I, Garabedian MJ. Regulation of estrogen receptor transcriptional enhancement by the cyclin A/Cdk2 complex. Proc Natl Acad Sci U S A 1997;94:10132-7. 10.1073/pnas.94.19.10132 [DOI] [PMC free article] [PubMed] [Google Scholar]
- 38.Huynh N, Liu KH, Baldwin GS, et al. P21-activated kinase 1 stimulates colon cancer cell growth and migration/invasion via ERK- and AKT-dependent pathways. Biochim Biophys Acta 2010;1803:1106-13. 10.1016/j.bbamcr.2010.05.007 [DOI] [PubMed] [Google Scholar]
- 39.Zhou W, Jubb AM, Lyle K, et al. PAK1 mediates pancreatic cancer cell migration and resistance to MET inhibition. J Pathol 2014;234:502-13. 10.1002/path.4412 [DOI] [PMC free article] [PubMed] [Google Scholar]
- 40.Lu F, Zhang J, Ji M, et al. miR-181b increases drug sensitivity in acute myeloid leukemia via targeting HMGB1 and Mcl-1. Int J Oncol 2014;45:383-92. 10.3892/ijo.2014.2390 [DOI] [PubMed] [Google Scholar]
- 41.Wang G, Zhao R, Zhao X, et al. MicroRNA-181a enhances the chemotherapeutic sensitivity of chronic myeloid leukemia to imatinib. Oncol Lett 2015;10:2835-41. 10.3892/ol.2015.3663 [DOI] [PMC free article] [PubMed] [Google Scholar]
- 42.Zhao L, Li Y, Song X, et al. Upregulation of miR-181c inhibits chemoresistance by targeting ST8SIA4 in chronic myelocytic leukemia. Oncotarget 2016;7:60074-86. 10.18632/oncotarget.11054 [DOI] [PMC free article] [PubMed] [Google Scholar]
- 43.Bisso A, Faleschini M, Zampa F, et al. Oncogenic miR-181a/b affect the DNA damage response in aggressive breast cancer. Cell Cycle 2013;12:1679-87. 10.4161/cc.24757 [DOI] [PMC free article] [PubMed] [Google Scholar]
- 44.Chhabra R. let-7i-5p, miR-181a-2-3p and EGF/PI3K/SOX2 axis coordinate to maintain cancer stem cell population in cervical cancer. Sci Rep 2018;8:7840. 10.1038/s41598-018-26292-w [DOI] [PMC free article] [PubMed] [Google Scholar]
- 45.Lin Z, Li D, Cheng W, et al. MicroRNA-181 Functions as an Antioncogene and Mediates NF-κB Pathway by Targeting RTKN2 in Ovarian Cancers. Reprod Sci 2019;26:1071-81. 10.1177/1933719118805865 [DOI] [PubMed] [Google Scholar]
- 46.Liu XH, Sun M, Nie FQ, et al. Lnc RNA HOTAIR functions as a competing endogenous RNA to regulate HER2 expression by sponging miR-331-3p in gastric cancer. Mol Cancer 2014;13:92. 10.1186/1476-4598-13-92 [DOI] [PMC free article] [PubMed] [Google Scholar]
- 47.Gao FY, Liu QY, Yuan L, et al. Upregulation of microRNA-132 in gastric cancer promotes cell proliferation via retinoblastoma 1 targeting. Mol Med Rep 2015;12:7005-10. 10.3892/mmr.2015.4253 [DOI] [PubMed] [Google Scholar]
- 48.Zhang H, Liu A, Feng X, et al. MiR-132 promotes the proliferation, invasion and migration of human pancreatic carcinoma by inhibition of the tumor suppressor gene PTEN. Prog Biophys Mol Biol 2019;148:65-72. 10.1016/j.pbiomolbio.2017.09.019 [DOI] [PubMed] [Google Scholar]
- 49.Wada R, Akiyama Y, Hashimoto Y, et al. miR-212 is downregulated and suppresses methyl-CpG-binding protein MeCP2 in human gastric cancer. Int J Cancer 2010;127:1106-14. 10.1002/ijc.25126 [DOI] [PubMed] [Google Scholar]
- 50.Jiping Z, Ming F, Lixiang W, et al. MicroRNA-212 inhibits proliferation of gastric cancer by directly repressing retinoblastoma binding protein 2. J Cell Biochem 2013;114:2666-72. 10.1002/jcb.24613 [DOI] [PubMed] [Google Scholar]
- 51.Liu T, Zhang X, Du L, et al. Exosome-transmitted miR-128-3p increase chemosensitivity of oxaliplatin-resistant colorectal cancer. Mol Cancer 2019;18:43. 10.1186/s12943-019-0981-7 [DOI] [PMC free article] [PubMed] [Google Scholar] [Retracted]
- 52.Peng Q, Shen Y, Lin K, et al. Comprehensive and integrative analysis identifies microRNA-106 as a novel non-invasive biomarker for detection of gastric cancer. J Transl Med 2018;16:127. 10.1186/s12967-018-1510-y [DOI] [PMC free article] [PubMed] [Google Scholar]
- 53.Li QL, Ito K, Sakakura C, et al. Causal relationship between the loss of RUNX3 expression and gastric cancer. Cell 2002;109:113-24. 10.1016/S0092-8674(02)00690-6 [DOI] [PubMed] [Google Scholar]
- 54.Hanahan D, Weinberg RA. Hallmarks of cancer: the next generation. Cell 2011;144:646-74. 10.1016/j.cell.2011.02.013 [DOI] [PubMed] [Google Scholar]
- 55.Condeelis J, Pollard JW. Macrophages: obligate partners for tumor cell migration, invasion, and metastasis. Cell 2006;124:263-6. 10.1016/j.cell.2006.01.007 [DOI] [PubMed] [Google Scholar]
- 56.Korkaya H, Liu S, Wicha MS. Regulation of cancer stem cells by cytokine networks: attacking cancer's inflammatory roots. Clin Cancer Res 2011;17:6125-9. 10.1158/1078-0432.CCR-10-2743 [DOI] [PMC free article] [PubMed] [Google Scholar]
Associated Data
This section collects any data citations, data availability statements, or supplementary materials included in this article.
Supplementary Materials
The article’s supplementary files as


