Abstract
Women with polycystic ovary syndrome (PCOS) are reported to have greater lean mass and insulin resistance. To examine muscular changes in a prenatally androgenized (PNA) rat model for PCOS, Sprague–Dawley rats were exposed to 5 mg testosterone or vehicle daily on gestational days 16–19. At 15 weeks of age, endurance on a rota-rod treadmill was measured. At 16 weeks of age, fasting blood glucose and insulin, hindlimb skeletal muscle mass, muscle fiber cross-sectional area (CSA) and composition, and intra- and peri-muscular lipid droplets were examined. Expression of mitochondrial marker ATP synthase and insulin signaling proteins were also investigated. Compared with controls, PNA female rats demonstrated greater total body and hindlimb muscle weights, greater muscle fiber CSA, and trending reduced time on the rota-rod. An increase in fibers co-expressing the slow and fast isoforms of myosin (90 vs. 86%, p < 0.05) and greater expression of ATP synthase (6-fold, p < 0.005) were observed in the gastrocnemius (GN) muscle. More lipid content was observed in GN and tibialis anterior (TA) muscles. PNA rats had elevated fasting serum insulin (1.9 vs. 1.2 ng/mL, p < 0.005) but comparable fasting glucose. Expression of total and Ser636/9-phosphorylated IRS1 were altered in PNA rat hindlimb muscles. Together, skeletal muscle alterations in hindlimb muscles of a PNA rat model for PCOS may represent consequences of, or adaptations to, insulin resistance in this model.
Keywords: hyperandrogenemia, muscle fiber type, muscle cross-sectional area, intra-muscular lipids, peri-muscular lipids, PCOS, insulin signaling, insulin resistance, IRS1
1. Introduction
Polycystic ovary syndrome (PCOS) is the most common endocrinopathy in women, affecting female reproductive, metabolic, and psychological health from puberty to menopause and beyond [1,2,3]. Evidence supports a key role for elevated levels of androgens in the pathogenesis of PCOS [4,5,6,7,8,9,10,11], which can influence the function of various tissues in the body, including skeletal muscle. Androgen levels are associated with muscle size and strength [12,13,14]. Women with PCOS are reported to have increased lean mass [15,16,17], greater muscle strength [18,19], and enhanced muscle strength after progressive resistance training [20], suggesting a relationship between elevated androgen levels and muscle structure or function in these women. Muscle size is reported to positively correlate with serum androgen levels in women with PCOS [18,21,22], although some did not find a relationship between lean mass and androgen levels [15,16]. Some reports indicate that insulin resistance—which is common in women with PCOS [23,24,25,26]—rather than high androgen levels, correlates with increased lean mass in this population [15,16,27]. Studies reporting a positive correlation between insulin resistance and increased lean mass in women with PCOS did not explore the composition of skeletal muscle in participants. Skeletal muscle fiber composition can influence force generated, exercise capacity, and fuel usage. In addition, it may influence whole-body glucose tolerance and serum insulin levels [28,29].
Prenatally androgenized (PNA) rodent models exhibit many of the characteristics associated with PCOS in humans, including disrupted reproductive cycles, hyperandrogenemia, polycystic ovarian morphology, and metabolic dysfunction [11,30,31,32,33]. PNA model androgen exposure during this prenatal period mimics the testosterone surge that is observed in male rats [34] and results in elevated testosterone and androstenedione in adult female rats [33]. Such models are conducive both to biochemical and structural analysis of multiple tissues, as well as pharmacologic and nonpharmacologic manipulation in a controlled environment. Skeletal muscle structure and function has not been fully characterized in these rodent models for PCOS but is hypothesized to mimic the increased mass and insulin resistance reported in women with the disorder. The aim of this study was to test the hypothesis that the skeletal muscle of the PNA rodent model mimics the increased mass and insulin resistance in women with the PCOS. We examined hindlimb muscle mass and cross-sectional area and muscle composition in a prenatally androgenized rat model for PCOS. In addition, we examined fasting blood glucose and serum insulin levels and expression of insulin signaling proteins in hindlimb skeletal muscles.
2. Results
2.1. Body Weight
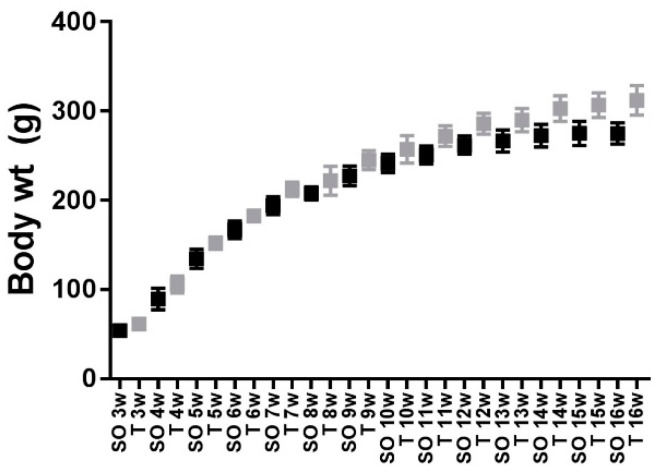
Beginning at 4 weeks and continuing through 16 weeks of age, female rats prenatally exposed to testosterone weighed significantly more than control rats (Figure 1, SO vs. T, p < 0.0001). This difference became more pronounced at 14 through 16 weeks of age.
Figure 1.
Prenatally androgenized female rats weighed more than control rats beginning at 4 weeks of age. Sprague–Dawley rats were prenatally exposed to sesame oil (n = 15) or 5 mg testosterone in sesame oil (n = 9) each day from gestation days 16–19. Rats were weighed weekly from 3 weeks to 16 weeks of age. Beginning at 4 weeks of age, the prenatally androgenized (PNA) rats (gray squares) weighed significantly more than control rats (black squares). Values are means ± SD. One-way ANOVA with Sidak’s multiple comparisons test, p < 0.0001.
2.2. Rota-Rod Time Trials
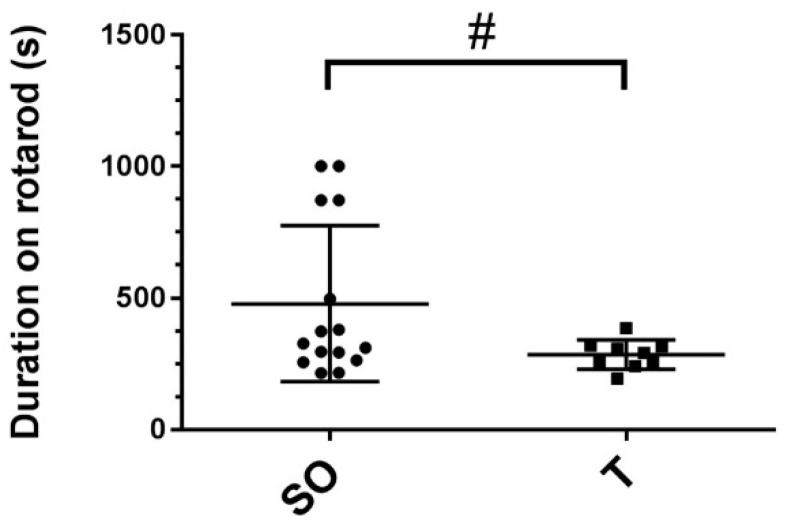
To determine if control and PNA rats exhibited a difference in exercise endurance, rats were placed on an accelerating rota-rod treadmill. The time spent walking on the rota-rod before falling off, up to a maximum of 1000 s, was recorded for each rat for three consecutive days. As shown in Figure 2, compared to control rats, female rats prenatally exposed to testosterone exhibited a trend toward less time on the rota-rod (438 vs. 236 s, p = 0.07). However, whereas all testosterone-exposed rats stayed on the rota-rod treadmill for 195–390 s, some rats in the control group stayed on for a similar amount of time (215–380 s), while others stayed on for over 870 s (Figure 2).
Figure 2.
Rota-rod exercise times trended toward shorter duration in PNA compared with control rats. At 15 weeks of age, female rats that were prenatally exposed to sesame oil (SO, n = 15) or testosterone (T, n = 9) were placed on a rota-rod that gradually accelerated to a maximum speed of 40 rpm. The time spent on the rota-rod before falling off was recorded, with a maximum possible time of 1000 s. Each rat underwent a timed trial once daily for three consecutive days. Data were analyzed using unpaired t-tests and trended toward shorter duration for PNA rats (# p = 0.0684). Values are the means ± SD.
2.3. Hindlimb Muscle Weights
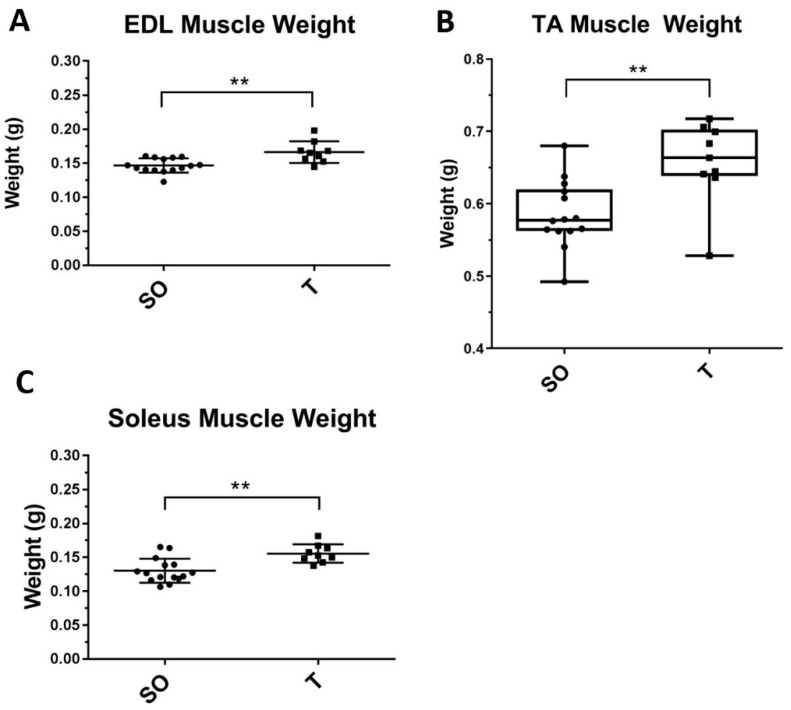
In addition to greater body weight, PNA rats also exhibited greater tibialis anterior (TA), extensor digitorum longus (EDL), and soleus (SOL) muscle weights than control rats at 16 weeks of age (Figure 3, p < 0.005).
Figure 3.
Greater hindlimb skeletal muscle mass in PNA rats compared to control rats. At 16 weeks of age, animals were euthanized and hindlimb muscles were carefully dissected from female rats prenatally exposed to sesame oil (SO, n = 15) or testosterone (T, n = 9) prior to weighing. Data with normal distribution were analyzed by unpaired t-tests (A,B), and those not normally distributed were analyzed by Mann–Whitney U test (C). Values are means ± SD (A,B) or quartiles with the median shown (C). ** p < 0.005.
2.4. Hindlimb Muscle Fiber Cross-Sectional Area
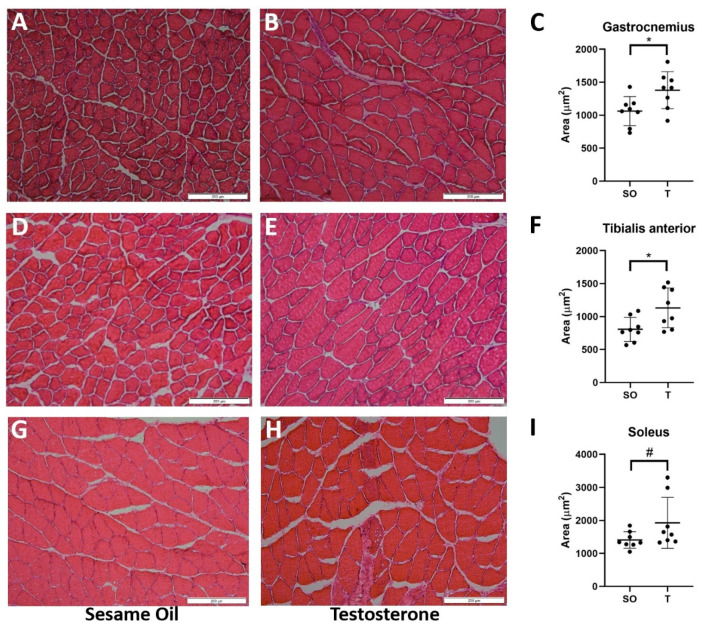
To determine if the greater mass of hindlimb muscles correlated with increased fiber size, we next examined cross-sectional area (CSA) for several hindlimb muscles. As shown in Figure 4, compared with control rats, the testosterone-exposed rats exhibited greater CSA in the GN (1062 vs. 1379 µm2, p = 0.02), TA (807 vs. 1131 µm2, p = 0.02), and SOL (1409 vs. 1927 µm2, p = 0.09) muscles.
Figure 4.
Greater hindlimb skeletal muscle cross-sectional area in PNA rats. At 16 weeks of age, animals were euthanized, and hindlimb muscles were carefully dissected. Gastrocnemius (GN), tibialis anterior (TA), and soleus (SOL) muscles from female rats exposed to sesame oil (n = 8) or testosterone (n = 8) were snap-frozen and cryosectioned at 10 µm thickness prior to fixing in paraformaldehyde and staining with hematoxylin and eosin. For each rat, 3 distinct fields per muscle sample were imaged at 200x magnification; representative images from muscles from rats prenatally exposed to sesame oil (A,D,G) or testosterone (B,E,H) are shown. Fiber cross-sectional area was measured; data were normally distributed and analyzed using unpaired t-tests (C,F,I). Values represent the mean ± SD. * p < 0.05, # p = 0.0924. Scale bars, 200 µm.
2.5. Hindlimb Muscle Fiber Composition
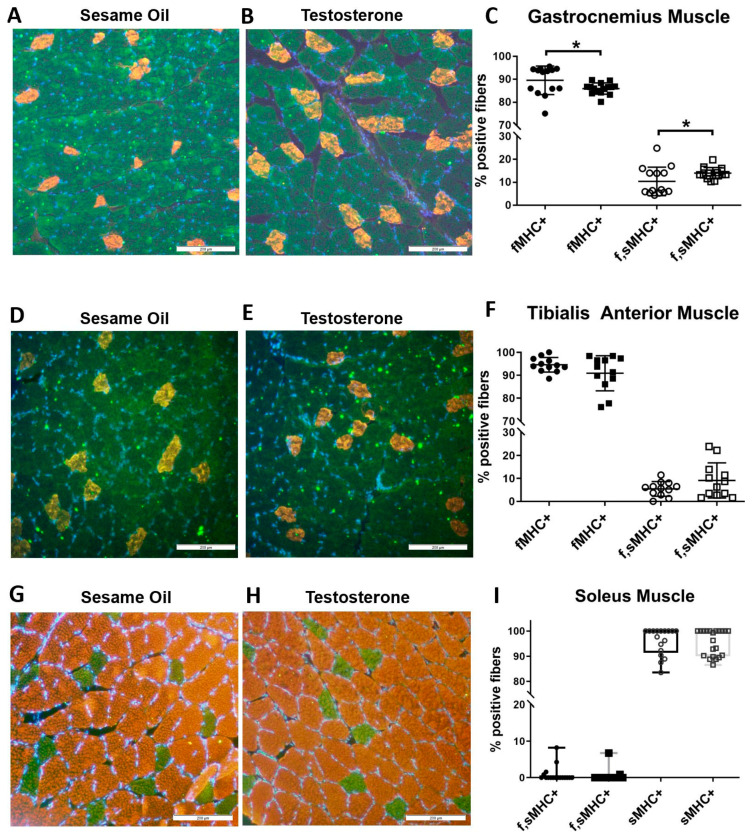
Next, we examined muscle fiber type composition of GN and TA (consisting of a mixture of type I and type II fibers) and SOL (consisting of predominantly type I fibers) muscles by immunolabeling for the fast and slow isoforms of myosin heavy chain (fMHC and sMHC, respectively). PNA rats exhibited significantly more fibers expressing both isoforms (f,sMHC+, 10% vs. 14%) and fewer expressing only the fast isoform (fMHC+, 90% vs. 86%) in the GN muscle (Figure 5A–C, p < 0.05). Type I fibers (sMHC+) in this muscle represented less than 1% of all fibers.
Figure 5.
More skeletal muscle fibers in PNA rat gastrocnemius muscle are positive for both the fast and slow isoforms of myosin heavy chain. Gastrocnemius (A–C), tibialis anterior (D–F), and soleus (G–I) skeletal muscles from 16-week-old female rats exposed to sesame oil (n = 4–5) or testosterone (n = 4–5) were cryosectioned at 20 µm thickness prior to indirect immunolabeling for the fast (green) and slow (red) isoforms of myosin heavy chain. Blue indicates DAPI-stained nuclei. For each rat, 3 distinct fields per muscle sample were imaged at 200× magnification and used to determine the percent of fibers that expressed the slow myosin heavy chain isoform (sMHC+, red), fibers that expressed the fast myosin heavy chain isoform (fMHC+, green), or fibers that expressed both fast and slow isoforms (f,sMHC+, green, and red). Scale bars, 200 µm. Data were analyzed using unpaired t tests (GN and TA) or Mann–Whitney U tests (SOL). (A–C) In gastrocnemius muscles, the predominant fiber type was fMHC+. Compared to the controls (closed and open circles), PNA rats (closed and open squares) had a small but significant increase in fibers expressing both the fast and slow isoforms of MHC (f,sMHC+), with a concomitant decrease in fibers expressing only fMHC. TA muscles had a similar fiber composition as the GN muscles, but no significant difference in fiber composition between control and PNA rats. No significance or trend was observed for soleus muscles (G–I; SO, black boxes and T, gray boxes), which consisted primarily of sMHC+ fibers. Values are means ± standard deviation (C,F) or quartiles with the median shown (I). * p < 0.05.
There was no significant change in fiber composition of TA muscles, although some PNA rats did exhibit more fibers expressing both isoforms and fewer expressing only the fast isoform (Figure 5D–F; p = 0.14). No significant difference was seen in the SOL muscles, which are predominantly composed of type I fibers (Figure 5G–I).
2.6. Mitochondrial Marker ATP Synthase Expression in Hindlimb Muscle
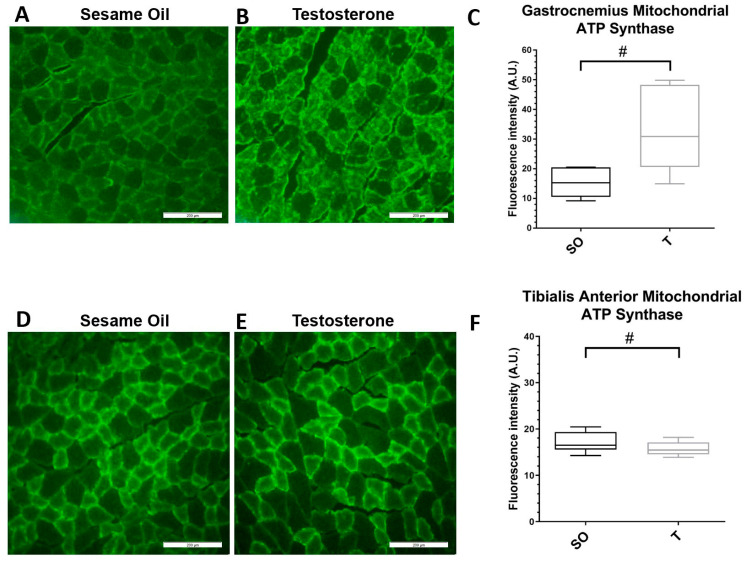
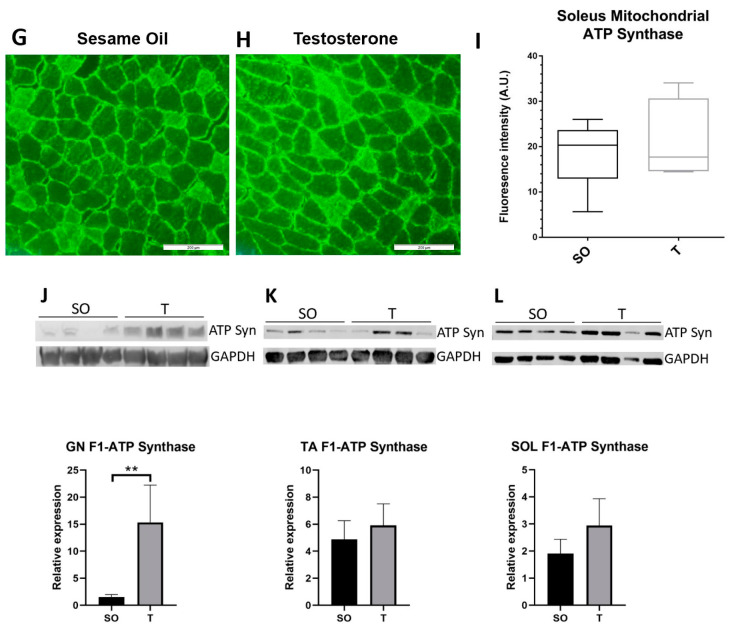
We next examined the expression of ATP synthase, a mitochondrial protein, in GN, TA, and SOL muscles. There was a trend towards greater ATP synthase immunofluorescence in the GN muscle (Figure 6A–C, p = 0.06) and a slight decrease in TA muscle (Figure 6D–F, p = 0.09). There was no difference in fluorescence intensity in the SOL muscles between the control and PNA rats (Figure 6G–I). Further examination of ATP synthase protein expression by Western blot revealed an approximately 6-fold increase in ATP synthase expression in GN muscles from PNA rats (Figure 6J, p = 0.004). However, there was no significant increase in ATP synthase protein expression in either TA or SOL muscle by Western blot analysis (Figure 6K,L).
Figure 6.
Expression of the mitochondrial marker ATP synthase is higher in gastrocnemius muscle in PNA rats. Gastrocnemius (A–C), tibialis anterior (D–F), and soleus (G–I) skeletal muscles from 16-week-old female rats exposed to sesame oil (n = 4–5) or testosterone (n = 4–5) were cryosectioned at 20 µm thickness prior to indirect immunolabeling for ATP synthase. Scale bars, 200 µm. For each rat, 3 distinct fields per muscle sample were imaged and the fluorescence intensity quantified (C,F,I). Fluorescence intensity data were analyzed using a Mann–Whitney U test. Fluorescence intensity trended higher in muscles from PNA rats for gastrocnemius (# p = 0.0556), trended slightly lower in TA (# p = 0.0979), but was not significantly different in soleus muscle. Quartiles with the median are shown. (J–L) Protein expression was examined by Western blot and quantified by densitometric analysis. Samples of (J) GN, (K) TA, and (L) SOL muscles from rats exposed to sesame oil (n = 8) or testosterone (n = 8) were separated by SDS-PAGE and transferred to nitrocellulose prior to detection with antibodies to the alpha subunit of ATP synthase or GAPDH (top panels). Values for ATP synthase were normalized to GAPDH and analyzed using an unpaired t test or Mann–Whitney U test, which indicated significantly greater expression of ATP synthase in GN, but not TA or SOL, from PNA rats (bottom panels). Values shown are means with SD. ** p < 0.005.
2.7. Lipid Content in Hindlimb Muscle
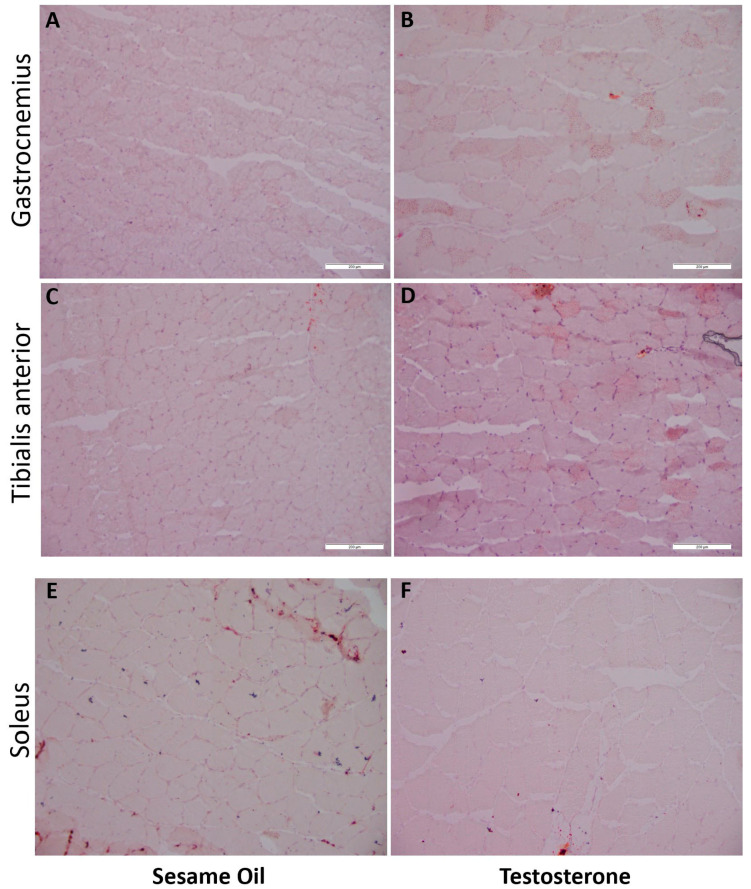
In order to examine intra-muscular and peri-muscular lipid content, which is associated with insulin resistance [35], we used Oil Red O (ORO) to stain lipid content in muscle sections from GN, TA, and SOL muscles. Compared with controls, there was more intra-muscular and peri-muscular ORO staining in PNA rat GN and TA muscles (Figure 7). No differences were appreciated in SOL muscle.
Figure 7.
More Oil Red O staining of lipids in gastrocnemius and tibialis anterior muscles from PNA rats. Gastrocnemius, tibialis anterior, and soleus muscles from 16-week-old rats prenatally exposed to sesame oil (n = 8) or testosterone (n = 8) were snap-frozen and cryosectioned at 10 µm thickness prior to fixing in paraformaldehyde and staining for lipids with Oil Red O (ORO). Scale bars, 200 µm. For each rat, 2–4 distinct fields per muscle sample were imaged at 200× magnification; representative images from muscles from rats prenatally exposed to sesame oil (A,C,E) or testosterone (B,D,F) are shown. More prominent intra-muscular and peri-muscular staining with ORO was noted in the GN and TA muscles from PNA rats. No difference was appreciated between control and PNA rats in soleus muscles.
2.8. Fasting Blood Glucose and Serum Insulin
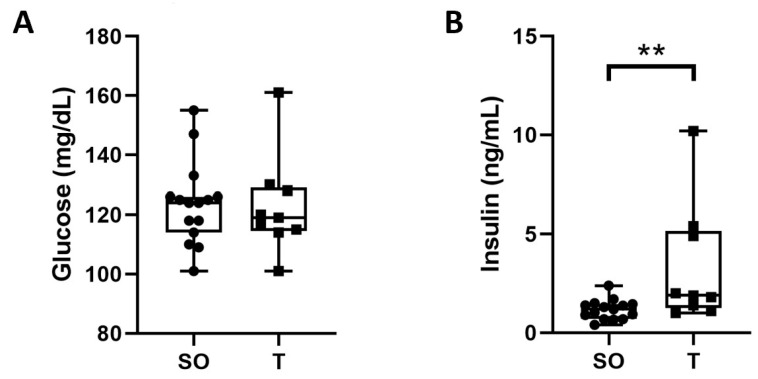
We next sought to determine if there might be changes in fasting blood glucose and serum insulin in the PNA rats compared to the control rats, in addition to the observed differences in muscle CSA, fiber type, and intra- and peri-muscular lipid content. Fasting blood glucose levels were not significantly different between the control and PNA rats at 16 weeks of age (Figure 8A). However, fasting serum insulin was significantly higher in PNA rats (Figure 8B, 1.2 vs. 1.9 ng/mL, p = 0.008).
Figure 8.
Elevated fasting serum insulin in adult PNA rats. Tail vein blood samples were taken from control (n = 15) and PNA (n = 9) rats at 16 weeks of age following an overnight fast. (A) A drop of blood was used to determine blood glucose using a standard glucometer. (B) Serum insulin concentrations were measured by ELISA. While fasting blood glucose levels were comparable, fasting serum insulin was significantly higher in the PNA rats. Data were analyzed by Mann–Whitney U tests and are shown as quartiles with the median. ** p < 0.005.
2.9. Expression of Insulin Signaling Proteins in Hindlimb Muscle
Skeletal muscle plays a major role in insulin-mediated glucose uptake. Given the higher levels of fasting serum insulin in adult rats, we next examined the expression of insulin signaling pathway proteins in the GN, TA, and SOL muscles.
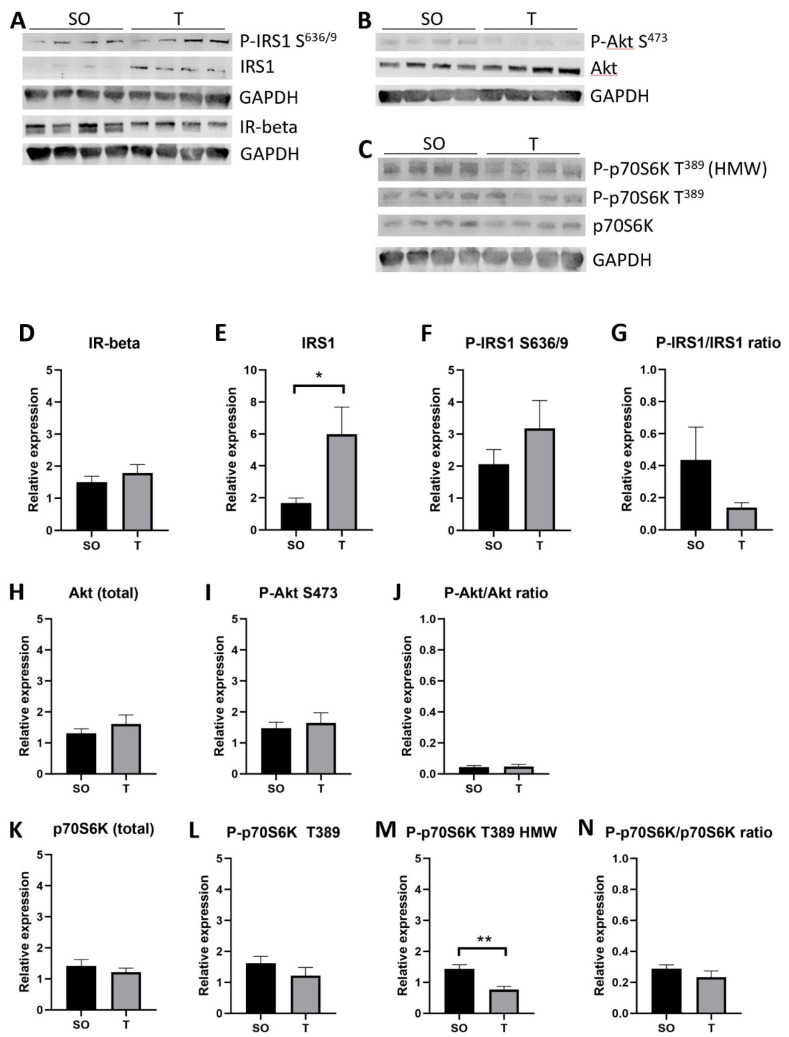
In GN (Figure 9), there was an approximately 3.6-fold increase in the expression of IRS1 in PNA rats (p = 0.03), and the ratio of P-IRS1 S636/9 to IRS1 appeared to decrease by nearly half (p = 0.16). In addition, the expression of a high molecular weight (HMW) Thr389 phosphorylated p70S6K was nearly 50% lower in PNA rats (p = 0.002), although the total p70S6K and ratio of P-p70S6K T389 to p70S6K did not change. No significant changes were detected in IR-beta, P-IRS1 S636/9, P-Akt S473, Akt, or the ratio of P-Akt S473 to Akt in GN muscle.
Figure 9.
Greater IRS1 protein expression in PNA gastrocnemius muscle. Gastrocnemius muscles from 16-week-old rats were homogenized on ice in buffer containing protease and phosphatase inhibitors. (A–C) Homogenates (30 µg) were separated by SDS-PAGE prior to transfer to nitrocellulose for immunoblot analysis of proteins. (D–N) Band intensity was quantified using ImageStudio Lite software (Version 5.2), and data were analyzed using unpaired t tests. Expression of total IRS1 protein was greater in GN from PNA rats (A,E). There appeared to be a decrease in the ratio of Ser636/9 phosphorylated IRS1 to total IRS1 (G), though this was not statistically significant. GN from PNA rats expressed less T389 phosphorylated p70S6K protein (C,M). Means with SD are shown. * p < 0.05, ** p < 0.005.
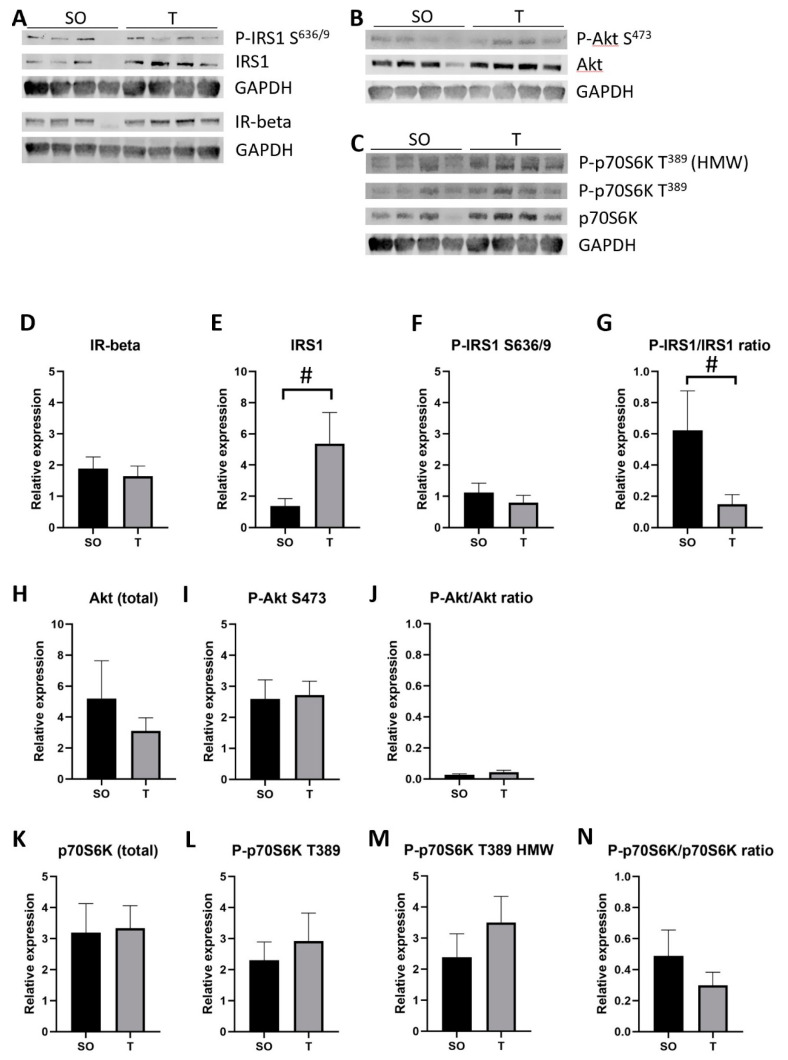
In TA (Figure 10), there was a trend toward a 3.9-fold increase in IRS1 in PNA rats (p = 0.09), with a trend toward a 75% reduction in the ratio of P-IRS1 S636/9 to IRS1 (p = 0.08). No significant difference was detected in IR-beta, P-IRS1 S636/9, P-Akt S473, Akt, the ratio of P-Akt S473 to Akt, P-p70S6K T389, total p70S6K, or the ratio of P-p70S6K T389 to p70S6K.
Figure 10.
Greater IRS1 protein expression and lower Ser636/9 phosphorylated IRS1 to IRS1 ratio in PNA tibialis anterior muscle. Tibialis anterior muscles from 16-week-old rats were homogenized on ice in buffer containing protease and phosphatase inhibitors. (A–C) Homogenates (30 µg) were separated by SDS-PAGE prior to transfer to nitrocellulose for immunoblot analysis of proteins. (D–N) Band intensity was quantified using ImageStudio Lite software (Version 5.2), and data were analyzed using unpaired t tests. Expression of total IRS1 protein trended higher in TA from PNA rats (A,E; # p = 0.0911); Ser636/9 phosphorylated IRS1 expression was comparable, resulting in a trend toward decreased P-IRS1 to total IRS1 ratio in TA from PNA rats (G; # p = 0.0754). Means with SD are shown.
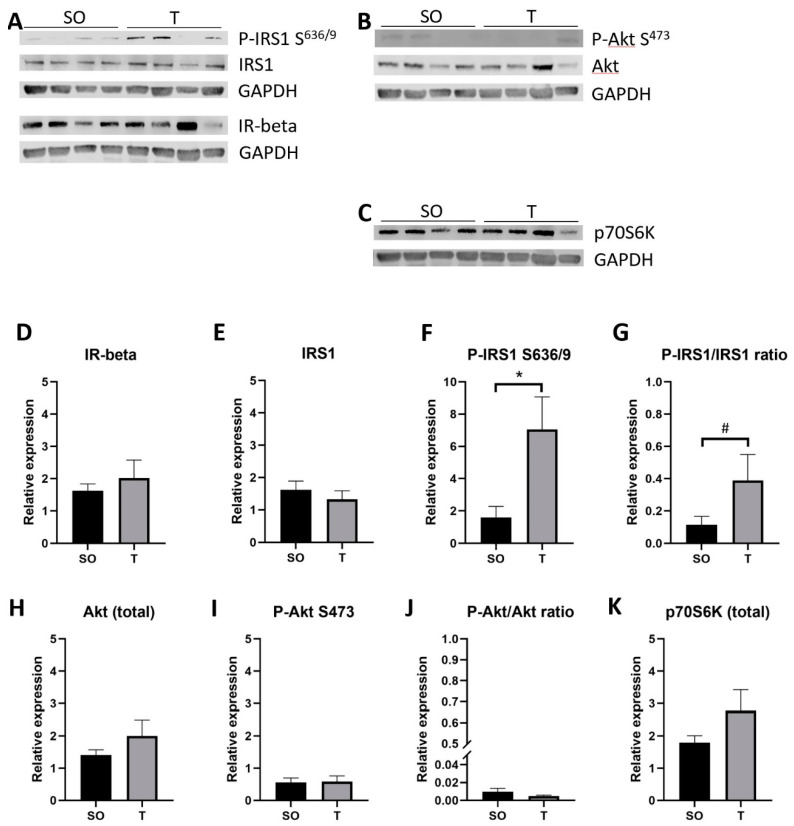
In SOL (Figure 11), there was a 4.4-fold increase in P-IRS1 S636/9 (p = 0.02) and a trend toward a 3.9-fold higher P-IRS1 S636/9 to IRS1 ratio (p = 0.10) in PNA rats. No significant difference was detected in IR-beta, IRS1, P-Akt S473, Akt, the ratio of P-Akt S473 to Akt, or total p70S6K. P-p70S6K T389 was unable to be detected in SOL samples.
Figure 11.
Greater Ser636/9 phosphorylated IRS1 expression in PNA soleus muscle. Soleus muscles from 16-week-old rats were homogenized on ice in buffer containing protease and phosphatase inhibitors. (A–C) Homogenates (30 µg) were separated by SDS-PAGE prior to transfer to nitrocellulose for immunoblot analysis of proteins. (D–K) Band intensity was quantified using ImageStudio Lite software (Version 5.2), and data were analyzed using unpaired t tests. Expression of Ser636/9 phosphorylated IRS1 protein was greater in soleus from PNA rats (A,E); IRS1 expression was comparable, resulting in a trend toward increased P-IRS1 to total IRS1 ratio in soleus from PNA rats (G; # p = 0.10). Means with SD are shown. * p < 0.05.
3. Discussion
Prenatally androgenized rodent models have demonstrated the reproductive and metabolic features associated with PCOS [11,30,31,32,33]. To our knowledge, this is the first study to demonstrate altered hindlimb skeletal muscle fiber cross-sectional area and composition, in conjunction with changes in insulin signaling pathway protein expression, in a PNA rat model for PCOS. These findings lend further support to the use of this model to study PCOS and suggest that exposure to excess androgens in females may alter skeletal muscle structure and function. As skeletal muscle accounts for a large proportion of body mass and metabolic activity, changes in muscle structure and function may influence fuel handling and contribute to altered metabolic function.
3.1. Body Composition, Muscle Structure, and Function in PCOS
Androgens are well-known to increase muscle mass and strength [12,13,14]. Women with PCOS demonstrate hyperandrogenemia [36,37,38], which may influence muscle structure and function in this population. Analyses of body composition in women with PCOS compared to those without have suggested increased lean mass [15,16,17] and greater leg muscle mass in women with PCOS [39]. Some have reported that the increased muscle mass correlates with androgen levels [21,39], while others did not find androgens to be a major correlate of increased lean mass [15,16]. Regarding muscle strength, while some did not find a significant difference [40], others have reported that women with PCOS have increased baseline muscle strength in multiple muscle groups compared to women without the disorder, irrespective of body composition [18]. Furthermore, a 4-month progressive resistance training regimen resulted in a greater increase in maximum strength in women with PCOS compared to controls, despite similar improvements in body composition (decreased body fat and increased lean body mass) and reductions in androgen levels in both groups [20].
In our PNA rat model for PCOS, female rats prenatally exposed to testosterone demonstrated significantly higher levels of testosterone and androstenedione at 16 weeks of age compared to controls [33]. Elevated levels of androgens may have resulted in greater hindlimb muscle mass and fiber cross-sectional area in our animals, suggestive of muscle hypertrophy. We found that PNA female rats exhibited greater overall body weight that became more pronounced as the animals aged, although we did not analyze body composition. Therefore, the increased body weight may reflect increased muscle mass as well as increased mass of adipose depots or other organs. Future directions should include examining skeletal muscle force transduction and fatigability in this PNA rat model for PCOS, in addition to body composition analysis such as by DEXA scan.
3.2. Exercise in Humans with, and Animal Models for, PCOS
We examined exercise duration on a rota-rod treadmill and found that while some control rats stayed on the treadmill for a shorter (<400 s) and others longer (>800 s) period of time, PNA rats were only on the treadmill for a shorter duration (<400 s). This difference may indicate a reduced capacity for exercise in these animals or reduced motivation for staying on the treadmill. In a study using mice, PNA mice given free access to a running wheel were found to have reduced voluntary exercise activity compared to controls. Interestingly, this effect was eliminated by ovariectomy, suggesting that reduced voluntary exercise in this model may be partly mediated by ovarian hormones [41]. In humans, adolescent females with PCOS were found to engage less in physical activities than those without PCOS, and to exhibit less frequency and intensity when they do participate [42]. Together, data from human studies and animal models suggest that androgen excess in females may reduce voluntary exercise, suggesting that there may be some biological differences that influence exercise and which could explain our finding that all PNA rats spent less time on the rota-rod treadmill.
With respect to exercise capacity, cross-sectional studies of overweight and obese women found that women with PCOS had similar VO2max compared with age- and BMI-matched controls [40,43]. However, a study of young (21 ± 2 years) women with PCOS found significant reductions in VO2max, oxygen consumption at aerobic threshold, and maximal workload compared to age- and BMI-matched controls, suggesting that some women with PCOS may have reduced exercise capacity [44]. Although we did not measure physiologic parameters of exercise capacity in the present study, the slight shift toward faster oxidative glycolytic (f,sMHC+) fibers and increased mitochondrial ATP synthase suggests that decreased exercise capacity in the PNA rats is unlikely.
3.3. Muscle Fiber Composition and Metabolic Disorders
In a study with human subjects with metabolic syndrome, a shift in muscle composition was found in muscle biopsies taken from the vastus lateralis, including greater percentage of type IIa fast oxidative glycolytic muscle fibers and increased expression of ATP synthase in those fibers. In addition, there was a reduced percentage of type I slow oxidative fibers that correlated with greater insulin resistance [29]. Similarly, previous studies have shown that individuals with type 2 diabetes have a reduced percentage of type I fibers [45,46]. These findings are consistent with our own data that indicate a small but significant shift towards faster oxidative glycolytic (f,sMHC+) fibers and increased ATP synthase expression in the gastrocnemius muscle in PNA rats. These changes in hindlimb muscles may represent an adaptive phenotypic shift towards greater oxidative potential. The reported relationship between reduced type I fibers and insulin resistance suggest that, despite a possible compensatory mechanism to upregulate oxidation in type IIa fibers in the PNA rat, this shift may not be sufficient to prevent the development of metabolic dysfunction that has been reported in this model [32]. The mechanisms involved in and the physiological significance of this fiber-type shift warrants further investigation. Given the prevalence of insulin resistance and metabolic dysfunction in women with PCOS [47], future studies should determine if women with PCOS exhibit a similar alteration in muscle fiber composition.
In addition to a slight but significant shift in muscle fiber composition of some hindlimb skeletal muscles toward a fast oxidative glycolytic phenotype, we also observed increased presence of lipid content in these muscles. Peri-muscular adipose increases with aging and obesity [48], and expansion of peri-muscular and intermuscular adipose correlates with skeletal muscle macrophage and T cell infiltration and insulin resistance in human subjects with obesity and in mice fed a high-fat diet [49]. In healthy, early postmenopausal women, thigh intermuscular adipose inversely correlated with insulin sensitivity index (ISI), whereas thigh subcutaneous adipose tissue positively correlated with ISI, independent of visceral adipose tissue [50]. In patients with obesity or type 2 diabetes, intra- and intermuscular adipose strongly correlated with insulin resistance, despite accounting for a relatively small percentage of the adipose mass in the thigh [51] or paraspinal muscles [52]. In addition, individuals with higher levels of insulin resistance demonstrated altered postprandial skeletal muscle handling and greater levels of intramuscular free fatty acids [53]. In women with PCOS, peri-muscular adipose tissue in the thigh directly correlated with HOMA-IR and inversely correlated with whole body ISI [35]. Skeletal muscle insulin resistance may develop in part due to increased lipid peroxidation and the by-products thereof [54,55,56,57]. Together, these data point to a role for lipids in the skeletal muscle in insulin sensitivity and resistance and likely reflect altered fuel handling when lipids accumulate in the muscle.
3.4. Hyperinsulinemia and Insulin Resistance in PCOS
In our study, the increase in lipids in the mixed composition gastrocnemius and tibialis anterior muscles, coupled with higher fasting insulin levels and diminished phosphorylation of total IRS1 and p70S6K, appear to reflect increased skeletal muscle insulin resistance. Hyperinsulinemia and insulin resistance are common in adolescent and adult women with PCOS [23,24,25,26]. These findings have been reproduced in animal models for the disorder, both in PNA models and models using postnatal induction of a PCOS phenotype [11,30,58,59,60,61]. The model used in this study has previously been reported to exhibit metabolic dysfunction at 8.5 weeks of age, including greater parametrial and subcutaneous adipose as a percentage of body weight, elevated serum triglycerides and cholesterol, and elevated fasting serum insulin with no significant difference in responses to a glucose tolerance test (GTT) [32]. In the present study, we focused on the skeletal muscle changes in this model and confirmed fasting hyperinsulinemia at 16 weeks of age prior to investigating expression of insulin signaling proteins in this fasting, hyperinsulinemic state. Hyperinsulinemia is reported to precede insulin resistance and weight gain in at least one animal model for PCOS [62] but may also result from tissue insulin resistance and compensation to maintain glucose homeostasis [63,64]. Elevated androgens in females may promote insulin resistance, highlighting the reciprocal relationship between insulin and androgens [36,63,65,66,67,68,69]. Insulin resistance might not be conserved in cells derived from women with PCOS [70] and may be adaptive and dependent upon the hormone milieu of the cells and tissues [71].
There are tissue-specific differences in PCOS-related insulin resistance, with skeletal muscle and myotubes derived from women with PCOS demonstrating insulin resistance and decreased insulin responsiveness, as well as adipocytes with impaired insulin sensitivity but normal responsiveness [72,73]. Both acquired and intrinsic defects in skeletal muscle from women with PCOS are reported to contribute to insulin resistance in this tissue [71,74,75]. Impaired phosphorylation of Akt and AS160 in response to insulin [76] and impaired activation and dephosphorylation of glycogen synthase [77] have been reported in skeletal muscle from women with PCOS, underscoring the impact on the metabolic arms of the insulin signaling pathway. Activity of the ERK1/2 component of the mitogenic arm of the insulin signaling pathway in skeletal muscle is reported to be upregulated in women with PCOS, resulting in phosphorylation predominantly at Ser312, which may then result in reduced activation of the metabolic portions of the pathway and insulin resistance [78]. In our study, we examined the expression of total and Ser636/9-phosphorylated IRS1 and found an apparent decrease in the ratio of the phosphorylated form relative to total IRS1 in gastrocnemius and tibialis anterior muscles; together with increased lipid content, these findings are consistent with insulin resistance in these muscles. Phosphorylation at this site is reported to play a role in activation of the mTOR pathway and upregulating protein synthesis [79]. In the soleus muscle, phosphorylation of IRS1 at Ser636/9 was increased, which may reflect insulin sensitivity and greater activation of the pathway in the presence of elevated fasting insulin levels. We also examined total and Thr389-phosphorylated p70S6K and found a decrease in the level of phosphorylated p70S6K. Phosphorylation at this site is reported to best correlate with activity of the kinase, which phosphorylates the S6 protein of the 40S ribosome and is required for cell growth and G1 phase progression [80,81].
3.5. Summary and Future Perspectives
Together, our findings suggest that this PNA model for PCOS results in hyperinsulinemia and skeletal muscle insulin resistance that is due in part to reduced Ser636/9 IRS1 and T389 p70S6K phosphorylation in some of the mixed composition hindlimb muscles. This may result in a phenotypic shift toward more fast oxidative fibers and, in conjunction with greater muscle lipid content, suggests altered fuel usage. Future perspectives include examination of muscle force transduction and fatigability in this model, and further examining the mechanisms underlying the fiber shift and fuel usage under different physiological and pathophysiological conditions, in order to gain a more comprehensive understanding of the changes in skeletal muscle of PNA rats. Studies on other markers of metabolic dysfunction are also warranted to gain further insights into the pathophysiologic mechanisms in this rodent model for PCOS. In addition, the effects of interventions aimed at improving insulin sensitivity in women with PCOS (e.g., regular aerobic exercise and insulin-sensitizing drugs) on skeletal muscle structure and function are warranted. Such studies would provide mechanistic insight into the effectiveness of these therapies and may guide the development of additional therapeutic options.
4. Materials and Methods
4.1. Materials
All chemicals and reagents were purchased from Sigma Aldrich (St. Louis, MO, USA) unless otherwise noted.
4.2. Animals
All procedures involving rats were approved by the Lake Erie College of Osteopathic Medicine Institutional Animal Care and Use Committee (#17-05, 1 September 2017). Sprague–Dawley rats used for breeding were purchased from Hilltop Lab Animals, Inc. (Scottdale, PA, USA). All rats were given ad libitum access to tap water and standard rat chow (Hilltop Lab Animals, Inc.). Rats were housed in a temperature-controlled animal facility (23–25 °C) with a 12 h light/dark cycle.
4.3. Prenatal Androgenization of Rats
Each breeding pair was housed together in a mating cage until the presence of a vaginal plug confirmed pregnancy (gestational day 1, GD1). The male and female breeders were then housed separately. On the mornings of gestational days 16–19, the pregnant dams were subcutaneously injected with 5 mg testosterone dissolved in 500 µL of a 4:1 sesame oil-benzyl benzoate mixture (T rats) or 500 µL of the vehicle alone (SO rats) [31,32,33]. Pups were weaned and separated by sex at 3 weeks of age and then housed 2–3 rats per cage.
4.4. Weekly Body Weight Measurements
Beginning at 3 weeks of age and continuing through 16 weeks of age, female rats were weighed. The weights were recorded on the same day each week (e.g., 3 weeks and 0 days of age).
4.5. Rota-Rod Treadmill Test
At 15 weeks of age, rats were introduced to the rota-rod treadmill (Med Associates Inc., St. Albans, VT, USA) and allowed to walk on the wheel, which gradually accelerated from 4.0 rpm to a maximum speed of 40 rpm, for 300 s. The next 3 consecutive days were timed trials. The rota-rod stopped when the rat fell off the wheel and broke the photo beam at which point the time spent on the apparatus was recorded, or after 1000 s (~16.5 min, the maximum time allowed on the rota-rod). Durations of less than 60 s were counted as failed trials; for failed trials, rats were given a maximum of 3 trial attempts each day. Timed trials were recorded for each rat for 3 consecutive days and averaged for each rat.
4.6. Blood Collection and Fasting Blood Glucose
At 16 weeks of age, rats were fasted for 10 h overnight. In the morning, rats were anesthetized with an intraperitoneal injection of 80 mg/kg thiobutabarbital in normal saline. A tail vein blood sample was collected using a 25G butterfly needle and syringe. A drop of blood was used to determine blood glucose levels using a standard glucometer (OneTouch Ultra2; LifeScan, Inc., Wayne, PA, USA). Blood samples coagulated for 10–20 min on ice then were separated by centrifugation at 3000 rpm for 10 min. The serum was then transferred to a clean microfuge tube and stored at −80 °C until thawed on ice for ELISA analysis.
4.7. Insulin ELISA
Serum samples from 16-week-old rats (15 SO rats and 9 T rats) were used for analysis of serum insulin by ELISA (Cayman Chemicals, Ann Arbor, MI, USA; cat. 589501). Undiluted samples were analyzed in duplicate within a single assay. The manufacturer’s protocol was used to conduct the analysis and analyze the data. The intra-assay coefficient of variation was less than 10%.
4.8. Tissue Collection
At 16 weeks of age, following the tail vein blood draw under anesthesia, rats were euthanized by cervical dislocation. The tibialis anterior (TA), extensor digitorum longus (EDL), soleus (SOL), and gastrocnemius (GN) muscles were dissected from each animal. Whole muscles were weighed, snap-frozen in liquid nitrogen, then stored at −80 °C.
4.9. Histological Examination of Skeletal Muscles
Frozen skeletal muscle samples from both groups were serially cryosectioned in cross-section at 10 µm thickness, mounted on a glass slide, then fixed in 4% paraformaldehyde in phosphate-buffered saline (PBS). Sections were stained with hematoxylin and eosin prior to mounting a glass coverslip. Tissue sections were observed and imaged using a light microscope at 200× (Olympus CKX41, Olympus, Center Valley, PA, USA) by an investigator blinded to the treatment group.
4.10. Measurement of Skeletal Muscle Fiber Cross-Sectional Area
ImageJ software (Version 1.52a; NIH, Bethesda, MD, USA) was used to determine average muscle fiber cross-sectional area from 3 representative fields of tissue for each animal. Tissues from eight animals per group were used for measurement by an investigator blinded to the treatment group.
4.11. Immunolabeling and Microscopy
Skeletal muscle samples from both groups were cryosectioned, immunolabelled, and imaged at the same time and using the same conditions and microscope settings. Samples of frozen muscles were cryosectioned in 20 µm slices and mounted on a glass slide. Tissue sections were fixed in 4% paraformaldehyde in PBS, blocked in 3% bovine serum albumin (BSA) with 0.1% Tween-20 in PBS for 1 h at room temperature, then incubated with primary antibodies in 3% BSA in PBS overnight at 4 °C. Primary antibodies used at a 5 µg/mL dilution were: mouse anti-ATP synthase alpha (ThermoFisher, cat. no. 459240 [82]), mouse anti-slow skeletal myosin heavy chain (Abcam, cat. no. ab11083 [83]), and rabbit anti-fast skeletal myosin heavy chain (Abcam, cat. no. ab228727). Tissue sections subsequently washed and incubated with fluorophore-conjugated secondary antibodies in 3% BSA in PBS for 45 min in the dark at room temperature. Secondary antibodies used at a 1:200 dilution were: DyLight 488 goat anti-rabbit [84] or horse anti-mouse [85] and DyLight 549 horse anti-mouse [86] or goat anti-rabbit [87] (Vector Laboratories, Burlingame, CA, USA). Mounting media containing DAPI (Southern Biotech, Birmingham, AL, USA) was used to mount coverslips prior to imaging at 200x (Olympus CKX41). Two representative fields from each slide were imaged and quantified by an investigator blinded to treatment group. Immunofluorescence was quantified from an 8-bit image using ImageJ software (Version 1.52a).
4.12. Skeletal Muscle Fiber Typing
Muscle sections were immunolabeled with antibodies to the fast and slow isoforms of myosin heavy chain indicated above. Muscle fibers in 3 distinct fields for each muscle were imaged and categorized as positive for fast myosin heavy chain (fMHC+), slow myosin heavy chain (sMHC+), or both (f,sMHC+) by an investigator blinded to the treatment group.
4.13. Oil Red O Staining of Lipids
Skeletal muscle samples from both groups were serially cryosectioned in cross-section at 10 µm thickness, mounted on a glass slide, then fixed in 4% paraformaldehyde in phosphate-buffered saline (PBS). Sections were washed 3 times in deionized water after 30 min in paraformaldehyde, then incubated as follows: 60% isopropanol for 5 min, Oil Red O solution for 20 min, washed 5 times in deionized water, hematoxylin for 1 min, washed 5 times again in deionized water, then a coverslip mounted with aqueous mounting medium. Tissue sections were observed and imaged using a light microscope at 200× (Olympus CKX41) by an investigator blinded to the treatment group.
4.14. Western Blot Analysis
Samples of muscle tissue were homogenized in ice-cold buffer (10 mM Tris pH 7.4, 150 mM NaCl, 5 mM EDTA, 1% Triton X-100, 1% Sodium Deoxycholate, 0.1% SDS, with HaltTM protease and phosphatase inhibitor (ThermoFisher, Waltham, MA, USA)), and a 21G needle was used to shear genomic DNA prior to centrifugation at 13,000 rpm for 10 min. Total protein concentration determined by BCA assay (ThermoFisher). Tissue homogenates (30 µg) were separated by SDS-PAGE and proteins transferred to nitrocellulose prior to blocking with 4% bovine serum albumin (BSA) in Tris-buffered saline (TBS). Blots were incubated with primary antibodies in 4% BSA in TBS with 0.1% Tween-20 overnight at 4 °C. Primary antibodies used were: mouse anti-ATP synthase alpha (ThermoFisher, cat. no. 459240 [82], 2 µg/mL) and mouse anti-GAPDH (ABclonal, cat. no. AC002 [88], 1:5000); and from Cell Signaling Technology, rabbit anti-phospho-IRS1 S636/9 (cat. no. 2388 [89], 1:500), rabbit anti-IRS1 (cat. no. 2382 [90], 1:1000), rabbit anti-IR-beta (cat. no. 3025 [91], 1:1000), rabbit anti-phospho-Akt S473 (cat. no. 9271 [92], 1:500), rabbit anti-Akt (cat. no. 9272 [93], 1:1000), rabbit anti-phospho-p70S6K T389 (cat. no. 9205 [94], 1:1000), and rabbit anti-p70S6K (cat. no. 9202 [95], 1:1000). IRDye® secondary antibodies, anti-mouse-680RD [96], and anti-rabbit-800CW [97], were diluted 1:20,000 in Intercept TBS buffer with 0.2% Tween-20 (LI-COR, Lincoln, NE, USA). Blots were imaged with a LI-COR Odyssey Fc imager (LI-COR, Lincoln, NE, USA), then quantified and analyzed using Image Studio Lite software (Version 5.2; LI-COR, Lincoln, NE, USA).
4.15. Statistical Analysis
GraphPad Prism 7 software (Version 7; San Diego, CA, USA) was used for statistical analysis. All data were tested for normality (D’Agostino Pearson test for normality) prior to statistical analysis with the appropriate parametric or non-parametric test. One-way ANOVA with Sidak’s multiple comparisons test was used to analyze body weight. Unpaired 2-tailed t-tests were used to analyze rota-rod time trials, weights of EDL and soleus muscles, muscle fiber cross-sectional area, muscle fiber composition for the gastrocnemius and TA muscles, and Western blot densitometry. Mann–Whitney U tests were used to analyze weights of TA muscles, muscle fiber composition for the soleus, ATP synthase immunofluorescence intensity, fasting glucose and insulin, and Western blot densitometry for F1-ATP synthase (gastrocnemius and soleus muscles) and IRS1 (soleus muscle). Values reported are the means with standard deviation (for data analyzed with a parametric test) or medians with quartiles (for data analyzed with a non-parametric test). p < 0.05 was considered significant. p values between 0.05 and 0.10 were considered trending.
5. Conclusions
PNA female rats exhibited larger muscle mass and fiber CSA, as well as a shift towards more fibers exhibiting a fast oxidative glycolytic phenotype in the GN muscle. Elevated fasting serum insulin levels may be an early indicator of skeletal muscle insulin resistance in this model and corresponded with increased IRS1 protein levels and a reduced ratio of Ser636/9 phosphorylated IRS1 to total IRS1 in the GN and TA muscles, as well as decreased Thr389 phosphorylated p70S6K in GN. More lipid content in the PNA GN and TA is consistent with insulin resistance in these muscles. The shift towards a fast oxidative glycolytic fiber phenotype may be an adaptive mechanism to impaired insulin sensitivity or altered fuel availability.
Acknowledgments
We thank Mary Petro for assistance with animal handling for the rota-rod time trials and Eric Buza for assisting with dissections. We thank Kieran Ryan for assistance with imaging and counting muscle fibers.
Abbreviations
| CSA | cross-sectional area |
| EDL | extensor digitorum longus |
| fMHC | fast isoform of myosin heavy chain |
| fMHC+ | positive for fast isoform of myosin heavy chain |
| GN | gastrocnemius |
| HOMA-IR | homeostatic model assessment of insulin resistance |
| MHC | myosin heavy chain |
| PCOS | polycystic ovary syndrome |
| PNA | prenatally androgenized |
| sMHC | slow isoform of myosin heavy chain |
| sMHC+ | positive for slow isoform of myosin heavy chain |
| SO | sesame oil |
| SOL | soleus |
| T | testosterone |
| TA | tibialis anterior |
Author Contributions
Conceptualization, D.L.S. and J.L.; data collection, A.D. and R.H.; formal analysis, A.D. and D.L.S.; writing—original draft preparation, D.L.S.; writing—review and editing, A.D., R.H, J.L., D.L.S.; supervision, D.L.S. and J.L.; funding acquisition, D.L.S. All authors have read and agreed to the published version of the manuscript.
Funding
This work was supported by a Lake Erie College of Osteopathic Medicine and Lake Erie Consortium for Osteopathic Medical Training grant to D.L.S.
Conflicts of Interest
The authors declare no conflict of interest.
Footnotes
Publisher’s Note: MDPI stays neutral with regard to jurisdictional claims in published maps and institutional affiliations.
References
- 1.Franks S. Polycystic ovary syndrome. N. Engl. J. Med. 1995;333:853–861. doi: 10.1056/NEJM199509283331307. [DOI] [PubMed] [Google Scholar]
- 2.Teede H., Deeks A., Moran L. Polycystic ovary syndrome: A complex condition with psychological, reproductive and metabolic manifestations that impacts on health across the lifespan. BMC Med. 2010;8:41. doi: 10.1186/1741-7015-8-41. [DOI] [PMC free article] [PubMed] [Google Scholar]
- 3.Welt C.K., Carmina E. Clinical review: Lifecycle of polycystic ovary syndrome (PCOS): From in utero to menopause. J. Clin. Endocrinol. Metab. 2013;98:4629–4638. doi: 10.1210/jc.2013-2375. [DOI] [PMC free article] [PubMed] [Google Scholar]
- 4.Azziz R., Carmina E., Dewailly D., Diamanti-Kandarakis E., Escobar-Morreale H.F., Futterweit W., Janssen O.E., Legro R.S., Norman R.J., Taylor A.E., et al. The Androgen Excess and PCOS Society criteria for the polycystic ovary syndrome: The complete task force report. Fertil. Steril. 2009;91:456–488. doi: 10.1016/j.fertnstert.2008.06.035. [DOI] [PubMed] [Google Scholar]
- 5.Abbott D.H., Tarantal A.F., Dumesic D.A. Fetal, infant, adolescent and adult phenotypes of polycystic ovary syndrome in prenatally androgenized female rhesus monkeys. Am. J. Primatol. 2009;71:776–784. doi: 10.1002/ajp.20679. [DOI] [PMC free article] [PubMed] [Google Scholar]
- 6.Abbott D.H., Bruns C.R., Barnett D.K., Dunaif A., Goodfriend T.L., Dumesic D.A., Tarantal A.F. Experimentally induced gestational androgen excess disrupts glucoregulation in rhesus monkey dams and their female offspring. Am. J. Physiol. Endocrinol. Metab. 2010;299:E741–E751. doi: 10.1152/ajpendo.00058.2010. [DOI] [PMC free article] [PubMed] [Google Scholar]
- 7.Roland A.V., Nunemaker C.S., Keller S.R., Moenter S.M. Prenatal androgen exposure programs metabolic dysfunction in female mice. J. Endocrinol. 2010;207:213–223. doi: 10.1677/JOE-10-0217. [DOI] [PMC free article] [PubMed] [Google Scholar]
- 8.Tyndall V., Broyde M., Sharpe R., Welsh M., Drake A.J., McNeilly A.S. Effect of androgen treatment during foetal and/or neonatal life on ovarian function in prepubertal and adult rats. Reproduction. 2012;143:21–33. doi: 10.1530/REP-11-0239. [DOI] [PMC free article] [PubMed] [Google Scholar]
- 9.Nohara K., Waraich R.S., Liu S., Ferron M., Waget A., Meyers M.S., Karsenty G., Burcelin R., Mauvais-Jarvis F. Developmental androgen excess programs sympathetic tone and adipose tissue dysfunction and predisposes to a cardiometabolic syndrome in female mice. Am. J. Physiol. Endocrinol. Metab. 2013;304:E1321–E1330. doi: 10.1152/ajpendo.00620.2012. [DOI] [PMC free article] [PubMed] [Google Scholar]
- 10.Wu X.Y., Li Z.L., Wu C.Y., Liu Y.M., Lin H., Wang S.H., Xiao W.F. Endocrine traits of polycystic ovary syndrome in prenatally androgenized female Sprague-Dawley rats. Endocr. J. 2010;57:201–209. doi: 10.1507/endocrj.K09E-205. [DOI] [PubMed] [Google Scholar]
- 11.Mannerås L., Cajander S., Holmäng A., Seleskovic Z., Lystig T., Lönn M., Stener-Victorin E. A new rat model exhibiting both ovarian and metabolic characteristics of polycystic ovary syndrome. Endocrinology. 2007;148:3781–3791. doi: 10.1210/en.2007-0168. [DOI] [PubMed] [Google Scholar]
- 12.Tenover J.S. Effects of testosterone supplementation in the aging male. J. Clin. Endocrinol. Metab. 1992;75:1092–1098. doi: 10.1210/jcem.75.4.1400877. [DOI] [PubMed] [Google Scholar]
- 13.Griggs R.C., Kingston W., Jozefowicz R.F., Herr B.E., Forbes G., Halliday D. Effect of testosterone on muscle mass and muscle protein synthesis. J. Appl. Physiol. 1989;66:498–503. doi: 10.1152/jappl.1989.66.1.498. [DOI] [PubMed] [Google Scholar]
- 14.Katznelson L., Finkelstein J.S., Schoenfeld D.A., Rosenthal D.I., Anderson E.J., Klibanski A. Increase in bone density and lean body mass during testosterone administration in men with acquired hypogonadism. J. Clin. Endocrinol. Metab. 1996;81:4358–4365. doi: 10.1210/jcem.81.12.8954042. [DOI] [PubMed] [Google Scholar]
- 15.Carmina E., Guastella E., Longo R.A., Rini G.B., Lobo R.A. Correlates of increased lean muscle mass in women with polycystic ovary syndrome. Eur. J. Endocrinol. 2009;161:583–589. doi: 10.1530/EJE-09-0398. [DOI] [PubMed] [Google Scholar]
- 16.Mario F.M., do Amarante F., Toscani M.K., Spritzer P.M. Lean muscle mass in classic or ovulatory PCOS: Association with central obesity and insulin resistance. Exp. Clin. Endocrinol. Diabetes. 2012;120:511–516. doi: 10.1055/s-0032-1309006. [DOI] [PubMed] [Google Scholar]
- 17.Aydogdu A., Tasci I., Kucukerdonmez O., Tapan S., Aydogdu S., Aydogan U., Sonmez A., Yazici M., Azal O. Increase in subcutaneous adipose tissue and fat free mass in women with polycystic ovary syndrome is related to impaired insulin sensitivity. Gynecol. Endocrinol. 2013;29:152–155. doi: 10.3109/09513590.2012.708802. [DOI] [PubMed] [Google Scholar]
- 18.Kogure G.S., Silva R.C., Picchi Ramos F.K., Miranda-Furtado C.L., Lara L.A., Ferriani R.A., Dos Reis R.M. Women with polycystic ovary syndrome have greater muscle strength irrespective of body composition. Gynecol. Endocrinol. 2015;31:237–242. doi: 10.3109/09513590.2014.982083. [DOI] [PubMed] [Google Scholar]
- 19.Kogure G.S., Piccki F.K., Vieira C.S., Martins W.e.P., dos Reis R.M. Analysis of muscle strength and body composition of women with polycystic ovary syndrome. Rev. Bras. Ginecol. Obstet. 2012;34:316–322. doi: 10.1590/S0100-72032012000700005. [DOI] [PubMed] [Google Scholar]
- 20.Kogure G.S., Silva R.C., Miranda-Furtado C.L., Ribeiro V.B., Pedroso D.C.C., Melo A.S., Ferriani R.A., Reis R.M.D. Hyperandrogenism Enhances Muscle Strength After Progressive Resistance Training, Independent of Body Composition, in Women With Polycystic Ovary Syndrome. J. Strength Cond. Res. 2018;32:2642–2651. doi: 10.1519/JSC.0000000000002714. [DOI] [PubMed] [Google Scholar]
- 21.Douchi T., Yamamoto S., Oki T., Maruta K., Kuwahata R., Nagata Y. Serum androgen levels and muscle mass in women with polycystic ovary syndrome. Obstet. Gynecol. 1999;94:337–340. doi: 10.1016/s0029-7844(99)00311-7. [DOI] [PubMed] [Google Scholar]
- 22.Douchi T., Oki T., Yamasaki H., Kuwahata R., Nakae M., Nagata Y. Relationship of androgens to muscle size and bone mineral density in women with polycystic ovary syndrome. Obstet. Gynecol. 2001;98:445–449. doi: 10.1016/s0029-7844(01)01450-8. [DOI] [PubMed] [Google Scholar]
- 23.The Amsterdam ESHRE/ASRM-Sponsored 3rd PCOS Consensus Workshop Group Consensus on women’s health aspects of polycystic ovary syndrome (PCOS) Hum. Reprod. 2012;27:14–24. doi: 10.1093/humrep/der396. [DOI] [PubMed] [Google Scholar]
- 24.Dunaif A., Segal K.R., Futterweit W., Dobrjansky A. Profound peripheral insulin resistance, independent of obesity, in polycystic ovary syndrome. Diabetes. 1989;38:1165–1174. doi: 10.2337/diab.38.9.1165. [DOI] [PubMed] [Google Scholar]
- 25.Legro R.S. Insulin resistance in polycystic ovary syndrome: Treating a phenotype without a genotype. Mol. Cell Endocrinol. 1998;145:103–110. doi: 10.1016/S0303-7207(98)00176-2. [DOI] [PubMed] [Google Scholar]
- 26.Ciaraldi T.P., el-Roeiy A., Madar Z., Reichart D., Olefsky J.M., Yen S.S. Cellular mechanisms of insulin resistance in polycystic ovarian syndrome. J. Clin. Endocrinol. Metab. 1992;75:577–583. doi: 10.1210/jcem.75.2.1322430. [DOI] [PubMed] [Google Scholar]
- 27.Comerford K.B., Almario R.U., Kim K., Karakas S.E. Lean mass and insulin resistance in women with polycystic ovary syndrome. Metabolism. 2012;61:1256–1260. doi: 10.1016/j.metabol.2012.02.004. [DOI] [PubMed] [Google Scholar]
- 28.Krotkiewski M. Role of muscle morphology in the development of insulin resistance and metabolic syndrome. Presse Med. 1994;23:1393–1399. [PubMed] [Google Scholar]
- 29.Stuart C.A., McCurry M.P., Marino A., South M.A., Howell M.E., Layne A.S., Ramsey M.W., Stone M.H. Slow-twitch fiber proportion in skeletal muscle correlates with insulin responsiveness. J. Clin. Endocrinol. Metab. 2013;98:2027–2036. doi: 10.1210/jc.2012-3876. [DOI] [PMC free article] [PubMed] [Google Scholar]
- 30.Yan X., Dai X., Wang J., Zhao n., Cui Y., Liu J. Prenatal androgen excess programs metabolic derangements in pubertal female rats. J. Endocrinol. 2013;217:119–129. doi: 10.1530/JOE-12-0577. [DOI] [PubMed] [Google Scholar]
- 31.Tehrani F.R., Noroozzadeh M., Zahediasl S., Piryaei A., Azizi F. Introducing a rat model of prenatal androgen-induced polycystic ovary syndrome in adulthood. Exp. Physiol. 2014;99:792–801. doi: 10.1113/expphysiol.2014.078055. [DOI] [PubMed] [Google Scholar]
- 32.Demissie M., Lazic M., Foecking E.M., Aird F., Dunaif A., Levine J.E. Transient prenatal androgen exposure produces metabolic syndrome in adult female rats. Am. J. Physiol. Endocrinol. Metab. 2008;295:E262–E268. doi: 10.1152/ajpendo.90208.2008. [DOI] [PMC free article] [PubMed] [Google Scholar]
- 33.Shah A.B., Nivar I., Speelman D.L. Elevated androstenedione in young adult but not early adolescent prenatally androgenized female rats. PLoS ONE. 2018;13:e0196862. doi: 10.1371/journal.pone.0196862. [DOI] [PMC free article] [PubMed] [Google Scholar]
- 34.Foecking E.M., Szabo M., Schwartz n.B., Levine J.E. Neuroendocrine consequences of prenatal androgen exposure in the female rat: Absence of luteinizing hormone surges, suppression of progesterone receptor gene expression, and acceleration of the gonadotropin-releasing hormone pulse generator. Biol. Reprod. 2005;72:1475–1483. doi: 10.1095/biolreprod.105.039800. [DOI] [PubMed] [Google Scholar]
- 35.Morrison S.A., Goss A.M., Azziz R., Raju D.A., Gower B.A. Peri-muscular adipose tissue may play a unique role in determining insulin sensitivity/resistance in women with polycystic ovary syndrome. Hum. Reprod. 2017;32:185–192. doi: 10.1093/humrep/dew279. [DOI] [PMC free article] [PubMed] [Google Scholar]
- 36.Goodarzi M.O., Dumesic D.A., Chazenbalk G., Azziz R. Polycystic ovary syndrome: Etiology, pathogenesis and diagnosis. Nat. Rev. Endocrinol. 2011;7:219–231. doi: 10.1038/nrendo.2010.217. [DOI] [PubMed] [Google Scholar]
- 37.Livadas S., Pappas C., Karachalios A., Marinakis E., Tolia N., Drakou M., Kaldrymides P., Panidis D., Diamanti-Kandarakis E. Prevalence and impact of hyperandrogenemia in 1,218 women with polycystic ovary syndrome. Endocrine. 2014;47:631–638. doi: 10.1007/s12020-014-0200-7. [DOI] [PubMed] [Google Scholar]
- 38.Pinola P., Piltonen T.T., Puurunen J., Vanky E., Sundström-Poromaa I., Stener-Victorin E., Ruokonen A., Puukka K., Tapanainen J.S., Morin-Papunen L.C. Androgen Profile Through Life in Women With Polycystic Ovary Syndrome: A Nordic Multicenter Collaboration Study. J. Clin. Endocrinol. Metab. 2015;100:3400–3407. doi: 10.1210/jc.2015-2123. [DOI] [PubMed] [Google Scholar]
- 39.Douchi T., Yoshimitsu N., Nagata Y. Relationships among serum testosterone levels, body fat and muscle mass distribution in women with polycystic ovary syndrome. Endocr. J. 2001;48:685–689. doi: 10.1507/endocrj.48.685. [DOI] [PubMed] [Google Scholar]
- 40.Thomson R.L., Buckley J.D., Moran L.J., Noakes M., Clifton P.M., Norman R.J., Brinkworth G.D. Comparison of aerobic exercise capacity and muscle strength in overweight women with and without polycystic ovary syndrome. BJOG. 2009;116:1242–1250. doi: 10.1111/j.1471-0528.2009.02177.x. [DOI] [PubMed] [Google Scholar]
- 41.Homa L.D., Burger L.L., Cuttitta A.J., Michele D.E., Moenter S.M. Voluntary Exercise Improves Estrous Cyclicity in Prenatally Androgenized Female Mice Despite Programming Decreased Voluntary Exercise: Implications for Polycystic Ovary Syndrome (PCOS) Endocrinology. 2015;156:4618–4628. doi: 10.1210/en.2015-1593. [DOI] [PMC free article] [PubMed] [Google Scholar]
- 42.Eleftheriadou M., Michala L., Stefanidis K., Iliadis I., Lykeridou A., Antsaklis A. Exercise and sedentary habits among adolescents with PCOS. J. Pediatr. Adolesc. Gynecol. 2012;25:172–174. doi: 10.1016/j.jpag.2011.11.009. [DOI] [PubMed] [Google Scholar]
- 43.Cosar E., Köken G., Sahin F.K., Akgün L., Uçok K., Genç A., Yilmazer M. Resting metabolic rate and exercise capacity in women with polycystic ovary syndrome. Int. J. Gynaecol. Obstet. 2008;101:31–34. doi: 10.1016/j.ijgo.2007.10.011. [DOI] [PubMed] [Google Scholar]
- 44.Orio F., Giallauria F., Palomba S., Cascella T., Manguso F., Vuolo L., Russo T., Tolino A., Lombardi G., Colao A., et al. Cardiopulmonary impairment in young women with polycystic ovary syndrome. J. Clin. Endocrinol. Metab. 2006;91:2967–2971. doi: 10.1210/jc.2006-0216. [DOI] [PubMed] [Google Scholar]
- 45.Stuart C.A., Howell M.E., Yin D. Overexpression of GLUT5 in diabetic muscle is reversed by pioglitazone. Diabetes Care. 2007;30:925–931. doi: 10.2337/dc06-1788. [DOI] [PubMed] [Google Scholar]
- 46.Mårin P., Andersson B., Krotkiewski M., Björntorp P. Muscle fiber composition and capillary density in women and men with NIDDM. Diabetes Care. 1994;17:382–386. doi: 10.2337/diacare.17.5.382. [DOI] [PubMed] [Google Scholar]
- 47.Grulet H., Hecart A.C., Delemer B., Gross A., Sulmont V., Leutenegger M., Caron J. Roles of LH and insulin resistance in lean and obese polycystic ovary syndrome. Clin. Endocrinol. 1993;38:621–626. doi: 10.1111/j.1365-2265.1993.tb02144.x. [DOI] [PubMed] [Google Scholar]
- 48.Zhu S., Tian Z., Torigoe D., Zhao J., Xie P., Sugizaki T., Sato M., Horiguchi H., Terada K., Kadomatsu T., et al. Aging- and obesity-related peri-muscular adipose tissue accelerates muscle atrophy. PLoS ONE. 2019;14:e0221366. doi: 10.1371/journal.pone.0221366. [DOI] [PMC free article] [PubMed] [Google Scholar]
- 49.Khan I.M., Perrard X.Y., Brunner G., Lui H., Sparks L.M., Smith S.R., Wang X., Shi Z.Z., Lewis D.E., Wu H., et al. Intermuscular and perimuscular fat expansion in obesity correlates with skeletal muscle T cell and macrophage infiltration and insulin resistance. Int. J. Obes. 2015;39:1607–1618. doi: 10.1038/ijo.2015.104. [DOI] [PMC free article] [PubMed] [Google Scholar]
- 50.Goss A.M., Gower B.A. Insulin sensitivity is associated with thigh adipose tissue distribution in healthy postmenopausal women. Metabolism. 2012;61:1817–1823. doi: 10.1016/j.metabol.2012.05.016. [DOI] [PMC free article] [PubMed] [Google Scholar]
- 51.Goodpaster B.H., Thaete F.L., Kelley D.E. Thigh adipose tissue distribution is associated with insulin resistance in obesity and in type 2 diabetes mellitus. Am. J. Clin. Nutr. 2000;71:885–892. doi: 10.1093/ajcn/71.4.885. [DOI] [PubMed] [Google Scholar]
- 52.Komiya H., Mori Y., Yokose T., Kurokawa N., Horie N., Tajima N. Effect of intramuscular fat difference on glucose and insulin reaction in oral glucose tolerance test. J. Atheroscler. Thromb. 2006;13:136–142. doi: 10.5551/jat.13.136. [DOI] [PubMed] [Google Scholar]
- 53.Van der Kolk B.W., Goossens G.H., Jocken J.W., Blaak E.E. Altered skeletal muscle fatty acid handling is associated with the degree of insulin resistance in overweight and obese humans. Diabetologia. 2016;59:2686–2696. doi: 10.1007/s00125-016-4104-3. [DOI] [PMC free article] [PubMed] [Google Scholar]
- 54.Ingram K.H., Hill H., Moellering D.R., Hill B.G., Lara-Castro C., Newcomer B., Brandon L.J., Ingalls C.P., Penumetcha M., Rupp J.C., et al. Skeletal muscle lipid peroxidation and insulin resistance in humans. J. Clin. Endocrinol. Metab. 2012;97:E1182–E1186. doi: 10.1210/jc.2011-2963. [DOI] [PMC free article] [PubMed] [Google Scholar]
- 55.Pillon n.J., Croze M.L., Vella R.E., Soulère L., Lagarde M., Soulage C.O. The lipid peroxidation by-product 4-hydroxy-2-nonenal (4-HNE) induces insulin resistance in skeletal muscle through both carbonyl and oxidative stress. Endocrinology. 2012;153:2099–2111. doi: 10.1210/en.2011-1957. [DOI] [PubMed] [Google Scholar]
- 56.Soulage C.O., Sardón Puig L., Soulère L., Zarrouki B., Guichardant M., Lagarde M., Pillon N.J. Skeletal muscle insulin resistance is induced by 4-hydroxy-2-hexenal, a by-product of n-3 fatty acid peroxidation. Diabetologia. 2018;61:688–699. doi: 10.1007/s00125-017-4528-4. [DOI] [PMC free article] [PubMed] [Google Scholar]
- 57.Prasannarong M., Santos F.R., Hooshmand P., Giovannini F.J., Henriksen E.J. The lipid peroxidation end-product and oxidant 4-hydroxynonenal induces insulin resistance in rat slow-twitch skeletal muscle. Arch. Physiol. Biochem. 2014;120:22–28. doi: 10.3109/13813455.2013.834937. [DOI] [PubMed] [Google Scholar]
- 58.Noroozzadeh M., Ramezani Tehrani F., Sedaghat K., Godini A., Azizi F. The impact of prenatal exposure to a single dose of testosterone on insulin resistance, glucose tolerance and lipid profile of female rat’s offspring in adulthood. J. Endocrinol. Investig. 2015;38:489–495. doi: 10.1007/s40618-014-0198-y. [DOI] [PubMed] [Google Scholar]
- 59.Ressler I.B., Grayson B.E., Ulrich-Lai Y.M., Seeley R.J. Diet-induced obesity exacerbates metabolic and behavioral effects of polycystic ovary syndrome in a rodent model. Am. J. Physiol. Endocrinol. Metab. 2015;308:E1076–E1084. doi: 10.1152/ajpendo.00182.2014. [DOI] [PMC free article] [PubMed] [Google Scholar]
- 60.Kauffman A.S., Thackray V.G., Ryan G.E., Tolson K.P., Glidewell-Kenney C.A., Semaan S.J., Poling M.C., Iwata N., Breen K.M., Duleba A.J., et al. A Novel Letrozole Model Recapitulates Both the Reproductive and Metabolic Phenotypes of Polycystic Ovary Syndrome in Female Mice. Biol. Reprod. 2015;93:69. doi: 10.1095/biolreprod.115.131631. [DOI] [PMC free article] [PubMed] [Google Scholar]
- 61.Padmanabhan V., Veiga-Lopez A., Abbott D.H., Recabarren S.E., Herkimer C. Developmental programming: Impact of prenatal testosterone excess and postnatal weight gain on insulin sensitivity index and transfer of traits to offspring of overweight females. Endocrinology. 2010;151:595–605. doi: 10.1210/en.2009-1015. [DOI] [PMC free article] [PubMed] [Google Scholar]
- 62.Skarra D.V., Hernández-Carretero A., Rivera A.J., Anvar A.R., Thackray V.G. Hyperandrogenemia Induced by Letrozole Treatment of Pubertal Female Mice Results in Hyperinsulinemia Prior to Weight Gain and Insulin Resistance. Endocrinology. 2017;158:2988–3003. doi: 10.1210/en.2016-1898. [DOI] [PMC free article] [PubMed] [Google Scholar]
- 63.Diamanti-Kandarakis E. Insulin resistance in PCOS. Endocrine. 2006;30:13–17. doi: 10.1385/ENDO:30:1:13. [DOI] [PubMed] [Google Scholar]
- 64.Manco M., Castagneto-Gissey L., Arrighi E., Carnicelli A., Brufani C., Luciano R., Mingrone G. Insulin dynamics in young women with polycystic ovary syndrome and normal glucose tolerance across categories of body mass index. PLoS ONE. 2014;9:e92995. doi: 10.1371/journal.pone.0092995. [DOI] [PMC free article] [PubMed] [Google Scholar]
- 65.Barbieri R.L., Smith S., Ryan K.J. The role of hyperinsulinemia in the pathogenesis of ovarian hyperandrogenism. Fertil. Steril. 1988;50:197–212. doi: 10.1016/s0015-0282(16)60060-2. [DOI] [PubMed] [Google Scholar]
- 66.Franks S., Gilling-Smith C., Watson H., Willis D. Insulin action in the normal and polycystic ovary. Endocrinol. Metab. Clin. N. Am. 1999;28:361–378. doi: 10.1016/S0889-8529(05)70074-8. [DOI] [PubMed] [Google Scholar]
- 67.Barbieri R.L., Makris A., Randall R.W., Daniels G., Kistner R.W., Ryan K.J. Insulin stimulates androgen accumulation in incubations of ovarian stroma obtained from women with hyperandrogenism. J. Clin. Endocrinol. Metab. 1986;62:904–910. doi: 10.1210/jcem-62-5-904. [DOI] [PubMed] [Google Scholar]
- 68.Mauras n., Welch S., Rini A., Haymond M.W. Ovarian hyperandrogenism is associated with insulin resistance to both peripheral carbohydrate and whole-body protein metabolism in postpubertal young females: A metabolic study. J. Clin. Endocrinol. Metab. 1998;83:1900–1905. doi: 10.1210/jcem.83.6.4866. [DOI] [PubMed] [Google Scholar]
- 69.Nestler J.E. Insulin regulation of human ovarian androgens. Hum. Reprod. 1997;12(Suppl. 1):53–62. doi: 10.1093/humrep/12.suppl_1.53. [DOI] [PubMed] [Google Scholar]
- 70.Eriksen M., Pørneki A.D., Skov V., Burns J.S., Beck-Nielsen H., Glintborg D., Gaster M. Insulin resistance is not conserved in myotubes established from women with PCOS. PLoS ONE. 2010;5:e14469. doi: 10.1371/journal.pone.0014469. [DOI] [PMC free article] [PubMed] [Google Scholar]
- 71.Allemand M.C., Irving B.A., Asmann Y.W., Klaus K.A., Tatpati L., Coddington C.C., Nair K.S. Effect of testosterone on insulin stimulated IRS1 Ser phosphorylation in primary rat myotubes--a potential model for PCOS-related insulin resistance. PLoS ONE. 2009;4:e4274. doi: 10.1371/journal.pone.0004274. [DOI] [PMC free article] [PubMed] [Google Scholar]
- 72.Ciaraldi T.P., Aroda V., Mudaliar S., Chang R.J., Henry R.R. Polycystic ovary syndrome is associated with tissue-specific differences in insulin resistance. J. Clin. Endocrinol. Metab. 2009;94:157–163. doi: 10.1210/jc.2008-1492. [DOI] [PMC free article] [PubMed] [Google Scholar]
- 73.Corbould A., Dunaif A. The adipose cell lineage is not intrinsically insulin resistant in polycystic ovary syndrome. Metabolism. 2007;56:716–722. doi: 10.1016/j.metabol.2006.12.021. [DOI] [PMC free article] [PubMed] [Google Scholar]
- 74.Corbould A., Kim Y.B., Youngren J.F., Pender C., Kahn B.B., Lee A., Dunaif A. Insulin resistance in the skeletal muscle of women with PCOS involves intrinsic and acquired defects in insulin signaling. Am. J. Physiol. Endocrinol. Metab. 2005;288:E1047–E1054. doi: 10.1152/ajpendo.00361.2004. [DOI] [PubMed] [Google Scholar]
- 75.Dantas W.S., Murai I.H., Perandini L.A., Azevedo H., Moreira-Filho C.A., Camara N.O., Roschel H., Gualano B. Acute exercise elicits differential expression of insulin resistance genes in the skeletal muscle of patients with polycystic ovary syndrome. Clin. Endocrinol. 2017;86:688–697. doi: 10.1111/cen.13307. [DOI] [PubMed] [Google Scholar]
- 76.Højlund K., Glintborg D., Andersen N.R., Birk J.B., Treebak J.T., Frøsig C., Beck-Nielsen H., Wojtaszewski J.F. Impaired insulin-stimulated phosphorylation of Akt and AS160 in skeletal muscle of women with polycystic ovary syndrome is reversed by pioglitazone treatment. Diabetes. 2008;57:357–366. doi: 10.2337/db07-0706. [DOI] [PubMed] [Google Scholar]
- 77.Glintborg D., Højlund K., Andersen N.R., Hansen B.F., Beck-Nielsen H., Wojtaszewski J.F. Impaired insulin activation and dephosphorylation of glycogen synthase in skeletal muscle of women with polycystic ovary syndrome is reversed by pioglitazone treatment. J. Clin. Endocrinol. Metab. 2008;93:3618–3626. doi: 10.1210/jc.2008-0760. [DOI] [PubMed] [Google Scholar]
- 78.Corbould A., Zhao H., Mirzoeva S., Aird F., Dunaif A. Enhanced mitogenic signaling in skeletal muscle of women with polycystic ovary syndrome. Diabetes. 2006;55:751–759. doi: 10.2337/diabetes.55.03.06.db05-0453. [DOI] [PubMed] [Google Scholar]
- 79.Ozes O.N., Akca H., Mayo L.D., Gustin J.A., Maehama T., Dixon J.E., Donner D.B. A phosphatidylinositol 3-kinase/Akt/mTOR pathway mediates and PTEN antagonizes tumor necrosis factor inhibition of insulin signaling through insulin receptor substrate-1. Proc. Natl. Acad. Sci. USA. 2001;98:4640–4645. doi: 10.1073/pnas.051042298. [DOI] [PMC free article] [PubMed] [Google Scholar]
- 80.Dufner A., Thomas G. Ribosomal S6 kinase signaling and the control of translation. Exp. Cell Res. 1999;253:100–109. doi: 10.1006/excr.1999.4683. [DOI] [PubMed] [Google Scholar]
- 81.Weng Q.P., Kozlowski M., Belham C., Zhang A., Comb M.J., Avruch J. Regulation of the p70 S6 kinase by phosphorylation in vivo. Analysis using site-specific anti-phosphopeptide antibodies. J. Biol. Chem. 1998;273:16621–16629. doi: 10.1074/jbc.273.26.16621. [DOI] [PubMed] [Google Scholar]
- 82.ThermoFisher Scientific [(accessed on 24 October 2020)]; Available online: https://www.thermofisher.com/antibody/product/ATP5A1-Antibody-clone-7H10BD4F9-Monoclonal/459240.
- 83.Abcam [(accessed on 24 October 2020)]; Available online: https://www.abcam.com/slow-skeletal-myosin-heavy-chain-antibody-noq754d-ab11083.html.
- 84.Vector Laboratories [(accessed on 24 October 2020)]; Available online: https://vectorlabs.com/dylight-488-goat-anti-rabbit-igg-antibody.html. [Google Scholar]
- 85.Vector Laboratories [(accessed on 24 October 2020)]; Available online: https://vectorlabs.com/dylight-488-horse-anti-mouse-igg-antibody.html.
- 86.Vector Laboratories [(accessed on 24 October 2020)]; Available online: https://vectorlabs.com/dylight-549-horse-anti-mouse-igg-antibody.html.
- 87.Vector Laboratories [(accessed on 24 October 2020)]; Available online: https://vectorlabs.com/dylight-549-goat-anti-rabbit-igg-antibody.html.
- 88.ABclonal [(accessed on 24 October 2020)]; Available online: https://abclonal.com/catalog-antibodies/GAPDHMousemAb/AC002.
- 89.Cell Signaling Technology [(accessed on 24 October 2020)]; Available online: https://www.cellsignal.com/products/primary-antibodies/phospho-irs-1-ser636-639-antibody/2388?Ntk=Products&Ntt=2388.
- 90.Cell Signaling Technology [(accessed on 24 October 2020)]; Available online: https://www.cellsignal.com/products/primary-antibodies/irs-1-antibody/2382?Ntk=Products&Ntt=2382.
- 91.Cell Signaling Technology [(accessed on 24 October 2020)]; Available online: https://www.cellsignal.com/products/primary-antibodies/insulin-receptor-b-4b8-rabbit-mab/3025?Ntk=Products&Ntt=3025.
- 92.Cell Signaling Technology [(accessed on 24 October 2020)]; Available online: https://www.cellsignal.com/products/primary-antibodies/phospho-akt-ser473-antibody/9271?Ntk=Products&Ntt=9271.
- 93.Cell Signaling Technology [(accessed on 24 October 2020)]; Available online: https://www.cellsignal.com/products/primary-antibodies/akt-antibody/9272?Ntk=Products&Ntt=9272.
- 94.Cell Signaling Technology [(accessed on 24 October 2020)]; Available online: https://www.cellsignal.com/products/primary-antibodies/phospho-p70-s6-kinase-thr389-antibody/9205?Ntk=Products&Ntt=9205.
- 95.Cell Signaling Technology [(accessed on 24 October 2020)]; Available online: https://www.cellsignal.com/products/primary-antibodies/p70-s6-kinase-antibody/9202?Ntk=Products&Ntt=9202.
- 96.Li-Cor, Inc [(accessed on 24 October 2020)]; Available online: https://www.licor.com/bio/reagents/irdye-680rd-donkey-anti-mouse-igg-secondary-antibody.
- 97.Li-Cor, Inc [(accessed on 24 October 2020)]; Available online: https://www.licor.com/bio/reagents/irdye-800cw-donkey-anti-rabbit-igg-secondary-antibody.


