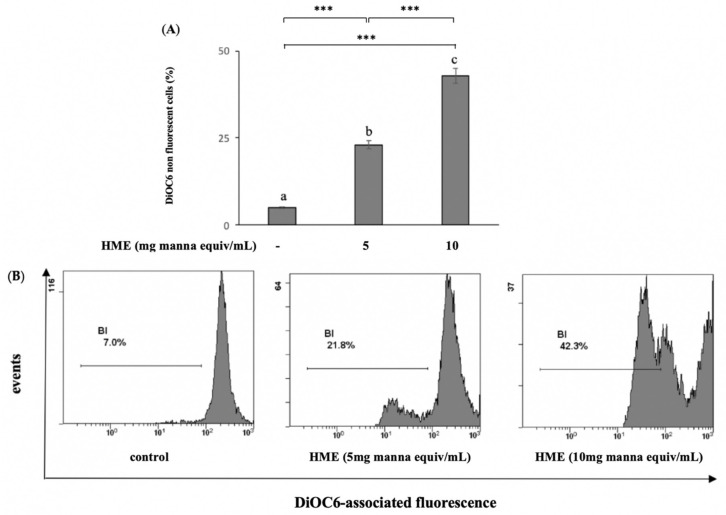
Figure 3.
Depolarization of mitochondrial membrane potential induced by HME on HCT-116 cells. Cells were treated for 24 h as reported in Methods. Then the percentages of DiOC6 stained-HeLa cells were determined by a flow cytometer and compared to untreated cells (control). (A) Mean values ± SD of three separate experiments in triplicate. Means with different letters are significantly different (one-way Anova associated with Tukey’s post hoc test) with *** p < 0.001. (B) Representative images.

