

Summary
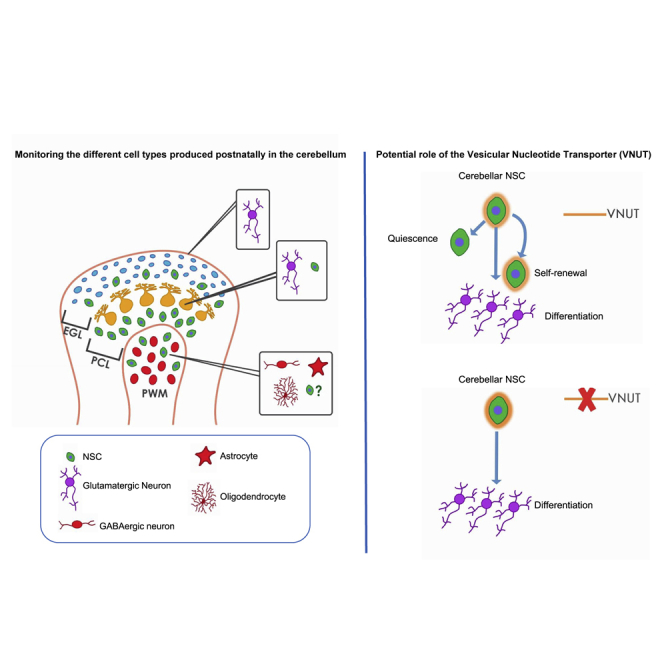
Little is known about the intrinsic specification of postnatal cerebellar neural stem cells (NSCs) and to what extent they depend on information from their local niche. Here, we have used an adapted cell preparation of isolated postnatal NSCs and live imaging to demonstrate that cerebellar progenitors maintain their neurogenic nature by displaying hallmarks of NSCs. Furthermore, by using this preparation, all the cell types produced postnatally in the cerebellum, in similar relative proportions to those observed in vivo, can be monitored. The fact that neurogenesis occurs in such organized manner in the absence of signals from the local environment, suggests that cerebellar lineage progression is to an important extent governed by cell-intrinsic or pre-programmed events. Finally, we took advantage of the absence of the niche to assay the influence of the vesicular nucleotide transporter inhibition, which dramatically reduced the number of NSCs in vitro by promoting their progression toward neurogenesis.
Keywords: neural stem cell, cerebellum, live imaging, time-lapse video microscopy, VNUT, purinergic signaling, postnatal neurogenesis
Graphical Abstract
Highlights
-
•
We present a preparation that allows monitoring the behavior of cerebellar NSCs
-
•
Isolated NSCs maintain their neurogenic nature in absence of niche factors
-
•
The model enables monitoring the three postnatal cerebellar niches simultaneously
-
•
VNUT influences the balance between quiescence and activation of cerebellar NSCs
In this article, Ortega and colleagues describe a cell preparation that allows, in combination with live imaging, monitoring the behavior of NSCs from the three postnatal cerebellar niches. The authors provide evidence that, despite the absence of niche signals, isolated NSCs maintain their neurogenic nature and suggest a role for VNUT in the decision between quiescence and activation of cerebellar NSCs.
Introduction
Among the central nervous system structures, the development of the cerebellum is probably the best studied (Hatten and Heintz, 1995; Leto et al., 2016).The structure of the cerebellum is not finalized until postnatal stages. Postnatal cerebellar neural progenitors reside in three specific proliferative niches: the external granular layer (EGL), known to produce granule cells (Alvarez Otero et al., 1993; Hallonet et al., 1990); the Purkinje cell layer (PCL) that produces the astroglial and Bergmann glial progenitors (Buffo and Rossi, 2013); and the prospective white matter (PWM) that contains GABAergic interneuron progenitors as well as astroglial and oligodendroglial populations (Leto et al., 2012; Parmigiani et al., 2015).
Despite the considerable efforts to decipher cerebellar development, major questions remain unanswered regarding the biology of the postnatal NSCs allocated to this area: (1) To what extent are cerebellar NSCs dependent on their local niche at the onset of their lineage progression? (2) How is this process modulated? Homotypic and heterotypic transplantation of postnatally derived cerebellar neurospheres revealed that they retain an intrinsically regional character, although they do seem to be influenced by local environmental cues (Klein et al., 2005). Moreover, several studies highlighted the importance of local signals in the generation of distinct cerebellar populations, such as that of Sonic hedgehog (SHH), fibroblast growth factor (FGF), or the Notch signaling pathway (Fleming et al., 2013; Green et al., 2014; Solecki et al., 2001). Thus, isolation from their niche would be an ideal strategy to disentangle the cell-intrinsic contribution to NSC regulation from that of environmental cues.
The cell-intrinsic mode of cell division is another important issue to be considered, i.e., whether cerebellar NSCs are capable of undergoing self-renewal divisions and, if so, are they symmetric or asymmetric? Asymmetric divisions involve the acquisition of different cell fates by the two daughter cells and as such NSCs might self-renew asymmetrically by generating one cell that remains as a progenitor while the other cell progresses toward a neural cell fate. Alternatively, NSCs might self-renew symmetrically and give rise to two cells that retain their stem cell identity (Schroeder, 2008). In addition, the potential cell fate of cerebellar NSCs remains to be defined. Progenitors from the EGL have been thought to produce cerebellar granule neurons mainly by symmetric terminal divisions (Nakashima et al., 2015; Yang et al., 2015). However, granule precursor cells (GPCs) can be induced in vitro to differentiate into astroglial cells (Okano-Uchida et al., 2004), and a resident population of astroglial progenitors of granule neurons has also been reported (Silbereis et al., 2010). Hence, bipotent progenitors may exist in the EGL. In the PCL, Bergmann glia express NSC markers and they may be expanded in vitro as multipotent neurospheres (Alcock et al., 2007; Alcock and Sottile, 2009). A population of bipotent progenitors resides also in the PWM, giving rise to both astrocytes and GABAergic interneurons (Parmigiani et al., 2015). Nevertheless, while all these studies provide valuable information, they rely on either population analyses performed in vivo or on the study of isolated cells cultured in the presence of crucial niche-derived signals (e.g., SHH, FGF), or as neurospheres. Therefore, the intrinsic behavior, self-renewal capacities and cell fate potential of cerebellar neural progenitors outside their niche remain unclear.
A promising approach to address these relevant questions is the continuous live imaging of single cells isolated from the postnatal cerebellum (PC). Live imaging allows heterogeneous cell behaviors, cell fate decisions or cell death within a clone to be studied (Ortega and Costa, 2016). Thus, we have successfully adapted this technique to study preparations of the PC previously exploited to monitor the lineage progression of adult SEZ-derived NSCs (Costa et al., 2011; Ortega et al., 2011, 2013a). In this model, cerebellar NSCs are cultured at low density under adherent conditions in the absence of growth factors, in isolation from their niche.
As isolated NSCs maintain their neurogenic potential despite the absence of signals from their niche, this model constitutes a unique tool to assay the effects of each of these factors individually. Accordingly, we investigated the role of the vesicular nucleotide transporter (VNUT) in the PC. VNUT allows nucleotides to be stored in secretory vesicles, the first step in purinergic neurotransmission (Sawada et al., 2008). Interestingly, VNUT is expressed strongly in the adult cerebellar cortex (Larsson et al., 2012), and it has been involved in neuritogenesis and neuronal differentiation (Menendez-Mendez et al., 2015, 2017). Our results highlight its influence in setting the balance between quiescent and activated of cerebellar NSCs.
Results
Cerebellar NSCs Isolated in the Absence of Growth Factors Maintain Their Neurogenic Nature, Dividing Symmetrically to Generate Neurons or Asymmetrically to Undergo Self-Renewal
We first explored the possibility of adapting the preparation from the adult SEZ to obtain NSCs from the PC (Ortega et al., 2011, 2013a). As such, cerebellar progenitors isolated from postnatal day 0 (P0) cerebella were submitted to live imaging by time-lapse videomicroscopy (Gomez-Villafuertes et al., 2017; Ortega et al., 2013a). To assess the initial proportions of the cell types isolated in the culture, immunofluorescence was performed 12 h after plating when the majority of cells belonged to the neuronal lineage, i.e., βIII-tubulin+ (65.4% ± 0.69%). In addition, we found populations of SOX2+ intermediate progenitors (17.72% ± 1.81%), GFAP+ astroglial cells (1.88% ± 0.4%), and GFAP+/SOX2+ NSCs (13.30% ± 2.47%; Figure 1A). The remaining cells presumably belonged to oligodendroglial progeny or were cells negative for any of these markers (<2%). Importantly, the percentage of βIII-tubulin+ cells was consistent with a neurogenic environment, such as the P0 cerebellum, whereas the SOX2 labeling was consistent with the presence of NSCs and intermediate progenitors (Ming and Song, 2011; Zhao et al., 2008).
Figure 1.

Cell Dynamics of Cerebellar Neural Progenitors Isolated on Postnatal Day 0
(A) Quantification of the cell populations isolated 12 h after culture, identifying the neuronal cells by βIII-tubulin labeling, NSC intermediate progenitors by GFAP/SOX2 or SOX2 labeling, and parenchymal astrocytes by GFAP labeling.
(B) Relative proportions of the number of rounds of cell division undergone by the cells during live imaging experiments.
(C and D) (C) Relative contribution of cell lineage at the end of live imaging experiments. βIII-tubulin refers to lines containing only neurons, GFAP/SOX2 refers to those containing neurons and NSCs or only NSCs, and SOX2 refers to the lines containing both SOX2 and neurons or only SOX2 cells. (D) Average cell-cycle length according to the round of division.
(E) Neurogenic lineages tracked. Values below round numbers indicate the relative proportions.
(F) Symmetric lineage trees generating neuronal progeny (N, neuron; X, cell death). Phase contrast images depicting lineage progression obtained by time-lapse video microscopy at different time points (day-h:min), the last image corresponds to ICC for SOX2 (red), GFAP (white), and βIII-tubulin (green). Arrowheads point to the different cells comprised within the lineage tree. Scale bar, 30 μm.
(G) Asymmetric lineage generating neuronal and NSC progeny (N, neuron; G, GFAP/SOX2+ astroglia; X, cell death) described as in (F). The values represent the mean ± SEM (n = 5 independent experiments); ∗p < 0.05, ∗∗p < 0.01, ∗∗∗p < 0.001, ANOVA with Tukey's multiple comparison test.
Single-cell tracking revealed that, under mitogen-free conditions, cerebellar neural progenitors continued proliferating, predominantly producing neurons by symmetric neurogenic divisions (Figures 1B–1F). Neurogenic progenitors underwent rounds of divisions before generating neuroblasts, as defined by the expression of βIII-tubulin and by the formation of neurites (Figure 1F; Video S1). Neurogenic trees involved one to five rounds of symmetric proliferative divisions, presumably reflecting the presence of progenitors at different stages in their lineage progression. Of a total of 816 clones tracked, there were significantly more trees comprising one or two rounds of division (63.78 ± 2.86 and 27.02 ± 2.74, respectively). Conversely, the frequency of clones undergoing three to five rounds of division diminished exponentially (Figures 1B, 1E, and S1).
The video shows the preparation depicted in Figure 1F. Note how the progenitors undergo highly synchronous symmetric divisions until they form post-mitotic neuroblasts, characterized by the appearance of cytoplasmic processes and labeling for the neuronal marker βIII-tubulin.
Symmetric neurogenic clones were characterized by a relatively fast cell cycle in all rounds of division (20.70 ± 0.91 h), except for the initial round that was significantly shorter (9.91 ± 2.25 h; Figure 1D). Remarkably, this culture preparation allowed to directly visualize an asymmetric division, with a progenitor giving rise to daughter cells that acquired distinct cell fates: one line that symmetrically produced neurons, whereas the other produced astroglial GFAP+ cells that were not parenchymal astrocytes, but rather NSCs, given their co-labeling for SOX2 (Figure 1G; Video S2). As in other neurogenic niches (Costa et al., 2011), the founder of the asymmetric clone exhibited enhanced cell growth, with the rest of the neurogenic progeny exhibiting a progressive reduction of cell size until neuroblasts were generated. Conversely, GFAP/+SOX2+ cells displayed higher rates of cell growth, in accordance with their status of self-renewing NSCs (Figure S2A). Finally, post-imaging immunocytochemistry confirmed that the majority of the clones contained exclusively βIII-tubulin+ neurons (89.59% ± 3.00%), with an additional 4.53% ± 2.03% containing GFAP+/SOX2+ cells and neurons or just GFAP+/SOX2+ cells, and the remainder 5.87% ± 2.69% formed by SOX2+ cells and neurons or SOX2+ only cells (Figure 1C). Importantly, although Bergman glia expresses GFAP and SOX2 (Mercurio et al., 2019), its contribution to these percentages could be restricted to symmetric GFAP/SOX2 or SOX2 only clones, being the asymmetric clones reported consistent with the presence of NSCs. By comparing imaging immunocytochemistry (ICC) performed after 12 h and at the end of live imaging, it was clear that the number of GFAP/SOX2 and SOX2 clones decreased significantly as the number of neurons increased (Figure S2B). Hence, these progenitors would appear to be activated and exit the cell cycle, progressing toward a neuronal fate in culture.
The video shows the preparation depicted in Figure 1G. Note that the founder cell gives rise to two branches after the first division. One generates neuroblasts after two more rounds of amplifying divisions (βIII-tubulin-positive cells), whereas the other gives rise to two cells labeled for GFAP and Sox2, indicative of a self-renewal event.
The Neurogenic Potential of Isolated Cerebellar Progenitors Declines over Time
The cerebellum undergoes molecular and morphological changes after birth, a period in which resident neural progenitors give rise to postnatal cell populations (Leto et al., 2016). Thus, we wanted to assess whether the neurogenic potential of P0-derived progenitors was maintained as the cerebellum develops. When we analyzed P5 cerebellum cell cultures, the majority of the cells were also of the neuronal lineage (96.74% ± 1.83%), with only a small proportion expressing either GFAP/SOX2 (2.25% ± 0.99%) or just SOX2 (1.00% ± 1.00%; Figure 2A). Single-cell tracking revealed that P5 neural progenitors maintain their neurogenic nature and their capacity to proliferate, although their potential for expansion was severely reduced (Figures 2B–2F). Unlike P0 cultures, neural P5 progenitors underwent a maximum of four rounds of symmetric division before exiting the cell cycle. Of a total of 760 clones tracked, the vast majority displayed a single round of division (89.02% ± 3.11%), with significantly fewer clones undergoing two, three, or four rounds of division (Figures 2B, 2E, and S3). Despite their reduced proliferative capacities, a similar cell-cycle length was maintained relative to the clones isolated at P0 (23 ± 0.81 h), the first round of division also exhibiting a shorter cell cycle (9.61 ± 2.51 h; Figure 2D).
Figure 2.

Cell Dynamics of Cerebellar Neural Progenitors Isolated on Postnatal Day 5
(A) Quantification of the proportions of the cell populations isolated after 12 h in culture. Neuronal cells were identified by βIII-tubulin labeling, NSC intermediate progenitors by GFAP/SOX2 or SOX2 labeling.
(B) Relative proportions of the rounds of cell division undergone by cells monitored by live imaging.
(C) Relative contribution of cell lineages at the end of live imaging experiments. The βIII-tubulin lines contain only neurons, the GFAP/SOX2 lines only NSCs, and the SOX2 lines only SOX2-labeled cells as asymmetric cell divisions were not observed at P5.
(D) Average cell-cycle length for each round of division.
(E) Example of neurogenic lines traced during the experiment with their relative contribution.
(F) Symmetric lineage tree generating neuronal progeny (N, neuron). Phase contrast images showing lineage progression obtained by time-lapse video microscopy at different time points (day-h:min). The last image corresponds to post-imaging ICC for SOX2 (red), GFAP (white), and βIII-tubulin (green). Arrowheads point to the different cells comprised within the lineage tree. Scale bar, 30 μm. The values represent the mean ± SEM (n = 5 independent experiments); ∗p < 0.05, ∗∗p < 0.01, ∗∗∗p < 0.001, ANOVA with Tukey's multiple comparison test.
Remarkably, every lineage analyzed in P5 cultures exclusively underwent symmetric divisions, with no asymmetric divisions observed (Figure 2F; Video S3). Accordingly, ICC revealed that almost every line was composed exclusively of βIII-tubulin+ cells at the end of the live imaging (96.75% ± 1.67%), with a small percentage of clones composed of GFAP+/SOX2+ or SOX2+ only cells (Figure 2C). This was consistent with the small population of GFAP+/SOX2+ cells isolated at the beginning of the culture (12 h), which did not change significantly during the live imaging experiment, suggesting a more quiescent behavior (Figure S2C). However, by the end of the experiment there were no significant differences between P0 and P5 cultures regarding the three populations studied (Figures S4A–S4D). Conversely, we found that lineages of the P0 clones were more complex, undergoing more rounds of division as they progressed along their lineage (Figures S4E and S4F; Video S4).
The video shows the preparation depicted in Figure 2F. Progenitors undergo highly synchronous symmetric divisions until they form post-mitotic neuroblasts characterized by the generation of cytoplasmic processes and labeling for the neuronal marker βIII-tubulin. Note that progenitors isolated at P5 are less capable of undergoing amplifying divisions.
The videos correspond to the preparation shown in Figure 3D. Note that despite the similar number of cells undergoing lineage progression toward neurogenesis, P0-derived cell lineages (Video 4) consistently undergo more rounds of division.
Isolated Cerebellar NSCs/Progenitors Give Rise to all the Cell Populations Generated during Postnatal Cerebellar Development
Once confirmed that the neurogenic potential of the P0 cultures was preserved in the absence of mitogens, we assess whether the distinct cerebellar postnatal cell populations were generated. Glutamatergic neurons expressing the vesicular glutamate transporter 1 (VGlut1) was the main population observed, reaching an 89.3% ± 0.92% of all the neurogenic lineages traced (410 trees), strongly resembling the actual numbers in the cerebellum (White and Sillitoe, 2013). Glutamatergic neurons were mainly produced in symmetric neuronal lines that underwent a maximum of four to five rounds of division before generating VGlut1+ neurons (Figures 3A, 3D, and 3E; Video S5). We also observed asymmetric divisions within this lineage, detecting progenitors that gave rise to both VGlut1+ neurons and astroglial GFAP+ cells (Figure 3B). Conversely, the production of GABAergic interneurons, identified by the expression of the vesicular GABA transporter (VGAT), was much less frequent, assuming 5.6% ± 0.73% of the total neurogenic lineages. GABAergic neurons were produced exclusively in symmetric neurogenic lineages, undergoing a maximum of only two or three rounds of division. No asymmetric division was observed within this lineage (Figures 3C–3E; Video S5).
Figure 3.

P0 Cell Preparation Generates both Glutamatergic and GABAergic Neurons
(A) Symmetric lineage generating glutamatergic neuronal progeny (N, neuron; X, cell death).
(B) Asymmetric lineage generating both glutamatergic neuronal and astroglial progeny (N, neuron; G, GFAP astroglia).
(C) Symmetric lineage generating GABAergic neuronal progeny (N, neuron). All the lineage trees are described as follows: phase contrast images obtained by time-lapse video microscopy at different time points (day-h:min), the last image corresponds to ICC for VGlut1 (green), GFAP (white), or VGAT (red).
(D) Relative proportions of glutamatergic (VGlut1) and GABAergic (VGAT) neurons obtained after live imaging experiments.
(E) Maximum number of rounds of amplifying divisions of either the glutamatergic or GABAergic lineages. The values represent the mean ± SEM (n = 8 independent experiments); ∗p < 0.05, ∗∗∗∗p < 0.0001, t test. Scale bar, 30 μm.
Upper panel: the video shows the preparation depicted in Figure 4A. Note how the progenitors undergo a maximum of five amplifying divisions before generating glutamatergic neurons identified by VGlut1 labeling. Lower panel: the video shows the preparation depicted in Figure 4C. Note how the progenitors undergo a maximum of three amplifying divisions before generating GABAergic neurons labeled for VGAT.
To further confirm the existence of these cell populations on the culture, whole-cell patch-clamp recordings were performed in 7-day-old P0 cell cultures. All recordings were conducted in cells selected by morphological criteria (small ovoid soma and bipolar processes [glutamatergic] or polygonal soma and multipolar cytoplasmic processes [GABAergic]) (Figures 4A–4C). Voltage-gated (100 ms; +10 mV) inwardly directed fast inactivating currents were registered in both bipolar (351.7 ± 63.9 pA; n = 19) and multipolar (717.3 ± 230.0 pA; n = 10) cells. Inward currents were followed by sustained outward currents (59.9 ± 7.4 and 51.72 ± 6.1 pC for bipolar [n = 23] and multipolar [n = 15] cells, respectively), hence allowing cells to fire small amplitude action potentials in response to depolarizing current injections from a membrane potential of −60 mV (n = 5) (Figure 4A). All cells responded to the application of glutamate (1 mM) and GABA (100 μM), albeit mean amplitudes and relative current sizes differed depending on the cellular morphology (Figures 4A and 4B). Currents elicited by glutamate and GABA in bipolar neurons showed amplitudes of 178.1 ± 52.2 pA (n = 15) and 922.2 ± 210.3 pA (n = 9), respectively. In turn, multipolar neurons displayed currents of 218.6 ± 65.2 pA (n = 11) and 391.9 ± 79.6 pA (n = 8) in response to glutamate and GABA, respectively.
Figure 4.

Electrophysiological Characterization of 7-Day-Old P0 Cerebellar Cultures
(A) Left panel: bright-field image of a bipolar cell. A patch-clamp recording pipette placed onto the cell soma is shown. The two other glass pipettes are used for drug (GABA and glutamate) application. Scale bar, 20 μm. Middle panel: voltage- and current-clamp recordings from the imaged cell. Traces to the left represent inward and outward currents activated by a 100-ms voltage pulse to +10 mV from a Vh of −80 mV; traces to the right represent action potential-like voltage changes evoked by a 75-pA current injection from a Vcomm of −60 mV. Recordings are representative of those obtained in five cells from two cultures. Right panel: traces to the left depict current responses to GABA (100 μM) and glutamate (1 mM). Traces to the right represent current (above) and voltage (below) responses to serotonin (5-HT, 100 μM) application in the same cell. Black lines above current traces show time of drug application. Results are representative of those obtained in 15, 9, and 10 cells for glutamate, GABA, and 5-HT, respectively.
(B) Upper panel: bright-field image of a multipolar cell. Other elements are like those shown in (A). Scale bar 20 μm. Lower panel: current responses to GABA, glutamat, and 5-HT in the imaged cell. The horizontal bar shows the application of the drugs at the indicated concentration. Notice that 5-HT was not able to activate any current. Results are representative of those obtained in 11 and 8 cells for glutamate and GABA, respectively.
(C) Left panel: bright-field image of a bipolar and a multipolar cell. The location of a patch pipette and of two (5-HT and MK-801) drug application pipettes is indicated. Scale bar, 20 μm. Right panel: application of 5-HT (100 μM; see arrows) onto the bipolar unclamped cell evoked synaptic-like currents in the neighboring patch-clamped multipolar cell. Current activity was sensitive to superfusion of MK-801 (1 μM), an NMDA antagonist (n = 4).
Since functional 5-HT3 ionotropic receptors are expressed only in glutamatergic cerebellar neurons in the early postnatal life (Oostland et al., 2011), we set out to apply serotonin (5-HT, 100 μM) to the cultured neurons. Interestingly, none of the multipolar neurons tested (n = 7) showed 5-HT-induced currents, but 83% of the bipolar neurons showed small 5-HT-induced inward currents (16.8 ± 3.3 pA; n = 10) capable of generating an action potential-like voltage change in current-clamp recordings (Figures 4A and 4B). Furthermore, local application of 5-HT to an unclamped bipolar in the neighboring of patch-clamped multipolar cell where it was evoked current activity appeared as a series of brief and small amplitude currents, much like as if they were synaptically generated. The amplitude of these currents was strongly reduced by MK-801 (1 μM), an NMDA receptor antagonist, suggesting that they are mediated by glutamate probably released from the cell stimulated with 5-HT (n = 4; Figure 4C).
The generation of astroglial GFAP+ cells was also detected (Figure S5A). Noteworthy, symmetric astroglial clones were mostly negative for SOX2, suggesting the presence of two different GFAP-expressing populations: GFAP+/SOX2− parenchymal astrocytes, and the previously described GFAP+/SOX2+ cerebellar NSCs. Finally, we also observed the generation of oligodendrocyte-like cells through symmetric terminal divisions (Figure S5B).
VNUT Is Expressed Strongly in the PC and It Co-localizes with Cerebellar NSCs
Isolation from extrinsic molecular cues in the developing cerebellum constitutes an ideal scenario to assay how each of these individual factors might modify the behavior of the NSCs. Indeed, activity-dependent control of NSC quiescence exerted by niche neurotransmitters represents a promising means to modulate neurogenesis (Berg et al., 2013). Our experience in the field of purinergic neurotransmission lead us to investigate the role of the VNUT. Western blot and immunohistochemistry revealed that maximal expression of VNUT in the PC occurred on day P0. Thereafter, its expression decreased until P15, when most cerebellar neurogenesis had already happened (Leto et al., 2016), remaining stable until adulthood (Figures 5A, 5B, and S5C). As expected (Menendez-Mendez et al., 2017; Shin et al., 2012), VNUT co-localized with exocytotic vesicular (SYNAPTOPHYSIN and SYNAPTOBREVIN) and lysosomal (LAMP-1) markers (Figure 5C). Remarkably, western blot analysis showed that VNUT expression peaked earlier than other vesicular neurotransmitter transporters, such as VGlut1 (Figures S5C and S5D), suggesting that purinergic signaling plays an important role in the initial steps of postnatal cerebellar development. This was supported by NESTIN immnostaining, an NSC marker (Kriegstein and Alvarez-Buylla, 2009), co-localizing with VNUT during this period (Figures 5D, S5C, and S5F).
Figure 5.

VNUT Expression during Postnatal Cerebellar Development and Co-localization with Vesicular/Lysosomal Markers and NESTIN
(A) VNUT protein expression during cerebellar development normalized to the constitutive GAPDH expression.
(B) Immunofluorescence showing the expression of VNUT at different stages of cerebellar development. VNUT is expressed in all the neurogenic areas in the developing cerebellum but seems to be especially prominent in the EGL and PCL. Scale bar, 50 μm.
(C) Co-localization of VNUT (red) with SYNAPTOPHYSIN and SYNAPTOBREVIN or LAMP-1 (green) in P0 cerebellum. Scale bar, 50 μm.
(D) Immunofluorescence of the initial stages (P0, P3, and P7) of PC development showing a high degree of co-localization between VNUT (red) and the stem cell marker, NESTIN (green). Scale bar, 100 μm. The right-hand panels show higher magnifications focusing on the EGL and PCL. Scale bar, 15 μm. Arrowheads highlight the co-localization between VNUT and NESTIN+ cells. Values represent the mean ± SEM (n = 5 independent experiments); ∗p < 0.05, ANOVA with Tukey's multiple comparison test.
To confirm the presence of VNUT in cerebellar NSCs, we evaluated its co-expression with another NSC marker, SOX2 (Suh et al., 2009). Significantly, VNUT was present in SOX2+ cells at all stages (P0 to adult) and in the three neurogenic niches (Figures 6A and S6). Furthermore, we detected similar numbers of NESTIN+/VNUT+/SOX2+ NSCs and of GFAP+/SOX2+ cells isolated at P0 in culture preparations (Fig S6A).
Figure 6.

VNUT Expressed by SOX2+ Cells in the Developing and Adult Cerebellum
(A) Immunofluorescence images of the co-localization of VNUT (red) with SOX2 (green) in cells of the developing (P0 and P7) and adult cerebellum. Scale bar, 50 μm. The panels on the right are higher magnification images of the SOX2+/VNUT+ cells, indicated by arrowheads. Scale bar, 15 μm.
(B). Immunofluorescence analysis of the VNUT expression in cell culture. The upper left panel represents a general view of the cerebellar cell culture. VNUT co-localizes with neurons (βIII-tubulin+), astrocytes (GFAP+), NSCs (NESTIN+, GFAP+/SOX2+, NESTIN+/SOX2+), and oligodendrocytes (O4+). Scale bar, 50 μm.
Nevertheless, it is important to state that VNUT expression was not specifically restricted to NSCs as its labeling was widely distributed on PC (Figure 6A). In fact, we confirmed in cell cultures that VNUT expression goes beyond NSCs as it was also detected in additional neural populations, including neurons, astrocytes and oligodendrocytes (Figure 6B).
Inhibition of VNUT Promotes NSCs to Re-enter the Cell Cycle and Progress toward Neurogenesis at P0, but Not at P5
The expression of VNUT within the NSC population and the correlation of its expression levels with the peak of postnatal neurogenesis begs the question as to whether VNUT activity modulates the behavior of NSCs. Thus, P0 cell cultures were followed by live imaging in the absence or presence of clodronate (100 nM), a selective VNUT inhibitor (Moriyama and Nomura, 2018). Single-cell tracking revealed that clodronate significantly increased the number of neurogenic clones (Figures 7A and 7E–7G; Video S6) and, notably, this effect was not due to increased global cell viability or to enhanced cell survival (Figures 7H and 7I). Likewise, clodronate did not affect the proliferation of neural progenitors (Figures 7B and 7E–7G), the cell-cycle length within the lineages, or the migratory behavior of the cells in the culture (Figures 7J–7L). Conversely, exposure to clodronate significantly decreased the number of GFAP+/SOX2+ cells in the lineages (Figure 7C). Hence, VNUT inhibition appears to drive cerebellar NSCs to exit quiescence and re-enter the cell cycle, progressing toward neurogenesis. Moreover, we never found asymmetric divisions in the presence of clodronate, further suggesting that VNUT inhibition instructs neurogenic cell-cycle exit, thereby diminishing self-renewal capacities of NSCs. The promotion of cell-cycle exit of NSCs toward a neurogenic fate was further supported by the increase in mRNA levels of genes associated with neuronal differentiation. So, clodronate significantly increased the expression of Atoh1, involved in the differentiation and commitment of GPCs. In addition, the levels of Neurod1, a downstream target of Atoh1, and of Cntn2, expressed by post-mitotic GPCs, also exhibited an increasing tendency. Finally, the expression of Ptfa1, involved in the specification of GABAergic phenotypes, as well as its downstream target Neurog1 (revised in Leto et al., 2016), were increased after VNUT inhibition (Figure 7D).
Figure 7.

Effect of VNUT Inhibition on the Cerebellar NSC Population
(A) Number of clones giving rise to symmetric neurogenic trees in the absence (Control) or the presence of clodronate (100 nM). Values represent the mean ± SEM (n = 5 independent experiments); ∗p < 0.05, unpaired t test.
(B) Percentage of neurogenic lineages undergoing one to five rounds of amplifying divisions in the presence or absence of clodronate.
(C) Proportion of cell types in the lineages when the preparations were maintained in the presence or absence of clodronate. Values represent the mean ± SEM (n = 5 independent experiments); ∗p < 0.05, ANOVA with Tukey's multiple comparison test.
(D) Histograms depicting the level of expression of genes associated with the specification of the glutamatergic lineage (Atoh1, Neurod1, and Cntn2) and GABAergic lineage (Ptfa1 and Neurog1) after 20 h in the presence or absence of clodronate. Values represent the mean ± SEM (n = 3 independent experiments); ∗p < 0.05, ∗∗∗p < 0.001, ANOVA with Tukey's multiple comparison test.
(E) Cells undergoing neurogenic progression in the presence or absence of clodronate from a representative field of a live imaging experiment. Phase contrast images of time-lapse video microscopy showing the lineages obtained at different time points (day-h:min). Arrowheads indicate cells within the clone. Scale bar, 30 μm.
(F) The lineage trees traced in Control conditions in (E).
(G) The lineage trees traced in the presence of clodronate in (E).
(H) Cells surviving at the end of the experiment.
(I) Cells surviving within the lineage trees.
(J) Overall cell-cycle length of tracked cells.
(K) Cell-cycle length as a function of the round.
(L) Migratory behavior of the cells (H–L) for all conditions in the presence or absence of clodronate, respectively.
Values represent the mean ± SEM (n = 5 independent experiments), t test for (H, I, J, and L) and ANOVA followed by Tukeys post-test for (K).
The videos show the preparations depicted in Figure 7D. Note that the presence of clodronate induces more neurogenic lineages without provoking more rounds of amplifying divisions.
As described previously, the P5 cell preparations had a weaker neurogenic potential, mainly due to fewer GFAP/SOX2 NSCs in the culture. Moreover, as VNUT expression decreases after P0, we reasoned that the regulation of VNUT at P5 may have a weaker impact on these cultures. In P5 cell cultures we did not find significant differences in the number of clones, in the number of GFAP+/SOX2+ NSCs or in any other aspect previously analyzed at P0, irrespective of the presence or absence of clodronate (Figures S7A–S7K; Video S7). Therefore, the effect of VNUT on neurogenesis seems to be restricted to a limited time window when NSCs are isolated from the cerebellar niche.
The videos are of the preparation shown in Figure S11D. Note that the presence of clodronate does not induce significant differences in the behavior of the neurogenic lineages relative to the controls.
Discussion
Here, we describe an adapted cell culture that allows the behavior of neural progenitors from the PC to be examined in isolation from their niche. To our knowledge, this is the only preparation that allows single cells of all cell populations from the three neurogenic niches in the PC to be tracked together. Accordingly, we were able to monitor lineages generating glutamatergic neurons, the main population produced from the EGL (Alvarez Otero et al., 1993; Hallonet et al., 1990), as well as GABAergic interneurons, parenchymal astrocytes and oligodendrocytes, cell populations produced in the PWM (Leto et al., 2012; Parmigiani et al., 2015). In addition, astroglial progenitors have also been characterized by live imaging, a population known to be generated in the PCL (Buffo and Rossi, 2013). Significantly, we found that the neural progenitors in these cultures maintain their neurogenic potential, giving rise predominantly to neurons. Moreover, we were able to characterize their defining hallmarks in vitro.
Importantly, when isolated from their niche, progenitors generate glutamatergic/GABAergic neurons in a proportion that matches what happens in vivo, with 90% of all neurons produced belonging to the glutamatergic lineage (White and Sillitoe, 2013). In this regard, cells exhibiting neuronal-like morphology also showed functional properties characteristic of neurons. Moreover, two distinct cell morphologies were associated with distinct ICC labeling and to different patterns of ionic current responses to exogenous application of glutamate and GABA.
These facts are consistent with a considerable part of the lineage progression of cerebellar NSCs and progenitors being reproducible in the absence of their niche, as previously demonstrated for other neurogenic niches like the developing cerebral cortex (Temple, 1989) or the adult SEZ (Costa et al., 2011; Ortega et al., 2011).
Many studies have been set out to elucidate how cerebellar NSCs and progenitors achieve their lineage progression postnatally. However, the vast majority of these studies have focused only on individual neurogenic niches (EGL, PCL, PWM) and with the continued presence of extrinsic signals, such as SHH, BMP, or FGF, known to determine progenitor behavior (Leto et al., 2016; Nakashima et al., 2015; Okano-Uchida et al., 2004; Parmigiani et al., 2015; Yang et al., 2015). We believe that the data presented here may help shape the global concept of the cell-intrinsic program that leads to the generation of cerebellar populations. Indeed, we found that glutamatergic neurons are generated mainly by symmetric neurogenic divisions, with precursor cells undergoing a maximum of five rounds of amplifying divisions. This behavior is consistent with previous observations in vitro (Nakashima et al., 2015). In our cultures we were also able to describe the dynamics of interneuron progenitors. So, in the absence of the niche, neuronal progenitors can generate GABAergic interneurons by symmetric divisions, undergoing a maximum of two to three rounds of divisions. In addition, we monitored the production of parenchymal astrocytes, and that of oligodendrocyte-like cells, both populations being produced symmetrically after one or two rounds of division. Importantly, these three types of neural cells are those previously shown to be generated in the postnatal PWM (Leto et al., 2012).
The most interesting cell population that we have detected, is the one formed by GFAP+/SOX2+ NSCs. We believe that this cell population is capable of producing asymmetric lineages, with one branch of the tree giving rise to neurons while the other undergoes self-renewal to generate new GFAP/SOX2 cells. Moreover, this NSC population is present in the three neurogenic niches in vivo, especially around the PCL, already at P0, and it persists in adulthood. This population probably correlates with the previously described NSC population (Alcock et al., 2007; Alcock and Sottile, 2009), and it may explain the reports of astroglial cells that generate cerebellar granule neurons (Silbereis et al., 2010) and of GPCs that produce astroglial cells (Okano-Uchida et al., 2004). Indeed, we observed asymmetric divisions producing both glutamatergic neurons and GFAP+ cells. Likewise, GFAP/SOX2 population most likely represents the NSCs isolated as neurospheres from the whole cerebellum (Klein et al., 2005; Lee et al., 2005). Of note, although GFAP/SOX2 expression has also been reported in Bergmann glia (Mercurio et al., 2019), the capability to develop asymmetric lineage trees generating both neurons and new GFAP/SOX2 cells confirms the NSC nature of these cells.
The asymmetric behavior of this population of NSCs and its presence in the PWM may also be related to the bipotent progenitors described previously in this area (Fleming et al., 2013; Parmigiani et al., 2015). However, we did not observe asymmetric divisions that produced both GABAergic neurons and GFAP cells, although this could be due to the scarcity of the GFAP/SOX2 cells present in the PWM and/or the absence of a required extrinsic signal from the niche.
There are several lines of evidence to support the notion that this cell population represents bona fide cerebellar NSCs. First, they exhibit a radial morphology, and they express both astroglial (GFAP) and stem cell markers (SOX2 and NESTIN) (Kriegstein and Alvarez-Buylla, 2009). Second, they undergo asymmetric divisions that imply self-renewal, a stereotypic behavior of NSCs (Kriegstein and Alvarez-Buylla, 2009; Temple, 1989). Finally, when undergoing asymmetric divisions, NSCs exhibit greater cell growth before the first cell division, with the neurogenic branch becomes progressively smaller whereas the cells in the line that promotes self-renewal remaining larger. This behavior is a characteristic of NSCs in the adult murine SEZ and also in Drosophila (Costa et al., 2011; Neumuller et al., 2008; Ortega and Costa, 2016; Ortega et al., 2013b). Interestingly, the GFAP+/SOX2+ NSCs were notably smaller when the cells were prepared from the older cerebellum (P5). Moreover, this population remained stable throughout the live imaging, which given the absence of asymmetric divisions would suggest the acquisition of a quiescent behavior. Indeed, this population persists in vivo throughout murine life and it has been shown to induce neurogenesis in the adult cerebellar cortex (Ahlfeld et al., 2017). Altogether, these evidences suggest that at least part of the cerebellar NSC population may become quiescent, re-entering the cell cycle when required in adulthood, mimicking stem cells in the embryonic SVZ (Fuentealba et al., 2015; Furutachi et al., 2015).
In sum, we believe that the cell preparation we have used represents a useful tool to monitor how different extrinsic factors present in the distinct cerebellar neurogenic niches modulate the behavior of NSCs/progenitor cells. We tested this belief with regard to a key element of purinergic neurotransmission, namely VNUT (Miras-Portugal et al., 2019; Sawada et al., 2008). VNUT reached maximal expression within the developing cerebellum earlier that other vesicular neurotransmitter transporters (VGlut1), while co-localizing with the NSC population. This potentially allows the purinergic systems to fulfill a relevant role in the initial stages of cerebellar development and, in this respect, it is noteworthy that inhibiting VNUT affected the behavior of NSCs. VNUT inhibition decreased the size of the GFAP+/SOX2+ population, increasing the number of symmetric neurogenic lineage trees without promoting additional self-renewal. Moreover, the inhibition of VNUT resulted in an upregulation of genes involved in the differentiation of both cerebellar glutamatergic and GABAergic lineages (Leto et al., 2016). VNUT may thus influence the balance between quiescence/cell-cycle exit, as well as self-renewal of cerebellar NSCs. However, the mechanisms by which VNUT modulates this behavior remains yet unknown. A potential explanation may derive from the observed expression of VNUT in both exocytotic vesicles and lysosomes at PC (P0). We previously showed that VNUT actively participates in ATP storage and release from cerebellar granule neurons (Menendez-Mendez et al., 2017) and it has been described that purinergic transmitters modulate NSC lineage progression and quiescence (Song et al., 2012; Weissman et al., 2004). Likewise, lysosomal activity has been shown to modulate the balance between NSCs quiescence and activation during aging (Leeman et al., 2018). Thus, VNUT may act via modulation of purinergic neurotransmission and/or of lysosomal activity. Further research will certainly be needed to clarify this issue.
In summary, live imaging of isolated cells from PC provides a global model to study the molecular and cellular mechanisms governing generation of the different cerebellar cell populations in vitro. In fact, this model system allowed us to test how VNUT modulates these events.
Experimental Procedures
Ethics Statement
All animal procedures were carried out at the UCM in accordance with European and Spanish regulations (2010/63/EU; RD1201/2005; RD 53/2013), and following the guidelines of the International Council for the Laboratory Animal Science. The experimental protocols were approved by both the Committee for Animal Experimentation of UCM and the Regional Government of Madrid.
Cell Culture
Primary cultures of cerebellar neural progenitors were established using a modified version of the procedure described earlier (Pons et al., 2001; Costa et al., 2011; Ortega et al., 2011, 2013a). See Supplemental Information for details.
Time-Lapse Videomicroscopy and Single-Cell Tracking
Time-lapse videomicroscopy followed by single-cell tracking of isolated cerebellar neural progenitors was performed as described (Gomez-Villafuertes et al., 2017; Paniagua-Herranz et al., 2019). For technical details please see the Supplemental Information.
Western Blotting
Cerebellar tissue from different developmental stages (P0, P3, P7, P15, and adult) was processed as indicated in the Supplemental Information.
Immunocytochemistry and Immunohistochemistry
Cultured cells were fixed for 10 min in 4% paraformaldehyde and then washed three times with PBS. For ICC of the cerebellum, the brains were extracted and processed as described (Menendez-Mendez et al., 2017) For extended details see Supplemental Information.
Patch-Clamp Recordings
Patch-clamp recordings were performed in the whole-cell configuration of the patch-clamp technique with an EPC10 amplifier using PatchMaster software (HEKA Electronic, Lambrecht, Germany). Patch pipettes were pulled from borosilicate glass to have final resistances of 5.5–8.5 MΩ when filled with internal solutionmM: 145 mM KCl, 2 mM MgCl2, 0.3 mM EGTA, 0.3 mM GTP.Li3, 2 mM ATP.Na2, 10 mM HEPES (pH 7.2; ≈280 mOsm). Cells were maintained in a solution containing: 145 mM NaCl, 2.8 mM KCl, 2 mM CaCl2, 1 mM MgCl2, 10 mM HEPES, and 10 mM glucose (pH 7.4; ≈300 mOsm) that was constantly superfused at a rate of approximately 2 mL/min in the stage of a BX51W1 Olympus microscope. See the Supplemental Information for additional details.
RT-PCR and Quantitative Real-Time PCR
Total RNA was extracted, retrotranscribed, and amplified as described (Menendez-Mendez et al., 2015, 2017). See the Supplemental Information for additional details.
Statistical Analysis
The data are presented as the mean ± standard error of the mean (SEM) and each independent experiment shown was reproduced three to eight times. The statistical analyses were performed using GraphPad Prism 8 (GraphPad software), and an unpaired Student's t test or ANOVA followed by Dunnet's or Tukey's multiple comparisons tests were used to analyze the results. A p value ≤ 0.05 was considered statistically significant.
Author Contributions
F.O. and M.T.M.-P. designed the experiments. A.M.-M. and L.P.-H. performed most of the experiments, analyzed the data, and prepared the figures. L.A.O.-O., A.R.A., M.B., and R.G.-V. helped with the glutamatergic/GABAergic neuronal progeny identification and analysis. R.P.-S., J.G., and E.G.D. contributed to the ICC experiments. F.O. wrote the manuscript.
Acknowledgments
We thank Raúl Torres Guzmán for his expertise and art work. We thank Dr. Juan Ignacio Diaz-Hernandez and Dr Sergio Gascón for their assistance. We also thank Dr J. McCLane for his critical comments. This work was supported by grants (BFU2015-70067REDC), MEC (BFU2014-53654-P), BRADE-CM (S2013/ICE-2958), UCM-Santander (PR26/16-18B-3; PR75/18; PR65/19-22453), and Fundación Ramón Areces (PR2018/16-02). F.O. acknowledges support from the Ramón y Cajal Program (MEC: RYC-2013-13290).
Published: October 15, 2020
Footnotes
Supplemental Information can be found online at https://doi.org/10.1016/j.stemcr.2020.09.007.
Supplemental Information
References
- Ahlfeld J., Filser S., Schmidt F., Wefers A.K., Merk D.J., Glass R., Herms J., Schuller U. Neurogenesis from Sox2 expressing cells in the adult cerebellar cortex. Sci. Rep. 2017;7:6137. doi: 10.1038/s41598-017-06150-x. [DOI] [PMC free article] [PubMed] [Google Scholar]
- Alcock J., Scotting P., Sottile V. Bergmann glia as putative stem cells of the mature cerebellum. Med. Hypotheses. 2007;69:341–345. doi: 10.1016/j.mehy.2007.01.006. [DOI] [PubMed] [Google Scholar]
- Alcock J., Sottile V. Dynamic distribution and stem cell characteristics of Sox1-expressing cells in the cerebellar cortex. Cell Res. 2009;19:1324–1333. doi: 10.1038/cr.2009.119. [DOI] [PubMed] [Google Scholar]
- Alvarez Otero R., Sotelo C., Alvarado-Mallart R.M. Chick/quail chimeras with partial cerebellar grafts: an analysis of the origin and migration of cerebellar cells. J. Comp. Neurol. 1993;333:597–615. doi: 10.1002/cne.903330411. [DOI] [PubMed] [Google Scholar]
- Berg D.A., Belnoue L., Song H., Simon A. Neurotransmitter-mediated control of neurogenesis in the adult vertebrate brain. Development. 2013;140:2548–2561. doi: 10.1242/dev.088005. [DOI] [PMC free article] [PubMed] [Google Scholar]
- Buffo A., Rossi F. Origin, lineage and function of cerebellar glia. Prog. Neurobiol. 2013;109:42–63. doi: 10.1016/j.pneurobio.2013.08.001. [DOI] [PubMed] [Google Scholar]
- Costa M.R., Ortega F., Brill M.S., Beckervordersandforth R., Petrone C., Schroeder T., Gotz M., Berninger B. Continuous live imaging of adult neural stem cell division and lineage progression in vitro. Development. 2011;138:1057–1068. doi: 10.1242/dev.061663. [DOI] [PubMed] [Google Scholar]
- Fleming J.T., He W., Hao C., Ketova T., Pan F.C., Wright C.C., Litingtung Y., Chiang C. The Purkinje neuron acts as a central regulator of spatially and functionally distinct cerebellar precursors. Dev. Cell. 2013;27:278–292. doi: 10.1016/j.devcel.2013.10.008. [DOI] [PMC free article] [PubMed] [Google Scholar]
- Fuentealba L.C., Rompani S.B., Parraguez J.I., Obernier K., Romero R., Cepko C.L., Alvarez-Buylla A. Embryonic origin of postnatal neural stem cells. Cell. 2015;161:1644–1655. doi: 10.1016/j.cell.2015.05.041. [DOI] [PMC free article] [PubMed] [Google Scholar]
- Furutachi S., Miya H., Watanabe T., Kawai H., Yamasaki N., Harada Y., Imayoshi I., Nelson M., Nakayama K.I., Hirabayashi Y. Slowly dividing neural progenitors are an embryonic origin of adult neural stem cells. Nat. Neurosci. 2015;18:657–665. doi: 10.1038/nn.3989. [DOI] [PubMed] [Google Scholar]
- Gomez-Villafuertes R., Paniagua-Herranz L., Gascon S., de Agustin-Duran D., Ferreras M.O., Gil-Redondo J.C., Queipo M.J., Menendez-Mendez A., Perez-Sen R., Delicado E.G. Live imaging followed by single cell tracking to monitor cell biology and the lineage progression of multiple neural populations. J. Vis. Exp. 2017 doi: 10.3791/56291. [DOI] [PMC free article] [PubMed] [Google Scholar]
- Green M.J., Myat A.M., Emmenegger B.A., Wechsler-Reya R.J., Wilson L.J., Wingate R.J. Independently specified Atoh1 domains define novel developmental compartments in rhombomere 1. Development. 2014;141:389–398. doi: 10.1242/dev.099119. [DOI] [PMC free article] [PubMed] [Google Scholar]
- Hallonet M.E., Teillet M.A., Le Douarin N.M. A new approach to the development of the cerebellum provided by the quail-chick marker system. Development. 1990;108:19–31. doi: 10.1242/dev.108.1.19. [DOI] [PubMed] [Google Scholar]
- Hatten M.E., Heintz N. Mechanisms of neural patterning and specification in the developing cerebellum. Annu. Rev. Neurosci. 1995;18:385–408. doi: 10.1146/annurev.ne.18.030195.002125. [DOI] [PubMed] [Google Scholar]
- Klein C., Butt S.J., Machold R.P., Johnson J.E., Fishell G. Cerebellum- and forebrain-derived stem cells possess intrinsic regional character. Development. 2005;132:4497–4508. doi: 10.1242/dev.02037. [DOI] [PubMed] [Google Scholar]
- Kriegstein A., Alvarez-Buylla A. The glial nature of embryonic and adult neural stem cells. Annu. Rev. Neurosci. 2009;32:149–184. doi: 10.1146/annurev.neuro.051508.135600. [DOI] [PMC free article] [PubMed] [Google Scholar]
- Larsson M., Sawada K., Morland C., Hiasa M., Ormel L., Moriyama Y., Gundersen V. Functional and anatomical identification of a vesicular transporter mediating neuronal ATP release. Cereb. Cortex. 2012;22:1203–1214. doi: 10.1093/cercor/bhr203. [DOI] [PubMed] [Google Scholar]
- Lee A., Kessler J.D., Read T.A., Kaiser C., Corbeil D., Huttner W.B., Johnson J.E., Wechsler-Reya R.J. Isolation of neural stem cells from the postnatal cerebellum. Nat. Neurosci. 2005;8:723–729. doi: 10.1038/nn1473. [DOI] [PMC free article] [PubMed] [Google Scholar]
- Leeman D.S., Hebestreit K., Ruetz T., Webb A.E., McKay A., Pollina E.A., Dulken B.W., Zhao X., Yeo R.W., Ho T.T. Lysosome activation clears aggregates and enhances quiescent neural stem cell activation during aging. Science. 2018;359:1277–1283. doi: 10.1126/science.aag3048. [DOI] [PMC free article] [PubMed] [Google Scholar]
- Leto K., Arancillo M., Becker E.B., Buffo A., Chiang C., Ding B., Dobyns W.B., Dusart I., Haldipur P., Hatten M.E. Consensus paper: cerebellar development. Cerebellum. 2016;15:789–828. doi: 10.1007/s12311-015-0724-2. [DOI] [PMC free article] [PubMed] [Google Scholar]
- Leto K., Rolando C., Rossi F. The genesis of cerebellar GABAergic neurons: fate potential and specification mechanisms. Front. Neuroanat. 2012;6:6. doi: 10.3389/fnana.2012.00006. [DOI] [PMC free article] [PubMed] [Google Scholar]
- Menendez-Mendez A., Diaz-Hernandez J.I., Miras-Portugal M.T. The vesicular nucleotide transporter (VNUT) is involved in the extracellular ATP effect on neuronal differentiation. Purinergic Signal. 2015;11:239–249. doi: 10.1007/s11302-015-9449-4. [DOI] [PMC free article] [PubMed] [Google Scholar]
- Menendez-Mendez A., Diaz-Hernandez J.I., Ortega F., Gualix J., Gomez-Villafuertes R., Miras-Portugal M.T. Specific temporal distribution and subcellular localization of a functional vesicular nucleotide transporter (VNUT) in cerebellar granule neurons. Front. Pharmacol. 2017;8:951. doi: 10.3389/fphar.2017.00951. [DOI] [PMC free article] [PubMed] [Google Scholar]
- Mercurio S., Serra L., Nicolis S.K. More than just stem cells: functional roles of the transcription factor Sox2 in differentiated glia and neurons. Int. J. Mol. Sci. 2019;20:4540. doi: 10.3390/ijms20184540. [DOI] [PMC free article] [PubMed] [Google Scholar]
- Ming G.L., Song H. Adult neurogenesis in the mammalian brain: significant answers and significant questions. Neuron. 2011;70:687–702. doi: 10.1016/j.neuron.2011.05.001. [DOI] [PMC free article] [PubMed] [Google Scholar]
- Miras-Portugal M.T., Menendez-Mendez A., Gomez-Villafuertes R., Ortega F., Delicado E.G., Perez-Sen R., Gualix J. Physiopathological role of the vesicular nucleotide transporter (VNUT) in the central nervous system: relevance of the vesicular nucleotide release as a potential therapeutic target. Front. Cell Neurosci. 2019;13:224. doi: 10.3389/fncel.2019.00224. [DOI] [PMC free article] [PubMed] [Google Scholar]
- Moriyama Y., Nomura M. Clodronate: a vesicular ATP release blocker. Trends Pharmacol. Sci. 2018;39:13–23. doi: 10.1016/j.tips.2017.10.007. [DOI] [PubMed] [Google Scholar]
- Nakashima K., Umeshima H., Kengaku M. Cerebellar granule cells are predominantly generated by terminal symmetric divisions of granule cell precursors. Dev. Dyn. 2015;244:748–758. doi: 10.1002/dvdy.24276. [DOI] [PubMed] [Google Scholar]
- Neumuller R.A., Betschinger J., Fischer A., Bushati N., Poernbacher I., Mechtler K., Cohen S.M., Knoblich J.A. Mei-P26 regulates microRNAs and cell growth in the Drosophila ovarian stem cell lineage. Nature. 2008;454:241–245. doi: 10.1038/nature07014. [DOI] [PMC free article] [PubMed] [Google Scholar]
- Okano-Uchida T., Himi T., Komiya Y., Ishizaki Y. Cerebellar granule cell precursors can differentiate into astroglial cells. Proc. Natl. Acad. Sci. U S A. 2004;101:1211–1216. doi: 10.1073/pnas.0307972100. [DOI] [PMC free article] [PubMed] [Google Scholar]
- Oostland M., Sellmeijer J., van Hooft J.A. Transient expression of functional serotonin 5-HT3 receptors by glutamatergic granule cells in the early postnatal mouse cerebellum. J. Physiol. 2011;589:4837–4846. doi: 10.1113/jphysiol.2011.217307. [DOI] [PMC free article] [PubMed] [Google Scholar]
- Ortega F., Berninger B., Costa M.R. Primary culture and live imaging of adult neural stem cells and their progeny. Methods Mol. Biol. 2013;1052:1–11. doi: 10.1007/7651_2013_22. [DOI] [PubMed] [Google Scholar]
- Ortega F., Gascon S., Masserdotti G., Deshpande A., Simon C., Fischer J., Dimou L., Chichung Lie D., Schroeder T., Berninger B. Oligodendrogliogenic and neurogenic adult subependymal zone neural stem cells constitute distinct lineages and exhibit differential responsiveness to Wnt signalling. Nat. Cell Biol. 2013;15:602–613. doi: 10.1038/ncb2736. [DOI] [PubMed] [Google Scholar]
- Ortega F., Costa M.R. Live imaging of adult neural stem cells in rodents. Front. Neurosci. 2016;10:78. doi: 10.3389/fnins.2016.00078. [DOI] [PMC free article] [PubMed] [Google Scholar]
- Ortega F., Costa M.R., Simon-Ebert T., Schroeder T., Gotz M., Berninger B. Using an adherent cell culture of the mouse subependymal zone to study the behavior of adult neural stem cells on a single-cell level. Nat. Protoc. 2011;6:1847–1859. doi: 10.1038/nprot.2011.404. [DOI] [PubMed] [Google Scholar]
- Paniagua-Herranz L., Gomez-Villafuertes R., de Agustin-Duran D., Gascon S., Perez-Sen R., Delicado E.G., Miras-Portugal M.T., Ortega F. Time-lapse video microscopy and single cell tracking to study neural cell behavior in vitro. Methods Mol. Biol. 2019 doi: 10.1007/7651_2019_219. [DOI] [PubMed] [Google Scholar]
- Parmigiani E., Leto K., Rolando C., Figueres-Onate M., Lopez-Mascaraque L., Buffo A., Rossi F. Heterogeneity and bipotency of astroglial-like cerebellar progenitors along the interneuron and glial lineages. J. Neurosci. 2015;35:7388–7402. doi: 10.1523/JNEUROSCI.5255-14.2015. [DOI] [PMC free article] [PubMed] [Google Scholar]
- Pons S., Trejo J.L., Martinez-Morales J.R., Marti E. Vitronectin regulates Sonic hedgehog activity during cerebellum development through CREB phosphorylation. Development. 2001;128:1481–1492. doi: 10.1242/dev.128.9.1481. [DOI] [PubMed] [Google Scholar]
- Sawada K., Echigo N., Juge N., Miyaji T., Otsuka M., Omote H., Yamamoto A., Moriyama Y. Identification of a vesicular nucleotide transporter. Proc. Natl. Acad. Sci. U S A. 2008;105:5683–5686. doi: 10.1073/pnas.0800141105. [DOI] [PMC free article] [PubMed] [Google Scholar]
- Schroeder T. Imaging stem-cell-driven regeneration in mammals. Nature. 2008;453:345–351. doi: 10.1038/nature07043. [DOI] [PubMed] [Google Scholar]
- Shin Y.H., Lee S.J., Jung J. Secretion of ATP from Schwann cells through lysosomal exocytosis during Wallerian degeneration. Biochem. Biophys. Res. Commun. 2012;429:163–167. doi: 10.1016/j.bbrc.2012.10.121. [DOI] [PubMed] [Google Scholar]
- Silbereis J., Heintz T., Taylor M.M., Ganat Y., Ment L.R., Bordey A., Vaccarino F. Astroglial cells in the external granular layer are precursors of cerebellar granule neurons in neonates. Mol. Cell Neurosci. 2010;44:362–373. doi: 10.1016/j.mcn.2010.05.001. [DOI] [PMC free article] [PubMed] [Google Scholar]
- Solecki D.J., Liu X.L., Tomoda T., Fang Y., Hatten M.E. Activated Notch2 signaling inhibits differentiation of cerebellar granule neuron precursors by maintaining proliferation. Neuron. 2001;31:557–568. doi: 10.1016/s0896-6273(01)00395-6. [DOI] [PubMed] [Google Scholar]
- Song J., Zhong C., Bonaguidi M.A., Sun G.J., Hsu D., Gu Y., Meletis K., Huang Z.J., Ge S., Enikolopov G. Neuronal circuitry mechanism regulating adult quiescent neural stem-cell fate decision. Nature. 2012;489:150–154. doi: 10.1038/nature11306. [DOI] [PMC free article] [PubMed] [Google Scholar]
- Suh H., Deng W., Gage F.H. Signaling in adult neurogenesis. Annu. Rev. Cell Dev. Biol. 2009;25:253–275. doi: 10.1146/annurev.cellbio.042308.113256. [DOI] [PubMed] [Google Scholar]
- Temple S. Division and differentiation of isolated CNS blast cells in microculture. Nature. 1989;340:471–473. doi: 10.1038/340471a0. [DOI] [PubMed] [Google Scholar]
- Weissman T.A., Riquelme P.A., Ivic L., Flint A.C., Kriegstein A.R. Calcium waves propagate through radial glial cells and modulate proliferation in the developing neocortex. Neuron. 2004;43:647–661. doi: 10.1016/j.neuron.2004.08.015. [DOI] [PubMed] [Google Scholar]
- White J.J., Sillitoe R.V. Development of the cerebellum: from gene expression patterns to circuit maps. Wiley Interdiscip. Rev. Dev. Biol. 2013;2:149–164. doi: 10.1002/wdev.65. [DOI] [PubMed] [Google Scholar]
- Yang R., Wang M., Wang J., Huang X., Yang R., Gao W.Q. Cell division mode change mediates the regulation of cerebellar granule neurogenesis controlled by the sonic hedgehog signaling. Stem Cell Reports. 2015;5:816–828. doi: 10.1016/j.stemcr.2015.09.019. [DOI] [PMC free article] [PubMed] [Google Scholar]
- Zhao C., Deng W., Gage F.H. Mechanisms and functional implications of adult neurogenesis. Cell. 2008;132:645–660. doi: 10.1016/j.cell.2008.01.033. [DOI] [PubMed] [Google Scholar]
Associated Data
This section collects any data citations, data availability statements, or supplementary materials included in this article.
Supplementary Materials
The video shows the preparation depicted in Figure 1F. Note how the progenitors undergo highly synchronous symmetric divisions until they form post-mitotic neuroblasts, characterized by the appearance of cytoplasmic processes and labeling for the neuronal marker βIII-tubulin.
The video shows the preparation depicted in Figure 1G. Note that the founder cell gives rise to two branches after the first division. One generates neuroblasts after two more rounds of amplifying divisions (βIII-tubulin-positive cells), whereas the other gives rise to two cells labeled for GFAP and Sox2, indicative of a self-renewal event.
The video shows the preparation depicted in Figure 2F. Progenitors undergo highly synchronous symmetric divisions until they form post-mitotic neuroblasts characterized by the generation of cytoplasmic processes and labeling for the neuronal marker βIII-tubulin. Note that progenitors isolated at P5 are less capable of undergoing amplifying divisions.
The videos correspond to the preparation shown in Figure 3D. Note that despite the similar number of cells undergoing lineage progression toward neurogenesis, P0-derived cell lineages (Video 4) consistently undergo more rounds of division.
Upper panel: the video shows the preparation depicted in Figure 4A. Note how the progenitors undergo a maximum of five amplifying divisions before generating glutamatergic neurons identified by VGlut1 labeling. Lower panel: the video shows the preparation depicted in Figure 4C. Note how the progenitors undergo a maximum of three amplifying divisions before generating GABAergic neurons labeled for VGAT.
The videos show the preparations depicted in Figure 7D. Note that the presence of clodronate induces more neurogenic lineages without provoking more rounds of amplifying divisions.
The videos are of the preparation shown in Figure S11D. Note that the presence of clodronate does not induce significant differences in the behavior of the neurogenic lineages relative to the controls.