

Abstract
Background
Skeletal muscle wasting is often associated with insulin resistance. A major regulator of muscle mass is the transforming growth factor β (TGF‐β) superfamily, including activin A, which causes atrophy. TGF‐β superfamily ligands also negatively regulate insulin‐sensitive proteins, but whether this pathway contributes to insulin action remains to be determined.
Methods
To elucidate if TGF‐β superfamily ligands regulate insulin action, we used an adeno‐associated virus gene editing approach to overexpress an activin A inhibitor, follistatin (Fst288), in mouse muscle of lean and diet‐induced obese mice. We determined basal and insulin‐stimulated 2‐deoxy‐glucose uptake using isotopic tracers in vivo. Furthermore, to evaluate whether circulating Fst and activin A concentrations are associated with obesity, insulin resistance, and weight loss in humans, we analysed serum from morbidly obese subjects before, 1 week, and 1 year after Roux‐en‐Y gastric bypass (RYGB).
Results
Fst288 muscle overexpression markedly increased in vivo insulin‐stimulated (but not basal) glucose uptake (+75%, P < 0.05) and increased protein expression and intracellular insulin signalling of AKT, TBC1D4, PAK1, pyruvate dehydrogenase‐E1α, and p70S6K, while decreasing TBC1D1 signaling (P < 0.05). Fst288 increased both basal and insulin‐stimulated protein synthesis, but no correlation was observed between the Fst288‐driven hypertrophy and the increase in insulin‐stimulated glucose uptake. Importantly, Fst288 completely normalized muscle glucose uptake in insulin‐resistant diet‐induced obese mice. RYGB surgery doubled circulating Fst and reduced activin A (−24%, P < 0.05) concentration 1 week after surgery before any significant weight loss in morbidly obese normoglycemic patients, while major weight loss after 1 year did not further change the concentrations.
Conclusions
We here present evidence that Fst is a potent regulator of insulin action in muscle, and in addition to AKT and p70S6K, we identify TBC1D1, TBC1D4, pyruvate dehydrogenase‐E1α, and PAK1 as Fst targets. Circulating Fst more than doubled post‐RYGB surgery, a treatment that markedly improved insulin sensitivity, suggesting a role for Fst in regulating glycaemic control. These findings demonstrate the therapeutic potential of inhibiting TGF‐β superfamily ligands to improve insulin action and Fst's relevance to muscle wasting‐associated insulin‐resistant conditions in mice and humans.
Keywords: Muscle wasting, Follistatin, TGF‐β, Glucose uptake, Insulin resistance, Glycaemic control
Introduction
Skeletal muscle is essential for maintaining an independent lifestyle, and muscle strength is inversely associated with all‐cause mortality.1 Furthermore, skeletal muscle plays a critical role in glycaemic control as it accounts for up to 75% of insulin‐stimulated glucose disposal in humans.2 Several common conditions are associated with muscle wasting and/or insulin resistance, including cancer cachexia,3, 4 sarcopenia,5, 6 and type 2 diabetes.2, 7, 8 However, there are currently no effective therapeutic strategies to improve muscle wasting and function in such conditions. Restoration of muscle mass, strength, and insulin action could be highly effective in improving these debilitating conditions.
A major regulator of muscle mass is the transforming growth factor β (TGF‐β) superfamily, including activin A and myostatin, among which activin A is most relevant to humans.9 Activin A and myostatin bind to the activin type II receptor (ActRII) causing atrophy in skeletal muscle. Clinical trials show that blockade of ActRII using an ActRII antibody (bimagrumab) effectively prevents muscle wasting in sarcopenia,10 with marked improvements in insulin sensitivity and HbA1c in insulin‐resistant individuals.11 Thus, TGF‐β signalling might integrate muscle mass regulation and insulin action.
Follistatin (Fst) is an endogenously expressed inhibitor of activin A and myostatin. Fst binds to activin A and myostatin and thereby relieves activin A‐ or myostatin‐induced Smad3‐mediated suppression of AKT/mTOR signalling12 and thereby promotes skeletal muscle hypertrophy.13, 14, 15 Accordingly, Fst has emerged as a potential therapeutic to ameliorate the deleterious effects of muscle wasting16, 17, 18 but it remains to be tested whether the action of Fst involves increased muscular insulin action.
Circumstantial evidence suggests that, in addition to treating muscle wasting,16, 17, 18 targeting Fst could indeed be a novel approach to improve insulin sensitivity in muscle. Recent proteomic profiling has shown that Fst regulates PAK119 that is a downstream target of Rac1. Rac1 regulates insulin‐stimulated translocation of the glucose transporter, GLUT4,20, 21 and this pathway is compromised in muscles from obese and type 2 diabetic patients.22 Furthermore, Fst increases signalling through the AKT/mTOR pathway in unstimulated mouse muscle,12 likely due to up‐regulation of Akt and mTOR protein expression.17 Thus, Fst affects insulin‐regulated proteins but it is unknown if this translates into increased insulin‐stimulated intracellular signalling and glucose uptake and whether Fst could be a target to ameliorate muscle wasting‐associated insulin resistance.
Inspired by these findings, we hypothesized that Fst could be a central regulator of muscular insulin sensitivity in addition to its known effects on muscle mass. We confirmed this hypothesis by showing that Fst overexpression markedly increased insulin sensitivity and completely normalized insulin‐stimulated glucose uptake in insulin‐resistant mouse muscle. Furthermore, Roux‐en‐Y gastric bypass (RYGB), a treatment that rapidly and markedly improves insulin sensitivity and glycaemic regulation, increased circulating Fst together with a decrease in the ActRII ligand activin A. These findings demonstrate the therapeutic potential of Fst and of inhibiting TGF‐β superfamily ligands and highlight the relevance of this pathway to insulin resistance in humans.
Methods
Animals
Female C57BL/6J (Taconic, Lille Skensved, Denmark) mice age 20–22 weeks were maintained on a 12 h:12 h light–dark cycle and group housed at 21–23°C with nesting materials. A 10 week diet intervention was started at 12 weeks of age, and mice received either a standard rodent chow diet (Altromin no. 1324; Brogaarden, Hørsholm, Denmark) or a 60E% high‐fat diet (HFD; Research Diets no. D12492; Brogaarden, Hørsholm, Denmark) and water ad libitum. Body weight was assessed biweekly. All experiments were approved by the Danish Animal Experimental Inspectorate. The animal experiments followed the European convention for protection of vertebrate animals used for experiments and other scientific purposes.
Production of rAAV6 vectors
Generation of cDNA constructs encoding the short isoform of human Fst, known as Fst288, and subcloning into an adeno‐associated (AAV) expression plasmid consisting of a cytomegalovirus (CMV) promoter/enhancer and SV40 poly‐A region flanked by AAV2 terminal repeats (pAAV2) has been described previously.12 Co‐transfection of HEK293T cells with the above‐mentioned pAAV2 and the pDGM6 packaging plasmid generated type‐6 pseudotyped viral vectors that were harvested and purified as described previously23 and are herein referred to as rAAV6:Fst288. As a control, a non‐coding vector was also generated (rAAV6:MCS). In short, HEK293T cells were plated at a density of 3.2–3.8 × 10⁶ cells onto a 15 cm culture dish 8–16 h before transfection with 10 μg of a vector genome‐containing plasmid and 20 μg of the packaging/helper plasmid pDGM6, by means of the calcium phosphate precipitate method to generate pseudotype 6 vectors; 72 h after transfection, the media and cells were collected and homogenized through a microfluidizer (Microfluidics) before 0.22 μm clarification (Millipore). The vector was purified from the clarified lysate by affinity chromatography over a HiTrap heparin column (GE Healthcare) and ultracentrifuged overnight before resuspension in sterile physiological Ringer's solution. The purified vector preparations were titred with a customized sequence‐specific quantitative PCR‐based reaction (Applied Biosystems).12
Transfection of mouse muscles using rAAV6 vectors
Viral particles were diluted in Gelofusine (B. Braun, Germany) [Tibialis anterior (TA): 30 μL, Gastrocnemius: 50 μL] to a dosage of 1 × 10⁹ vector genomes for both muscles. For muscle‐specific delivery of rAAV6 vectors, 18‐ to 20‐week‐old mice were placed under general anaesthesia (2% isofluorane in O2) and mice were injected intramuscularly with rAAV6:Fst288 in the muscles of one leg and control rAAV6:MCS (empty vector) in the contralateral leg. Mice were terminated 2 weeks after rAAV6 administration.
Body composition analysis
For the HFD study, fat mass and lean body mass changes were determined by quantitative magnetic resonance using an Echo MRI scanner (EchoMRI‐4in1TM, Echo Medical System LLC, Texas, USA) at baseline and week 9 into the diet intervention.
In vivo 2‐deoxy‐glucose experiments
To determine 2‐deoxy‐glucose (2DG) uptake in muscle, [3H]2DG (Perkin Elmer) was injected retro‐orbitally in a bolus of saline containing 66.7 μCi mL−1 [3H]2DG (6 μL g−1 body weight) in chow and HFD‐fed mice. The injectate also contained 0.3 U kg−1 body weight insulin (Actrapid; Novo Nordisk, Bagsværd, Denmark) or a comparable volume of saline. Prior to stimulation, mice were fasted for 3–5 h from 07:00 h and anaesthetized [intraperitoneal injection of 7.5/9 mg (chow/HFD) pentobarbital sodium 100 g−1 body weight 15 min before the retro‐orbital injection]. Blood samples were collected from the tail vein immediately prior to insulin or saline injection and after 5 and 10 min and analysed for glucose concentration using a glucometer (Bayer Contour; Bayer, Münchenbuchsee, Switzerland). After 10 min, TA and gastrocnemius muscles were excised and quickly frozen in liquid nitrogen and stored at −80°C until processing. Once tissues were removed, blood was collected by punctuation of the heart, centrifuged, and plasma frozen at −80°C. Plasma samples were analysed for insulin concentration and specific [3H]2DG tracer activity. Plasma insulin was analysed in duplicate (Mouse Ultrasensitive Insulin ELISA, #80‐INSTRU‐E10, ALPCO Diagnostics, USA). Tissue‐specific 2DG uptake was analysed as described in previous studies.24, 25, 26
Glycogen content
Muscle glycogen content in TA muscle was determined as glycosyl units after acid hydrolysis as previously described.27
Cell cultures and estimation of protein synthesis in vitro
L6 muscle cells stably overexpressing c‐myc epitope‐tagged GLUT4 (L6‐GLUT4myc), a kind gift from Amira Klip, were grown in α‐MEM medium (Gibco #22571‐020) with 10% foetal bovine serum (Sigma‐Aldrich #F0804), 100 units mL−1 penicillin, 100 μg mL−1, and 0.25 μg mL−1 Gibco Amphotericin B (Gibco #15240‐062) (5% CO2, 37°C). Cells were seeded in 12‐well plates and differentiated into multinucleated myotubes in α‐MEM media with 2% foetal bovine serum, 100 units mL−1 penicillin, 100 μg mL−1, and 0.25 μg mL−1 Gibco Amphotericin B. AAV‐containing medium was added to day 2 myotubes and consisted of 5 × 10¹⁰ vector genomes of rAAV6:Fst288 per mL differentiation medium or rAAV6:MCS as a control. Protein synthesis in L6‐GLUT4myc cells was analysed in day 7 myotubes and measured using the non‐isotopic Surface Sensing of Translation (SUnSET) technique.28 For estimation of protein synthesis, cells were serum starved for 4 h and incubated with 1 μM puromycin (Gibco #A11138‐03) with or without 10 nM insulin (submaximal dose; Actrapid; Novo Nordisk, Bagsværd, Denmark) for 60 min. Immediately following stimulation, cells were chilled on ice, washed in PBS (Gibco #14190‐094), and lysed in ice‐cold RIPA buffer (Sigma‐Aldrich #R0278) supplemented with 20 mM β‐glycerophosphate, 10 mM NaF, 2 mM phenylmethylsulfonyl fluoride (PMSF), 2 mM Na3VO4, 10 μg mL−1 leupeptin, 10 μg mL−1 aprotinin, and 3 mM benzamidine. Supernatants were collected by centrifugation (8792 g) for 10 min at 4°C. Each experiment was assayed in duplicates or quadruplicates and repeated three times. Puromycin levels were determined as described for immunoblotting.
Human serum follistatin and activin A analysis
Fasting blood samples were obtained from nine obese glucose‐tolerant subjects (3 men and 6 women) age 40.1 ± 2.8 years, (body weight 116.9 ± 4.9 kg) scheduled for laparoscopic RYGB at Hvidovre Hospital (Denmark) after a mandatory diet‐induced weight loss of minimum 8% (weight loss was 9.2 ± 1.2%) pre‐surgery and at 1 week and 1 year post‐surgery. Detailed description of the study design and subject characteristics has been reported elsewhere.29 For the present study, we used samples from the nine glucose‐tolerant patients that completed the 1 year study visit. Serum was stored at −80°C and Fst and activin A analysed in duplicates using DFN00 and DAC00B ELISA kits, respectively, from R&D Systems performed according to manufacturer's instructions. Clinical experiments were approved by the Ethics Committee of Copenhagen and complied with the ethical guidelines of the Declaration of Helsinki II 2000. Written informed consent was obtained from all participants prior to entering the study. The clinical study is registered at www.ClinicalTrials.gov (NCT01202526).
Muscle tissue processing
Mouse muscles were pulverized in liquid nitrogen and homogenized 2 × 0.5 min at 30 Hz using a TissueLyser II bead mill (Qiagen, USA) in ice‐cold homogenization buffer [10% glycerol, 1% NP‐40, 20 mM sodium pyrophosphate, 150 mM NaCl, 50 mM HEPES (pH 7.5), 20 mM β‐glycerophosphate, 10 mM NaF, 2 mM PMSF, 1 mM EDTA (pH 8.0), 1 mM EGTA (pH 8.0), 2 mM Na3VO4, 10 μg mL−1 leupeptin, 10 μg mL−1 aprotinin, and 3 mM benzamidine]. After rotation end‐over‐end for 30 min at 4°C, supernatants were collected by centrifugation (10 854 g) for 20 min at 4°C.
Immunoblotting
Lysate protein concentrations were measured using the bicinchoninic acid method with bovine serum albumin as standard (Pierce). Total protein and phosphorylation levels of relevant proteins were determined by standard immunoblotting techniques loading equal amounts of protein. The primary antibodies used are presented in Table 1. Protein levels of the pyruvate dehydrogenase (PDH)‐E1α subunit, PDH‐E1α phosphorylation at Ser293 and Ser300, and protein levels of PDH kinase 4 (PDK4) were determined using antibodies, as previously described,30, 31 all kindly provided by D. Grahame Hardie. Polyvinylidene difluoride membranes (Immobilon Transfer Membrane; Millipore) were blocked in Tris‐buffered saline‐Tween 20 containing 3% milk or 5% bovine serum albumin protein for 30–60 min at room temperature. Membranes were incubated with primary antibodies overnight at 4°C, followed by incubation with horseradish peroxidase‐conjugated secondary antibody for 30 min at room temperature. Coomassie brilliant blue staining was used as a loading control.32 Bands were visualized using the Bio‐Rad ChemiDoc MP Imaging System and enhanced chemiluminescence (ECL+; Amersham Biosciences).
Table 1.
Antibody table
| Antibody name | Antibody dilution | Catalog number | Manufacturer/donator |
|---|---|---|---|
| Follistatin | 1:100 (in 5% BSA) | #sc‐365003 | Santa Cruz Biotechnology |
| AKT2 | 1:1000 (in 3% milk) | #3063 | Cell Signaling Technology |
| Phosphorylated (p)‐AKTThr308 | 1:1000 (in 3% milk) | #9275 | Cell Signaling Technology |
| p‐AKTSer473 | 1:1000 (in 3% milk) | #9271 | Cell Signaling Technology |
| p70S6K | 1:1000 (in 3% milk) | #9202 | Cell Signaling Technology |
| p‐p70S6KThr389 | 1:1000 (in 3% milk) | #9205 | Cell Signaling Technology |
| TBC1D4 | 1:1500 (in 5% BSA) | #ab189890 | Abcam |
| p‐TBC1D4Thr642 | 1:1000 (in 5% BSA) | #D27E6 | Cell Signaling Technology |
| TBC1D1 | 1:1000 (in 5% BSA) | #5929 | Cell Signaling Technology |
| p‐TBC1D1T596 | 1:1000 (in 2% milk) | #6927 | Cell Signaling Technology |
| PAK1 | 1:1000 (in 5% BSA) | #2602 | Cell Signaling Technology |
| p‐PAK1/2Thr423/402 | 1:1000 (in 5% BSA) | #2601 | Cell Signaling Technology |
| GLUT4 | 1:1000 (in 3% milk) | #PA1‐1065 | Thermo Fisher Scientific |
| Hexokinase II | 1:1000 (in 3% milk) | #2867 | Cell Signaling Technology |
| IRS1 | 1 μg/mL (in 2% milk) | #06‐248 | Upstate Biotechnology |
| OXPHOS | 1:1000 (in 3% milk) | #MS604‐300 | Abcam |
| PDH‐E1α | 1 μg/mL (in 2% milk) | CDPG | D.G. Hardie (University of Dundee, Scotland) |
| p‐PDH‐E1αSer293 (site 1) | 1 μg/mL (in 2% milk) | D.G. Hardie (University of Dundee, Scotland) | |
| p‐PDH‐E1αSer300 (site 2) | 1 μg/mL (in 2% milk) | D.G. Hardie (University of Dundee, Scotland) | |
| PDK4 | 0.25 μg/mL (in 2% milk) | D.G. Hardie (University of Dundee, Scotland) | |
| p‐AMPKThr172 | 1:1000 (in 3% milk) | #2531 | Cell Signaling Technology |
| Puromycin | 1:5000 (in 3% milk) | #MABE343 | EMD Millipore |
Statistical analyses
Data are shown as mean ± standard error of the mean (SEM) with the individual values shown when applicable. For figures with a paired design (rAAV6:MCS vs. rAAV6:Fst288 treated legs within the same mouse), paired values are connected with a line. Statistical testing was performed using unpaired t‐test, paired t‐test, and two‐way (repeated measures when appropriate) analysis of variance as applicable. Sidak post hoc test was performed for multiple comparisons when analysis of variance revealed significant main effects or interactions. Pearson's correlation was used to test the relationship between the change in muscle weight and insulin‐stimulated glucose uptake with Fst288 overexpression. Statistical analyses were performed using GraphPad Prism, version 7 (GraphPad Software, La Jolla, CA, USA). The significance level was set at α = 0.05.
Results
Insulin‐stimulated glucose uptake is increased in Fst288 overexpression‐induced hypertrophic muscles
Mice were injected with rAAV6:Fst288 into the muscles of one leg while the contralateral muscles were injected with an empty viral vector, rAAV6:MCS (Figure 1A). Two weeks after the injection, Fst protein expression was markedly increased compared with the control muscle in TA and gastrocnemius muscles injected with rAAV6:Fst288 (Figure 1B). Fst288 delivery increased TA muscle mass by 33% on average compared with the control muscle (Figure 1C). This was similar to previous reports.12 Mice (one Fst288 treated leg and one control leg) were stimulated with an insulin dose of 0.3 U kg−1 as described in Raun et al.,26 which lowered blood glucose concentration by 3 mM at the 10 min time point compared with saline‐injected mice (Figure 1D). Fst288 overexpression resulted in almost a doubling of insulin‐stimulated glucose uptake in TA compared with the control muscle (Figure 1E). Similarly, in gastrocnemius muscle, insulin‐stimulated glucose uptake was 72% higher in rAAV6:Fst288‐treated muscles compared with the contralateral rAAV6:MCS‐treated control 2 weeks after rAAV administration (Figure 1F). Basal (saline injected) glucose uptake was not affected by rAAV6:Fst288. Interestingly, we observed no correlation between the change in muscle mass and insulin‐stimulated glucose uptake with Fst288 overexpression in muscle (Figure 1G), suggesting that Fst288 overexpression per se, rather than the hypertrophy magnitude, drives the increased insulin‐stimulated glucose uptake. To investigate the direct effect of Fst288 overexpression on the anabolic response to insulin in muscle, insulin‐stimulated puromycin incorporation into L6 myotubes was analysed. It was found that both basal and insulin‐stimulated puromycin incorporation were increased (basal: +40%; insulin: +33%) (Figure 1H), suggesting that Fst288 led to a general increase in protein synthesis.
Figure 1.
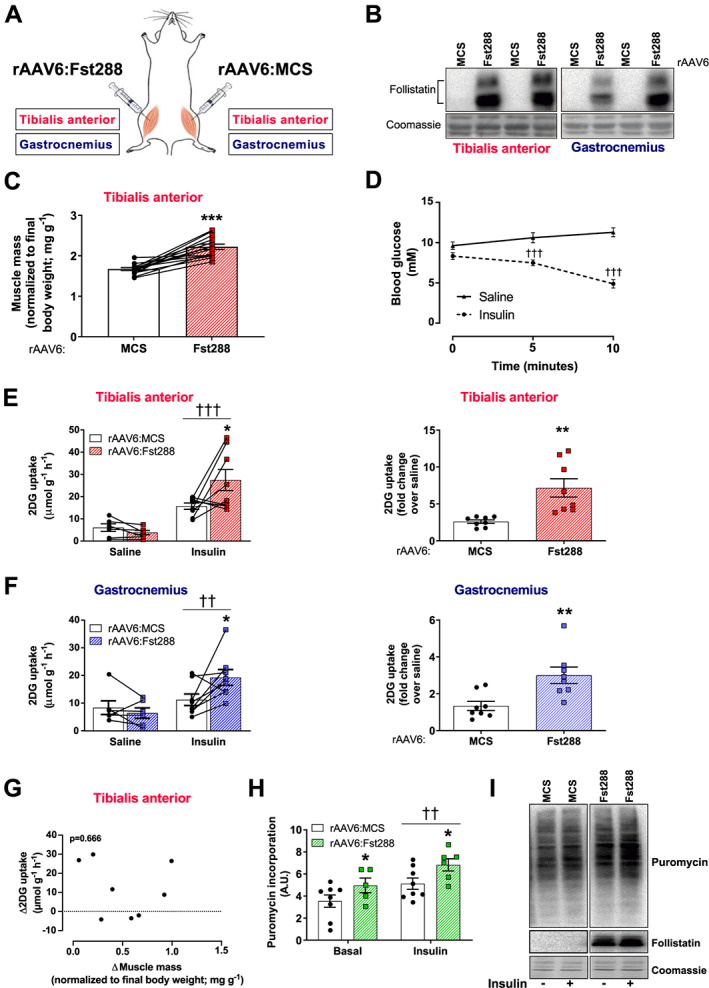
Effect of follistatin (Fst288) overexpression on muscle glucose uptake. (A) Illustration of experimental set‐up: recombinant adeno‐associated virus encoding Fst288 (rAAV6:Fst288) was injected into tibialis anterior and gastrocnemius muscles of one leg, while the contralateral muscles were injected with rAAV6:MSC as a control. (B) Representative blot of follistatin in muscle. (C) Muscle mass of tibialis anterior (n = 14). (D) Blood glucose levels measured before (0 min) and 5 and 10 min following retro‐orbital insulin (0.3 U kg−1 body weight) or saline injection 2 weeks after rAAV6:Fst288 administration in mice (n = 6–8). Basal and insulin‐stimulated 2‐deoxy‐glucose (2DG) uptake and fold change (over saline) in (E) tibialis anterior and (F) gastrocnemius muscles from mice 2 weeks after intramuscular rAAV6:Fst288 administration (n = 6–8). (G) Correlation between the change in muscle mass and insulin‐stimulated glucose uptake in tibialis anterior muscle 2 weeks after rAAV6:Fst288 administration (n = 8). (H) Insulin‐stimulated (10 nM, 60 min) puromycin incorporation in L6‐GLUT4myc myotubes following rAAV6:Fst288 administration or as a control rAAV6:MCS. Each experiment was assayed in duplicates or quadruplicates and repeated three times (one sample was excluded due to poor quality of the cells in the well). (I) Representative blots of puromycin and follistatin in L6‐GLUTmyc myotubes with or without insulin stimulation following rAAV6:administration. Effect of insulin stimulation is indicated by ††/††† P < 0.01/0.001. Statistically significant effect of Fst288 overexpression is indicated by */**/*** P < 0.05/0.01/0.001. Data are shown mean ± SEM with individual values shown when applicable.
Fst288 overexpression augments insulin‐stimulated AKT and PAK1 signalling in muscle
As insulin‐stimulated, but not basal, glucose uptake was markedly increased independently of the hypertrophy magnitude, we next sought to determine the molecular explanation for this and used immunoblotting techniques to analyse intracellular insulin signalling as illustrated in Figure 2A. Overexpression of Fst288 significantly up‐regulated insulin‐stimulated p‐AKTThr308 (+120%) in TA, but not in gastrocnemius muscles (Figure 2B). This was also the case for the mTORC2 site, p‐AKTSer473 (TA: +50%, Figure 2C).33 The AKT signalling pathway bifurcates into TBC1D4, important for glucose uptake, and mTORC1, crucial for muscle mass regulation. In line with increased p‐AKT in TA, we observed a 68% increase in insulin‐stimulated p‐TBC1D4Thr642 with Fst288 overexpression compared with rAAV6:MCS (Figure 2D). Like p‐AKT, insulin‐stimulated TBC1D4Thr642 was not significantly increased in gastrocnemius with Fst288 overexpression. TBC1D1, a protein with 90% homology to TBC1D4,34 is in muscle phosphorylated at site Thr596 in response to insulin and this is likely downstream of Akt.35, 36, 37 However, surprisingly, Fst288 overexpression lowered both basal and insulin‐stimulated p‐TBC1D1T596 in TA (basal: −44%; insulin: −41%) and gastrocnemius muscle (basal: −43%; insulin: −39%) (Figure 2E). Fst288 overexpression resulted in a remarkable increase (+400%) in insulin‐stimulated (but not basal) p‐p70S6KThr389 (Figure 2F), an endogenous substrate of mTORC1, suggesting that Fst288 overexpression increases anabolic insulin action in mature skeletal muscle. A less described, but likely equally important signalling pathway for insulin action, is the Rac1‐mediated pathway. Rac1's downstream target, PAK1, has been identified by proteomic muscle profiling to be a putative target for Fst,19, 38 although actual activation through this pathway has not been investigated. Indeed, insulin‐stimulated phosphorylation of PAK1 at its activation site Thr423 was up‐regulated by rAAV6:Fst288 (TA: +56%, gastrocnemius: +29%) compared with rAAV6:MCS control (Figure 2G). Thus, Fst288 augments signalling in skeletal muscle to increase both glucose uptake and muscle mass in response to insulin. Except for p‐TBC1D1Thr596, no effect of Fst288 was observed on any of the analysed signalling proteins during saline treatment, suggesting that the molecular modifications in this signalling pathway in response to Fst depend on the stimulation with insulin.
Figure 2.
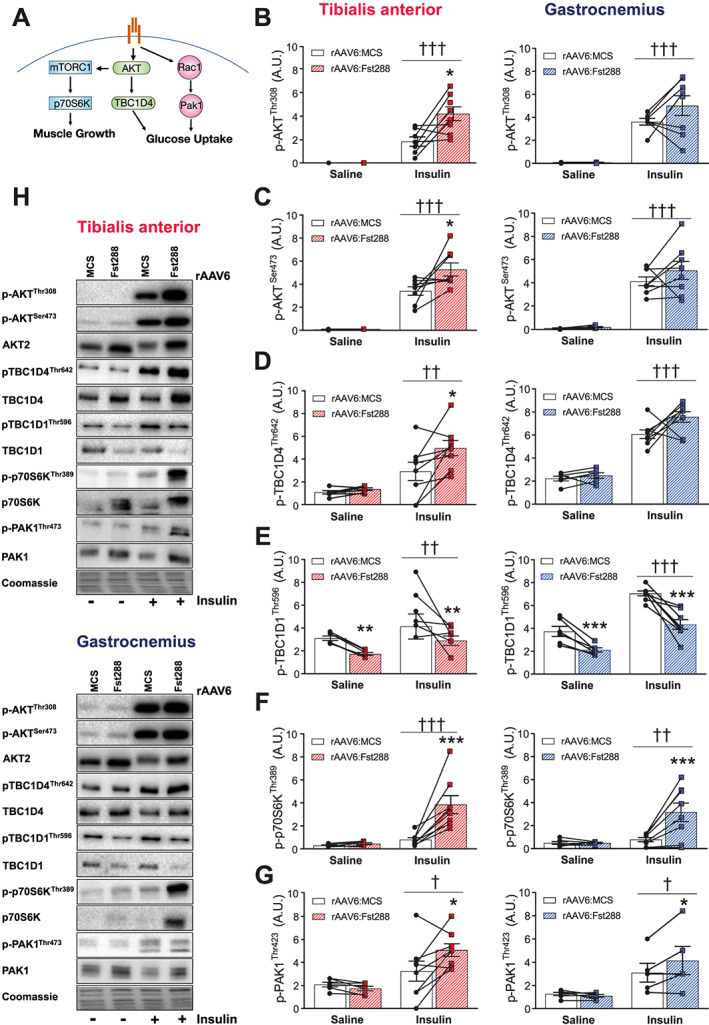
Insulin‐stimulated intracellular signalling in skeletal muscle following rAAV6:Fst288 administration. (A) Graphic illustration of the signalling pathways analysed. Basal and insulin‐stimulated phosphorylated (B) (p‐)AKTThr308, (C) p‐AKTSer473, (D) p‐TBC1D4Thr642, (E) p‐TBC1D1Thr596, (F) p‐p70S6KThr389, and (G) p‐PAK1Thr423 in tibialis anterior and gastrocnemius muscles following 2 week rAAV6:Fst288 overexpression in muscle (n = 5–8, one to two mouse sample excluded due to poor quality blot). (H) Representative blots. Main effect of insulin stimulation is indicated by †/††/††† P < 0.05/0.01/0.001. Statistically significant effect of Fst288 overexpression is indicated by */**/*** P < 0/0.05/0.01/0.001. Data are shown as mean ± SEM with individual values.
Fst288 overexpression increases muscle content of key insulin sensitive signalling proteins but does not affect content of proteins involved in glucose handling
We next sought to investigate whether the increase in insulin sensitivity could be due to an increased capacity of the muscles to enhance insulin‐mediated molecular signals. We therefore analysed the total content of proteins involved in insulin signal transduction and glucose handling. As expected, we observed no difference on protein expression between the 10 min saline or insulin‐stimulated conditions (see representative blots Figure 3), and thus, they were pooled to increase statistical power and accuracy of effect‐size estimation. In TA muscle, we found a marked up‐regulation of AKT2 by rAAV6:Fst288 (+90%, Figure 3A) and TBC1D4 (+60%, Figure 3B). In contrast, TBC1D1 was down‐regulated to half of the rAAV6:MCS‐treated control muscles (Figure 3C). Similar to AKT2 and TBC1D4, total p70S6K protein tripled (Figure 3D), and PAK1 protein was doubled (Figure 3E). Because the levels of AKT2, TBC1D4, and p70S6K increased, the ratio of p‐protein/total protein was similar for rAAV6:Fst288‐administered and rAAV6:MCS‐administered muscles (Supporting Information, Figure S1), suggesting that Fst288 overexpression increased protein expression and activity in the insulin signalling pathway to a similar extent. In contrast, the ratio of p‐protein/total protein was decreased for PAK1 with Fst288 (Supporting Information, Figure S1). Due to the reduced protein expression, no effect of Fst288 was observed when relating p‐TBC1D1Thr596 to the total protein content (Supporting Information, Figure S1). In addition to the above‐mentioned proteins involved in insulin signal transduction, insulin receptor substrate 1 was also up‐regulated (+33%) in response to Fst288 overexpression (Figure 3F). In contrast, protein content of the glucose handling machinery, for example, GLUT4 (glucose transporter) and hexokinase (a proposed rate‐limiting enzyme to in vivo glucose uptake in skeletal muscle39), was not regulated by Fst288 (Figure 3G+H). We also analysed complexes of the electron transport chain and found that all the investigated complexes were unaffected by Fst288 (Figure 3I). We found no effect of Fst288 on the phosphorylated levels of the cell stress sensor AMP‐activated protein kinase (Supporting Information, Figure S1), suggesting that Fst did not alter intracellular metabolic stress. We observed similar regulation of proteins in gastrocnemius muscle (data not shown), except for the ratio of p‐protein/total protein for p‐AKTSer473 that was significantly decreased with Fst288 (Supporting Information, Figure S1). These findings show that Fst288 alters the expression of key insulin sensitive proteins but does not regulate proteins directly involved in glucose handling.
Figure 3.
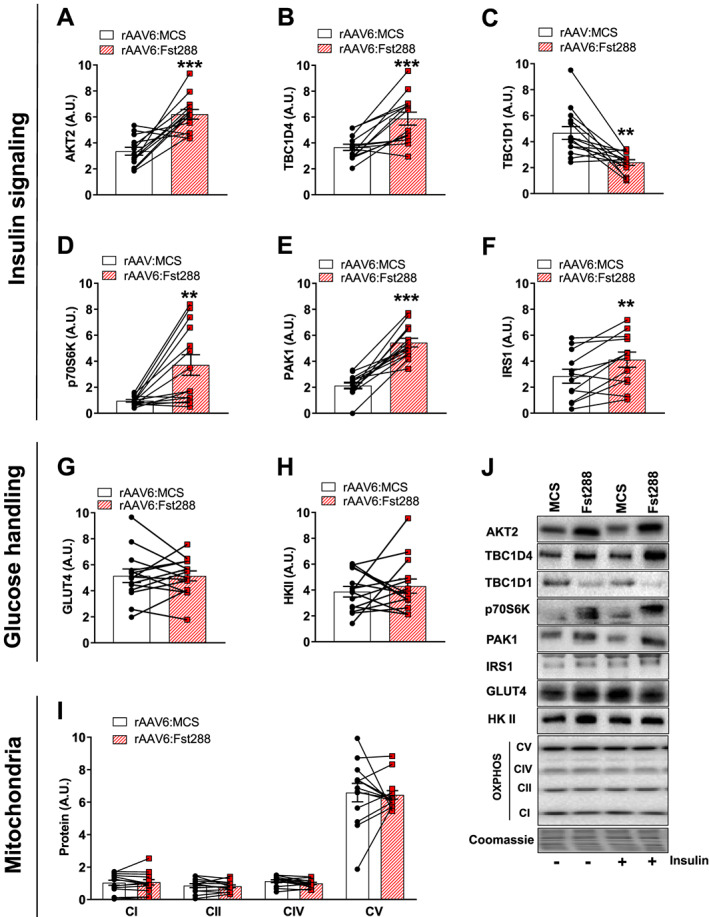
Effect of Fst288 overexpression on proteins involved in insulin signalling and glucose handling. Protein expression of (A) AKT2, (B) TBC1D4, (C) TBC1D1, (D) p70S6K, (E) PAK1, (F) IRS1, (G) GLUT4, (H) HKII, and (I) complexes of the electron transport chain in tibialis anterior muscle following 2 week rAAV6:Fst288 overexpression in muscle. No difference was observed in protein expression between the 10 min saline and insulin‐stimulated conditions, and thus, samples were pooled to increase statistical power and accuracy of effect‐size estimation (n = 12–14, one to two mouse samples excluded due to poor quality blot). (J) Representative blots. Statistically significant effect of Fst288 overexpression is indicated by **/*** P < 0.01/0.001. Data are shown as mean ± SEM with individual values.
Fst288 overexpression increases muscle content and activity of pyruvate dehydrogenase‐E1α in gastrocnemius muscle
Having found that Fst288 overexpression increased glucose uptake in muscle, we next asked what the metabolic fate of the extra glucose taken up was. The PDH complex catalyses the irreversible conversion of pyruvate to acetyl CoA, and phosphorylation of site 1, p‐PDH‐E1αS293 (basal: −13%; insulin: −20%, Figure 4A), and site 2, p‐PDK‐E1αS300 (basal: −23%; insulin: −42%, Figure 4B), was down‐regulated by Fst288 in gastrocnemius but not TA muscle, suggesting increased activity of the PDH complex.40 The level of the PDH‐E1α subunit was unaffected by Fst288 in TA muscle but decreased (−13%) in gastrocnemius (Figure 4C). Therefore, p‐protein/total protein was similar for rAAV6:Fst288 and rAAV6:MCS administered muscles for site 1 and only slightly down‐regulated for site 2 (basal: −11%; insulin: −36%, Supporting Information, Figure S2). Levels of PDK4, a protein that phosphorylates and inactivates PDH,40, 41, 42 were unchanged in both TA and gastrocnemius muscle in response to Fst288 overexpression (Figure 4D). Together, these findings suggest that Fst288 increased the capacity for glycolysis‐driven mitochondrial glucose oxidation in gastrocnemius muscle, thereby increasing the reliance on carbohydrate metabolism.
Figure 4.
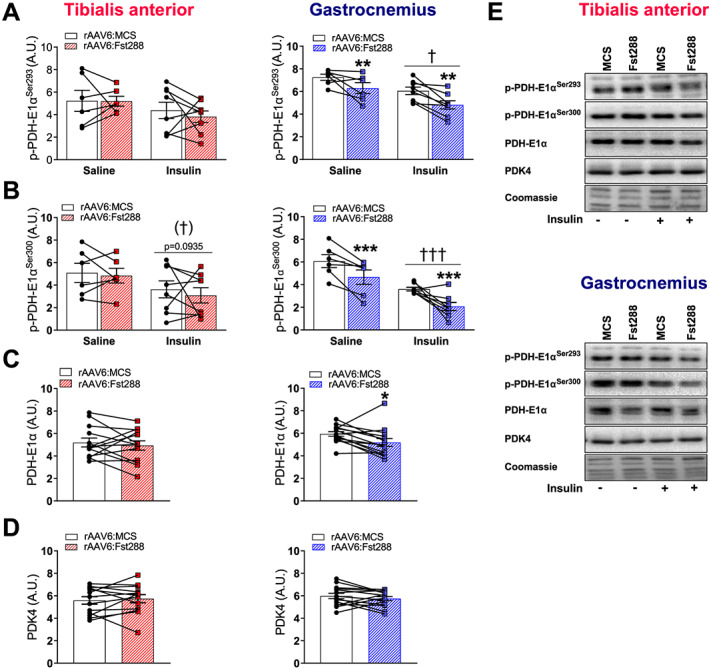
Effect of Fst288 overexpression on PDH activity. Basal and insulin‐stimulated phosphorylated (A) (p‐)PDH‐E1αSer293 and (B) p‐PDH‐E1αSer300 in tibialis anterior and gastrocnemius muscles following 2 week rAAV6:Fst288 overexpression in muscle (n = 6–8). Protein expression of (C) PDH‐E1α and (D) PDK4 in tibialis anterior and gastrocnemius muscle. No difference was observed in protein expression between the 10 min saline or insulin‐stimulated conditions, and thus, they were pooled to increase statistical power and accuracy of effect‐size estimation (n = 13–14, out of lysate for one tibialis anterior muscle sample). (E) Representative blots. Main effect of insulin stimulation is indicated by †/††† P < 0.05/0.001. Statistically significant main effect of Fst288 overexpression is indicated by */**/*** P < 0.05/0.01/0.001. Data are shown as mean ± SEM with individual values.
Fst288 overexpression restores insulin resistance in diet‐induced obese mice
Because we observed that Fst markedly increased insulin‐stimulated glucose uptake in skeletal muscle, we next asked if Fst288 could be relevant for restoring insulin‐resistant conditions. We fed mice a 60E% HFD for 10 weeks, an intervention known to induce obesity and muscular insulin resistance.43 Mice were injected with rAAV6: Fst288 8 weeks into the diet intervention, at a time point when the HFD mice weighed significantly more than chow‐fed control mice (Figure 5A), displayed markedly increased adiposity (Figure 5B), and reduced relative lean body mass (Figure 5C). Importantly, at this time of the HFD intervention, muscular insulin resistance has already set in,44, 45 thus allowing us to test the therapeutic potential for Fst288 in restoring insulin sensitivity in already insulin‐resistant muscle. That the mice were indeed insulin resistant on the experimental day was evidenced by a blunted blood glucose response to insulin (dose 0.3 U kg−1) in the HFD‐fed mice compared with chow (Figure 5D).46, 47 We verified that TA muscle mass was increased by 33% after 2 weeks (Figure 5E) and that Fst was expressed in the rAAV6:Fst288‐treated muscles (Figure 5F). The HFD intervention did not alter basal or insulin‐induced intracellular signalling judged by p‐AKTT308 and p‐AKTS473 (data not shown) in agreement with some other reports.26, 48 Basal muscle glucose uptake in HFD mice was unaffected by diet and Fst288 administration (Figure 5G). HFD induced a 40% reduction in insulin‐stimulated glucose uptake in TA and gastrocnemius muscles (Figure 5H) when comparing with the rAAV6:MCS muscles from chow‐fed mice. Remarkably, Fst288 treatment completely restored insulin‐stimulated glucose uptake (Figure 5H–J) in the insulin‐resistant muscles of HFD‐fed mice. Having found that Fst288 overexpression increased glucose uptake in muscle and could restore insulin action, we next measured muscle glycogen. In both insulin sensitive chow‐fed and insulin‐resistant HFD‐fed mice, Fst288‐treated TA muscles contained significantly more glycogen (+45%), compared with controls (Figure 5K). These findings suggest that the larger amount of glucose that is taken up by the rAAV6:Fst288‐administered muscles is, at least in part, incorporated into glycogen. Together, our findings suggest that Fst treatment could be a potent strategy to increase insulin sensitivity, also in insulin‐resistant muscles. A summary of our findings is graphically illustrated in Figure 6.
Figure 5.
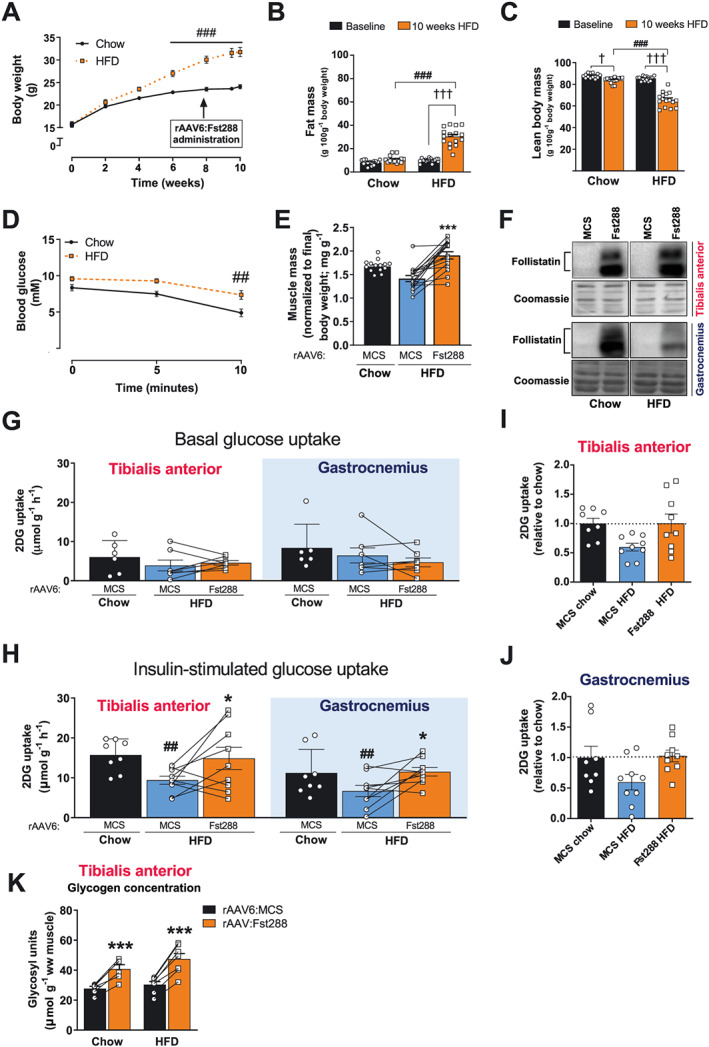
Effect of Fst288 overexpression in insulin‐resistant obese mice. (A) Body weight, (B) fat mass, and (C) lean body mass of mice fed a standard chow diet or 60E% high‐fat diet (HFD) for 10 weeks (n = 14–16). (D) Blood glucose in response to insulin (retro‐orbitally injected, 0.3 U kg−1 body weight) (n = 8–9). (E) Muscle mass of tibialis anterior muscle (n = 14–16). (F) Representative blots of follistatin in tibialis anterior and gastrocnemius muscle 2 weeks following intramuscular rAAV6:Fst288 injection. (G) Basal (saline injected) and (H) insulin‐stimulated 2‐deoxy‐glucose (2DG) uptake in tibialis and gastrocnemius muscles intramuscularly injected with rAAV6:Fst288 or rAAV6:MCS (control). Insulin‐stimulated 2DG uptake relative to chow rAAV6:MCS in (I) tibialis anterior and (J) gastrocnemius muscle. (K) Glycogen content determined as glycosyl units in tibialis anterior muscle (n = 6–8). Statistical significant difference between baseline and 10 week time point is indicated by †/††† P < 0.05/0.001. Statistically significant effect of Fst288 overexpression is indicated by */*** P < 0.05/0.001. Statistical significance between HFD and chow control mice is indicated by ##/### P < 0.01/0.001. Data are shown mean ± SEM with individual values shown when applicable.
Figure 6.
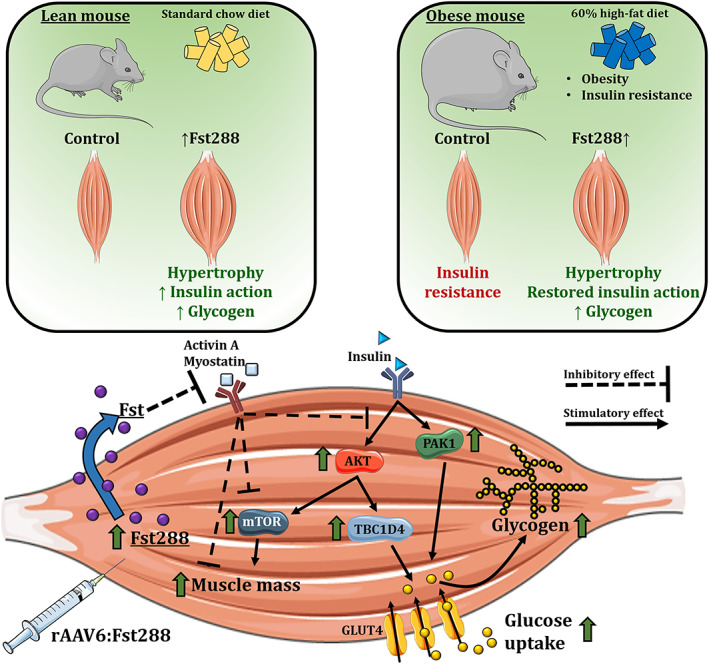
A graphical illustration of our main findings. Fst288 muscle overexpression markedly increased insulin‐stimulated (but not basal) intracellular insulin signalling of AKT, TBC1D4, PAK1, and mTOR signalling via p70S6K. In lean insulin sensitive mice, muscle‐directed Fst288 overexpression increased skeletal muscle insulin‐stimulated glucose uptake. Fst288 completely normalized muscle glucose uptake in insulin‐resistant obese mice.
Bariatric surgery increases follistatin and reduces activin A in obese insulin‐resistant individuals
Having established that Fst regulates insulin action in skeletal muscle, we next investigated the relationship between insulin action and TGF‐β ligands in humans. We measured circulating Fst and activin A concentrations in a group of obese insulin‐resistant (but normoglycemic) individuals before, 1 week, and 1 year after treatment by RYGB surgery. This procedure has consistently been shown to produce marked and rapid improvements in insulin resistance and glycaemic control, and data for the currently studied subjects have been published previously.29 One week following RYGB circulating Fst drastically increased (+108%, Figure 7A) while circulating activin A was mildly reduced (−26%, Figure 7B). At the same time, hepatic insulin sensitivity and plasma glucagon nearly doubled, while the peripheral insulin resistance did not differ from before surgery.29, 49 Importantly, the ratio between Fst and activin A (which determines actual activin A signalling through the ActRII) was 217% increased 1 week post‐RYGB (Figure 7C) where weight loss has not yet set in (Figure 7D). These levels were largely maintained 1 year post‐surgery (Fst +111%; activin A +13%; ratio +168%) when peripheral insulin sensitivity was improved (+200%), and hepatic insulin sensitivity was further improved (+50%) compared with 1 week after surgery.29 These findings indicate that in humans, circulating Fst is markedly altered by metabolic status beyond the effect of body weight loss and could thus play an unrecognized critical role in maintenance of insulin sensitivity, glucose homeostasis, and muscle mass.
Figure 7.
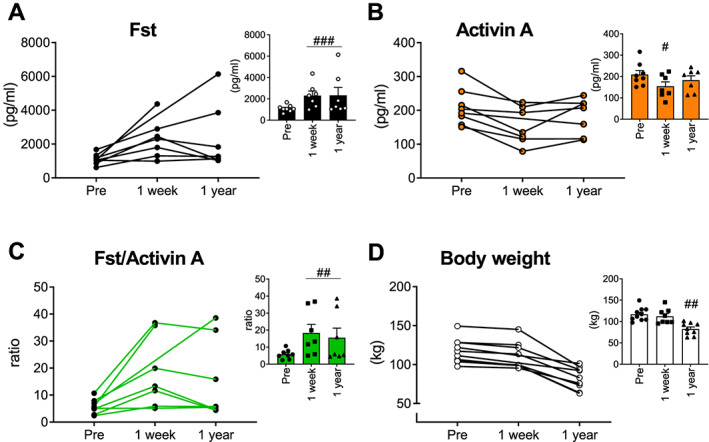
Serum follistatin and activin A concentrations in obese insulin‐resistant individuals before and following Roux‐en‐Y gastric bypass surgery. Serum concentrations of (A) follistatin (Fst), (B) activin A, and (C) ratio between Fst and activin A before and 1 week and 1 year after Roux‐en‐Y gastric bypass surgery (RYGB), a procedure that markedly improves glycaemic control. (D) Body weight (n = 9; however, for two data points, a value is missing, as indicated in the graph showing individual values). Statistically significant effect of RYGB is indicated by #/##/### P < 0.05/0.001/0.0001. Data are shown mean ± SEM and/or individual values when applicable.
Discussion
A major discovery in the current study was that concomitantly with increased muscle mass, Fst288 overexpression markedly augmented insulin action on glucose uptake and intracellular signalling and completely restored insulin resistance in diet‐induced obese mouse muscles. To the best of our knowledge, we are the first to describe and mechanistically explain this insulin‐sensitizing effect of Fst in muscle. This is an important discovery, as muscle wasting conditions are often associated with muscular insulin resistance, including cancer cachexia, sarcopenia, and Duchenne muscular dystrophy. Thus, strategies to treat insulin resistance in muscle wasting diseases are warranted, and our current study suggests that Fst might be an attractive candidate. Our findings are supported by a recent study using a transgenic (TG) approach to overexpress Fst in the entire skeletal muscle mass.50 In that study, Fst‐TG mice displayed better glucose tolerance compared with control mice; however, tissue‐specific insulin action was not investigated. Other circumstantial evidence supports our results that Fst is a positive regulator of insulin sensitivity in muscle. For example, pharmacological inhibition or genetic deletion of the Fst targets, myostatin or activin A, protects against HFD‐induced obesity.51, 52, 53 Such findings support our results that Fst is a positive regulator of insulin sensitivity in muscle. Importantly, the role for this pathway in insulin action is also evident from clinical trials in humans. Here, the ActRII inhibitor bimagrumab markedly improved insulin sensitivity and HbA1c in insulin‐resistant individuals.11 None of the above studies were able to ascribe the increased insulin sensitivity to a specific tissue, but our results suggest that likely, improved skeletal muscle glucose uptake underlies, at least some of, the beneficial effects of inhibiting ActRII or its ligands. Additionally, our data indicate that Fst per se and not the magnitude of hypertrophy drives the increase in insulin action placing Fst as a central mediator in the crosstalk between insulin action and muscle wasting. Intriguingly, the above‐mentioned evidence and our results appear to contradict a recent study showing that when Fst was overexpressed in the liver, insulin sensitivity and glucose tolerance was impaired in mice with genetically induced liver insulin resistance.54 However, in that study, viral liver expression of Fst markedly altered RNA expression profiles of the liver, probably affecting insulin sensitivity by confounding unknown factors. Furthermore, Fst was not overexpressed in skeletal muscle. Our data firmly show that Fst288 overexpression in muscle improves insulin action in a set‐up where the effect can be isolated to muscular effects, as the Fst288 variant used in our muscle study typically remains localized in the immediate vicinity of the cell from which it is secreted.55 This is in contrast to the longer circulating Fst315 isoform. Clearly, future work should investigate the tissue‐specific metabolic effects of distinct Fst isoforms.
Another major finding of our study was the marked up‐regulation of circulating Fst in obese insulin‐resistant humans following RYGB surgery, a treatment that markedly improved whole body insulin sensitivity.29, 49 Furthermore, the TGF‐β ligand, activin A, was reduced following RYGB. As a result, the Fst/activin A ratio increased, suggesting a marked reduction of the ActRII ligand, activin A, available to activate TGB‐β signalling. However, peripheral insulin sensitivity was not yet improved 1 week after RYGB where an increase in Fst and a decline in activin A was already observed. Our results may have broader implications also to adipose tissue function, as Fst can induce browning,56 which could promote increased energy expenditure and thereby protect from obesity. While our findings show that circulating Fst is markedly up‐regulated in humans by a treatment that improves glucose homeostasis, future studies should confirm inactivation of ActRII signalling in muscle biopsy samples. The mechanisms behind the up‐regulation of Fst in humans following RYGB are unresolved, but prolonged fasting (72 h) in humans has been demonstrated to increase circulating Fst 155% and decrease activin A,57 mimicking the results from the current study. Additionally, glucagon is suggested to increase the secretion of Fst from the liver.58 As such, the effect 1 week following RYGB could be a result of the dramatic reduction in food intake by these patients and a concomitant increase in plasma glucagon in the first week following surgery, while the mechanism for the up‐regulation 1 year following RYGB surgery remains unknown. In humans, the liver is a key contributor to circulating Fst, which is regulated by the glucagon‐to‐insulin ratio,58 further suggesting that circulating Fst is closely related to energy metabolism. However, contrasting with Fst's proposed beneficial role in insulin sensitivity, plasma Fst is actually slightly elevated in patients with type 2 diabetes59 and in non‐alcoholic fatty liver disease.60 Those studies did not analyse activin A. Thus, the Fst/activin A ratio could not be determined, which would be the relevant readout for actual activation/inactivation of ActRII. Thus, the exact cause(s) and consequence(s) of circulating Fst remain to be determined. It is worth noting that activin A is not the only ligand of Fst and thus the effect of Fst could be due to inhibition of other ligands like myostatin. Indeed, insulin‐stimulated glucose uptake is slightly increased in skeletal muscle of myostatin knockout (KO) mice.52 However, Fst overexpression induced muscle hypertrophy to a similar extent in myostatin KO and control mouse muscle,61 suggesting that myostatin is dispensable for Fst to induce hypertrophy. Future studies should determine the role of myostatin in Fst‐induced enhanced insulin sensitivity.
The molecular mechanism by which Fst regulates muscular insulin sensitivity was investigated in our study. Fst288 overexpression caused up‐regulation of key mediators of glucose uptake, including AKT, TBC1D4, and PAK1, and enhanced their responsiveness to insulin. Furthermore, the insulin responsiveness of p‐p70S6K, a reporter of mTORC1 activity, was increased by four‐fold. Seminal studies have shown that phosphorylated AKT induces mTOR‐mediated phosphorylation of p70S6K in skeletal muscle,62 resulting in muscle hypertrophy.63 The increased insulin‐stimulated p‐p70S6K in gastrocnemius with Fst288 overexpression even though p‐AKT was not significantly increased could be explained by signal amplification downstream of Akt, as p70S6K activity previously has been shown to be preserved in mice muscle with severe insulin receptor defects,64 suggesting either signal amplification or another upstream kinase regulating p70S6K in response to insulin. Although p70S6K seems to be largely dispensable for Fst‐induced hypertrophy,12, 65 our study suggests that Fst288 might also augment insulins action on other anabolic signals that regulate muscle mass. Indeed, both basal and insulin‐stimulated puromycin incorporation in L6 myotubes were up‐regulated by Fst overexpression, suggesting increased protein synthesis. This could be relevant as a blunted protein anabolic response to insulin has been proposed in obesity66 and T2D,7 although this was not directly tested in our study. Interestingly, despite an up‐regulated total amount of proteins in the insulin signalling pathways, we observed no effect of Fst288 on basal intracellular signalling or basal glucose uptake. This suggests that, while Fst increases the capacity for insulin signalling to be activated, insulin is needed to make use of this capacity. Being able to turn this pathway off in the presence of Fst is likely essential to maintain cellular homeostasis, as constitutive activation of Akt‐mTOR would result in activation of negative feedback loops with proven adverse effects on muscle.67 Whether Fst could improve skeletal muscle protein synthesis in situations of anabolic insulin resistance often found in ageing6 would be important to determine and could have implications for the treatment of sarcopenia in older subjects.
In vivo glucose uptake by skeletal muscle is regulated by delivery, transport across the muscle cell surface by the glucose transporter GLUT4 and intramyocellular metabolism.68 In the present study, GLUT4 expression was unchanged with Fst288, while the intracellular signals to translocate GLUT4 to the plasma membrane were greatly enhanced. In addition, HK levels were unaffected, while we observed that Fst increased PDH activity in gastrocnemius muscle. So, in addition to the effects of Fst on key insulin sensitive proteins and glucose incorporation into glycogen, Fst also increased PDH activity in gastrocnemius muscle, suggesting greater capacity for glycolysis‐driven mitochondrial glucose oxidation.52 This is in line with a previous report showing increased respiratory exchange rate in myostatin KO mice.52 Interestingly, we observed that Fst288 regulated the Rab GAP proteins in opposite directions, TBC1D4 up and TBC1D1 down. These proteins regulate GLUT4 translocation and protein expression.69 Down‐regulation of TBC1D1 would be expected to reduce insulin actin on glucose uptake, as TCB1D1 KO mouse muscles are insulin resistant, likely due to a 50% reduction in GLUT4 protein.70 On the contrary in our study, reduced TBC1D1 protein and p‐TBC1D1Thr596 with Fst288 occurred with improved insulin sensitivity and normal GLUT4 protein expression. However, insulin stimulation promotes phosphorylation of TBC1D1Thr596 without affecting the capacity of TBC1D1 to bind to 14‐3‐3 in L6 cells35 and intact skeletal muscle,71 indicating that the decrease in p‐TBC1D1Thr596 is of minor significance in relation to the up‐regulated insulin‐stimulated glucose uptake with Fst288 overexpression. Interestingly, similar to the increased TBC1D4 phosphorylation observed in our study, some (but not all72, 73) studies find that greater post‐exercise insulin‐stimulated glucose uptake was accompanied by greater TBC1D4 (but not TBC1D1) phosphorylation.74, 75 Thus, an outstanding question is whether Fst could increase post‐exercise insulin sensitivity. Given that our findings show TBC1D4 phosphorylation as a target for Fst, it would be relevant for future studies to elucidate a potential role for Fst in post‐exercise‐enhanced glucose uptake, which also impinges on TBC1D4.74, 75
That Fst markedly affects insulin action in muscle could have significant implications, as Fst treatment and ActRII inhibition are currently under investigation to treat muscle wasting conditions, including Becker muscular dystrophy18 and sarcopenia.10 While our study only investigated the effect of short‐term Fst288 treatment, clinical trials have found no adverse effects of Fst or pharmacological ActRII inhibition months after gene transfer or treatment in humans.11, 76 Results from our study suggest that this could be ascribed to the fact that Fst does not affect basal intracellular signalling, while enhancing insulin action. This underlines the therapeutic potential and safety for Fst‐based and ActRII‐based therapies to improve both muscle mass and, as reported in our study, to enhance muscular insulin sensitivity and glucose uptake.
Funding
The study was supported by several grants. Danish Research Council (grant numbers DFF‐4004‐00233 to L.S. and DFF‐6108‐00203A to E.A.R.). The Novo Nordisk Foundation (grant numbers: 27274 to E.A.R. and NNF18OC0032330 to K.N.B.‐M.). Novo Nordisk Foundation Excellence project grant to T.E.J. (grant number #15182) and L.S. (grant number #32082). China Scholarship Council (CSC) PhD Scholarship to X.H. and Z.L. PhD scholarship from the National Commission for Scientific and Technological Research (CONICYT) to C.H.‐O. PhD fellowship from The Lundbeck Foundation (grant number 2015‐3388 to L.L.V.M.).
Conflict of interests
The authors declare no competing interests.
Author contributions
X.H., L.L.V.M., E.A.R., and L.S. designed the study. X.H., L.L.V.M., E.D.G., and L.S. designed and conducted the mouse study, with experimental contribution from T.E.J., C.H.‐O., Z.L., J.R.K., J.D., and P.G. K.N.B.‐M. and S.M. carried out the human experiments. X.H., L.L.V.M., E.A.R., and L.S. drafted the paper. All authors contributed to the final version of the manuscript.
Supporting information
Figure S1. The ratio of phosphorylated (p‐)protein/total protein of (A) AKTThr308, B) AKTSer473, C) TBC1D4Thr642, D) TBC1D1Thr596, E) p70S6KThr389, and F) PAK1Thr423 in tibialis anterior and gastrocnemius muscles following 2‐week rAAV6:Fst288 overexpression in muscle (n = 5‐8, one or two mouse samples excluded due to poor quality blot). G) Basal and insulin‐stimulated p‐AMPKThr172 in tibialis anterior muscle (n = 6‐8, one mouse sample excluded due to poor quality blot). Main effect of insulin‐stimulation is indicated by ††/††† P < 0.01/0.001. Statistically significant effect of Fst288 overexpression is indicated by */** P < 0.05/0.01. Data are shown as mean ± SEM with individual values.
Figure S2. The ratio of phosphorylated (p‐)protein/total protein of A) PDH‐E1αSer293 and B) PDH‐E1αSer300 in tibialis anterior and gastrocnemius muscle following 2‐week rAAV6:Fst288 overexpression in muscle (n = 6‐8, out of lysate for one tibialis anterior muscle sample). Main effect of insulin‐stimulation is indicated by ††† p < 0.001. Statistically significant effect of Fst288 overexpression is indicated by *P < 0.05. Data are shown as mean ± SEM with individual values.
Acknowledgements
We acknowledge the skilled technical assistance of Irene Bech Nielsen, Betina Bolmgren, and Nicoline Resen Andersen (Department of Nutrition, Exercise and Sports, University of Copenhagen) and we thank all the individuals who took part in these studies. We thank Steffen H. Raun for help with the graphical abstract. We also thank Professor Amira Klip (Cell Biology Program, Research Institute, The Hospital for Sick Children, Toronto, Canada) for the kind donation of the L6‐GLUT4myc muscle cells and Professor D. Grahame Hardie (University of Dundee, Scotland, UK) for the kind donation of the PDH‐1Eα, p‐PDH‐1EαSer293, p‐PDH‐1EαSer300, and PDK4 antibodies for this study. The authors certify that they comply with the ethical guidelines for authorship and publishing of the Journal of Cachexia, Sarcopenia and Muscle.77
Han X., Møller L. L. V., De Groote E., Bojsen‐Møller K. N., Davey J., Henríquez‐Olguin C., Li Z., Knudsen J. R., Jensen T. E., Madsbad S., Gregorevic P., Richter E. A., and Sylow L. (2019) Mechanisms involved in follistatin‐induced hypertrophy and increased insulin action in skeletal muscle, Journal of Cachexia, Sarcopenia and Muscle, 10, 1241–1257. 10.1002/jcsm.12474.
Contributor Information
Erik Arne Richter, Email: erichter@nexs.ku.dk.
Lykke Sylow, Email: lshansen@nexs.ku.dk.
References
- 1. Leong DP, Teo KK, Rangarajan S, Lopez‐Jaramillo P, Avezum A, Orlandini A, et al. Prognostic value of grip strength: findings from the Prospective Urban Rural Epidemiology (PURE) study. Lancet 2015;386:266–273. [DOI] [PubMed] [Google Scholar]
- 2. DeFronzo RA, Gunnarsson R, Björkman O, Olsson M, Wahren J. Effects of insulin on peripheral and splanchnic glucose metabolism in noninsulin‐dependent (type II) diabetes mellitus. J Clin Invest 1985;76:149–155. [DOI] [PMC free article] [PubMed] [Google Scholar]
- 3. Dev R, Bruera E, Dalal S. Insulin resistance and body composition in cancer patients. Ann Oncol 2018;29:ii18–ii26. [DOI] [PubMed] [Google Scholar]
- 4. Wagner EF, Petruzzelli M. Cancer metabolism: a waste of insulin interference. Nature 2015;521:430–431. [DOI] [PubMed] [Google Scholar]
- 5. Cleasby ME, Jamieson PM, Atherton PJ. Insulin resistance and sarcopenia: mechanistic links between common co‐morbidities. J Endocrinol 2016;229:R67–R81. [DOI] [PubMed] [Google Scholar]
- 6. Rasmussen BB, Fujita S, Wolfe RR, Mittendorfer B, Roy M, Rowe VL, et al. Insulin resistance of muscle protein metabolism in aging. FASEB J 2006;20:768–769. [DOI] [PMC free article] [PubMed] [Google Scholar]
- 7. Pereira S, Marliss EB, Morais JA, Chevalier S, Gougeon R. Insulin resistance of protein metabolism in type 2 diabetes. Diabetes 2008;57:56–63. [DOI] [PubMed] [Google Scholar]
- 8. Cusi K, Maezono K, Osman A, Pendergrass M, Patti ME, Pratipanawatr T, et al. Insulin resistance differentially affects the PI 3‐kinase‐ and MAP kinase‐mediated signaling in human muscle. J Clin Invest 2000;105:311–320. [DOI] [PMC free article] [PubMed] [Google Scholar]
- 9. Latres E, Mastaitis J, Fury W, Miloscio L, Trejos J, Pangilinan J, et al. Activin A more prominently regulates muscle mass in primates than does GDF8. Nat Commun 2017;8:15153. [DOI] [PMC free article] [PubMed] [Google Scholar]
- 10. Rooks D, Praestgaard J, Hariry S, Laurent D, Petricoul O, Perry RG, et al. Treatment of sarcopenia with bimagrumab: results from a phase ii, randomized, controlled, proof‐of‐concept study. J Am Geriatr Soc 2017;65:1988–1995. [DOI] [PubMed] [Google Scholar]
- 11. Garito T, Roubenoff R, Hompesch M, Morrow L, Gomez K, Rooks D, et al. Bimagrumab improves body composition and insulin sensitivity in insulin‐resistant individuals. Diabetes, Obes Metab 2018;20:94–102. [DOI] [PubMed] [Google Scholar]
- 12. Winbanks CE, Weeks KL, Thomson RE, Sepulveda PV, Beyer C, Qian H, et al. Follistatin‐mediated skeletal muscle hypertrophy is regulated by Smad3 and mTOR independently of myostatin. J Cell Biol 2012;197:997–1008. [DOI] [PMC free article] [PubMed] [Google Scholar]
- 13. Nakatani M, Takehara Y, Sugino H, Matsumoto M, Hashimoto O, Hasegawa Y, et al. Transgenic expression of a myostatin inhibitor derived from follistatin increases skeletal muscle mass and ameliorates dystrophic pathology in mdx mice. FASEB J 2008;22:477–487. [DOI] [PubMed] [Google Scholar]
- 14. Kota J, Handy CR, Haidet AM, Montgomery CL, Eagle A, Rodino‐Klapac LR, et al. Follistatin gene delivery enhances muscle growth and strength in nonhuman primates. Sci Transl Med 2009;1:6ra15. [DOI] [PMC free article] [PubMed] [Google Scholar]
- 15. Amthor H, Nicholas G, McKinnell I, Kemp CF, Sharma M, Kambadur R, et al. Follistatin complexes myostatin and antagonises myostatin‐mediated inhibition of myogenesis. Dev Biol 2004;270:19–30. [DOI] [PubMed] [Google Scholar]
- 16. Yaden BC, Croy JE, Wang Y, Wilson JM, Datta‐Mannan A, Shetler P, et al. Follistatin: a novel therapeutic for the improvement of muscle regeneration. J Pharmacol Exp Ther 2014;349:355–371. [DOI] [PubMed] [Google Scholar]
- 17. Sepulveda PV, Lamon S, Hagg A, Thomson RE, Winbanks CE, Qian H, et al. Evaluation of follistatin as a therapeutic in models of skeletal muscle atrophy associated with denervation and tenotomy. Sci Rep 2015;5:17535. [DOI] [PMC free article] [PubMed] [Google Scholar]
- 18. Mendell JR, Sahenk Z, Al‐Zaidy S, Rodino‐Klapac LR, Lowes LP, Alfano LN, et al. Follistatin gene therapy for sporadic inclusion body myositis improves functional outcomes. Mol Ther 2017;25:870–879. [DOI] [PMC free article] [PubMed] [Google Scholar]
- 19. Davey JR, Watt KI, Parker BL, Chaudhuri R, Ryall JG, Cunningham L, et al. Integrated expression analysis of muscle hypertrophy identifies Asb2 as a negative regulator of muscle mass. JCI Insight 2016;1. [DOI] [PMC free article] [PubMed] [Google Scholar]
- 20. Sylow L, Kleinert M, Pehmøller C, Prats C, Chiu TT, Klip A, et al. Akt and Rac1 signaling are jointly required for insulin‐stimulated glucose uptake in skeletal muscle and downregulated in insulin resistance. Cell Signal 2014;26:323–331. [DOI] [PubMed] [Google Scholar]
- 21. JeBailey L, Wanono O, Niu W, Roessler J, Rudich A, Klip A. Ceramide‐ and oxidant‐induced insulin resistance involve loss of insulin‐dependent Rac‐activation and actin remodeling in muscle cells. Diabetes 2007;56:394–403. [DOI] [PubMed] [Google Scholar]
- 22. Sylow L, Jensen TE, Kleinert M, Hojlund K, Kiens B, Wojtaszewski J, et al. Rac1 signaling is required for insulin‐stimulated glucose uptake and is dysregulated in insulin‐resistant murine and human skeletal muscle. Diabetes 2013;62:1865–1875. [DOI] [PMC free article] [PubMed] [Google Scholar]
- 23. Blankinship MJ, Gregorevic P, Allen JM, Harper SQ, Harper H, Halbert CL, et al. Efficient transduction of skeletal muscle using vectors based on adeno‐associated virus serotype 6. Mol Ther 2004;10:671–678. [DOI] [PubMed] [Google Scholar]
- 24. Ferre P, Leturque A, Burnol A‐F, Penicaud L, Girard J. A method to quantify glucose utilization in vivo in skeletal muscle and white adipose tissue of the anaesthetized rat. Biochem J 1985;228:103–110. [DOI] [PMC free article] [PubMed] [Google Scholar]
- 25. Fueger PT, Hess HS, Posey KA, Bracy DP, Pencek RR, Charron MJ, et al. Control of exercise‐stimulated muscle glucose uptake by GLUT4 is dependent on glucose phosphorylation capacity in the conscious mouse. J Biol Chem 2004;279:50956–50961. [DOI] [PubMed] [Google Scholar]
- 26. Raun SH, Ali M, Kjøbsted R, Møller LLV, Federspiel MA, Richter EA, et al. Rac1 muscle knockout exacerbates the detrimental effect of high‐fat diet on insulin‐stimulated muscle glucose uptake independently of Akt. J Physiol 2018;596:2283–2299. [DOI] [PMC free article] [PubMed] [Google Scholar]
- 27. Passonneau JV, Gatfield PD, Schulz DW, Lowry OH. An enzymic method for measurement of glycogen. Anal Biochem 1967;19:315–326. [DOI] [PubMed] [Google Scholar]
- 28. Schmidt EK, Clavarino G, Ceppi M, Pierre P. SUnSET, a nonradioactive method to monitor protein synthesis. Nat Methods 2009;6:275–277. [DOI] [PubMed] [Google Scholar]
- 29. Bojsen‐Møller KN, Dirksen C, Jørgensen NB, Jacobsen SH, Serup AK, Albers PH, et al. Early enhancements of hepatic and later of peripheral insulin sensitivity combined with increased postprandial insulin secretion contribute to improved glycemic control after Roux‐en‐Y gastric bypass. Diabetes 2014;63:1725–1737. [DOI] [PubMed] [Google Scholar]
- 30. Pilegaard H, Birk JB, Sacchetti M, Mourtzakis M, Hardie DG, Stewart G, et al. PDH‐E1 dephosphorylation and activation in human skeletal muscle during exercise: effect of intralipid infusion. Diabetes 2006;55:3020–3027. [DOI] [PubMed] [Google Scholar]
- 31. Kiilerich K, Adser H, Jakobsen AH, Pedersen PA, Hardie DG, Wojtaszewski JFP, et al. PGC‐1α increases PDH content but does not change acute PDH regulation in mouse skeletal muscle. Am J Physiol Integr Comp Physiol 2010;299:R1350–R1359. [DOI] [PubMed] [Google Scholar]
- 32. Welinder C, Ekblad L. Coomassie staining as loading control in western blot analysis. J Proteome Res 2011;10:1416–1419. [DOI] [PubMed] [Google Scholar]
- 33. Sarbassov DD, Guertin DA, Ali SM, Sabatini DM. Phosphorylation and regulation of Akt/PKB by the rictor‐mTOR complex. Science 2005;307:1098–1101. [DOI] [PubMed] [Google Scholar]
- 34. Cartee GD. Roles of TBC1D1 and TBC1D4 in insulin‐ and exercise‐stimulated glucose transport of skeletal muscle. Diabetologia 2015;58:19–30. [DOI] [PMC free article] [PubMed] [Google Scholar]
- 35. Chen S, Murphy J, Toth R, Campbell DG, Morrice NA, Mackintosh C. Complementary regulation of TBC1D1 and AS160 by growth factors, insulin and AMPK activators. Biochem J 2008;409:449–459. [DOI] [PubMed] [Google Scholar]
- 36. Vichaiwong K, Purohit S, An D, Toyoda T, Jessen N, Hirshman MF, et al. Contraction regulates site‐specific phosphorylation of TBC1D1 in skeletal muscle. Biochem J 2010;431:311–320. [DOI] [PMC free article] [PubMed] [Google Scholar]
- 37. Treebak JT, Pehmøller C, Kristensen JM, Kjøbsted R, Birk JB, Schjerling P, et al. Acute exercise and physiological insulin induce distinct phosphorylation signatures on TBC1D1 and TBC1D4 proteins in human skeletal muscle. J Physiol 2014;592:351–375. [DOI] [PMC free article] [PubMed] [Google Scholar]
- 38. Barbé C, Bray F, Gueugneau M, Devassine S, Lause P, Tokarski C, et al. Comparative proteomic and transcriptomic analysis of follistatin‐induced skeletal muscle hypertrophy. J Proteome Res 2017;16:3477–3490. [DOI] [PubMed] [Google Scholar]
- 39. Fueger PT, Shearer J, Bracy DP, Posey KA, Pencek RR, McGuinness OP, et al. Control of muscle glucose uptake: test of the rate‐limiting step paradigm in conscious, unrestrained mice. J Physiol 2005;562:925–935. [DOI] [PMC free article] [PubMed] [Google Scholar]
- 40. Sugden MC, Holness MJ. Recent advances in mechanisms regulating glucose oxidation at the level of the pyruvate dehydrogenase complex by PDKs. Am J Physiol Metab 2003;284:E855–E862. [DOI] [PubMed] [Google Scholar]
- 41. Roche TE, Baker JC, Yan X, Hiromasa Y, Gong X, Peng T et al Distinct regulatory properties of pyruvate dehydrogenase kinase and phosphatase isoforms. 2001. pp. 33–75. [DOI] [PubMed]
- 42. Patel MS, Korotchkina LG. Regulation of mammalian pyruvate dehydrogenase complex by phosphorylation: complexity of multiple phosphorylation sites and kinases. Exp Mol Med 2001;33:191–197. [DOI] [PubMed] [Google Scholar]
- 43. Kleinert M, Clemmensen C, Hofmann SM, Moore MC, Renner S, Woods SC, et al. Animal models of obesity and diabetes mellitus. Nat Rev Endocrinol 2018;14:140–162. [DOI] [PubMed] [Google Scholar]
- 44. Winzell MS, Ahren B. The high‐fat diet‐fed mouse: a model for studying mechanisms and treatment of impaired glucose tolerance and type 2 diabetes. Diabetes 2004;53:S215–S219. [DOI] [PubMed] [Google Scholar]
- 45. Turner N, Kowalski GM, Leslie SJ, Risis S, Yang C, Lee‐Young RS, et al. Distinct patterns of tissue‐specific lipid accumulation during the induction of insulin resistance in mice by high‐fat feeding. Diabetologia 2013;56:1638–1648. [DOI] [PubMed] [Google Scholar]
- 46. Akinmokun A, Selby PL, Ramaiya K, Alberti KGMM. The short insulin tolerance test for determination of insulin sensitivity: a comparison with the euglycaemic clamp. Diabet Med 1992;9:432–437. [DOI] [PubMed] [Google Scholar]
- 47. Hughey CC, Wasserman DH, Lee‐Young RS, Lantier L. Approach to assessing determinants of glucose homeostasis in the conscious mouse. Mamm Genome 2014;25:522–538. [DOI] [PMC free article] [PubMed] [Google Scholar]
- 48. Kim Y‐B, Nikoulina SE, Ciaraldi TP, Henry RR, Kahn BB. Normal insulin‐dependent activation of Akt/protein kinase B, with diminished activation of phosphoinositide 3‐kinase, in muscle in type 2 diabetes. J Clin Invest 1999;104:733–741. [DOI] [PMC free article] [PubMed] [Google Scholar]
- 49. Albers PH, Bojsen‐Møller KN, Dirksen C, Serup AK, Kristensen DE, Frystyk J, et al. Enhanced insulin signaling in human skeletal muscle and adipose tissue following gastric bypass surgery. Am J Physiol Regul Integr Comp Physiol 2015;309:R510–R524. [DOI] [PubMed] [Google Scholar]
- 50. Singh R, Pervin S, Lee S‐J, Kuo A, Grijalva V, David J, et al. Metabolic profiling of follistatin overexpression: a novel therapeutic strategy for metabolic diseases. Diabetes, Metab Syndr Obes Targets Ther 2018;11:65–84. [DOI] [PMC free article] [PubMed] [Google Scholar]
- 51. Akpan I, Goncalves MD, Dhir R, Yin X, Pistilli EE, Bogdanovich S, et al. The effects of a soluble activin type IIB receptor on obesity and insulin sensitivity. Int J Obes (Lond) 2009;33:1265–1273. [DOI] [PMC free article] [PubMed] [Google Scholar]
- 52. Guo T, Jou W, Chanturiya T, Portas J, Gavrilova O, McPherron AC. Myostatin inhibition in muscle, but not adipose tissue, decreases fat mass and improves insulin sensitivity. PLoS One 2009;4:e4937. [DOI] [PMC free article] [PubMed] [Google Scholar]
- 53. McPherron AC, Lee S‐J. Suppression of body fat accumulation in myostatin‐deficient mice. J Clin Invest 2002;109:595–601. [DOI] [PMC free article] [PubMed] [Google Scholar]
- 54. Tao R, Wang C, Stöhr O, Qiu W, Hu Y, Miao J, et al. Inactivating hepatic follistatin alleviates hyperglycemia. Nat Med 2018;24:1058–1069. [DOI] [PMC free article] [PubMed] [Google Scholar]
- 55. Patel K. Follistatin. Follistatin. Int J Biochem Cell Biol 1998;30:1087–1093. [DOI] [PubMed] [Google Scholar]
- 56. Rae K, Hollebone K, Chetty V, Clausen D, McFarlane J. Follistatin serum concentrations during full‐term labour in women—significant differences between spontaneous and induced labour. Reproduction 2007;134:705–711. [DOI] [PubMed] [Google Scholar]
- 57. Vamvini MT, Aronis KN, Chamberland JP, Mantzoros CS. Energy deprivation alters in a leptin‐ and cortisol‐independent manner circulating levels of activin A and follistatin but not myostatin in healthy males. J Clin Endocrinol Metab 2011;96:3416–3423. [DOI] [PMC free article] [PubMed] [Google Scholar]
- 58. Hansen JS, Rutti S, Arous C, Clemmesen JO, Secher NH, Drescher A, et al. Circulating follistatin is liver‐derived and regulated by the glucagon‐to‐insulin ratio. J Clin Endocrinol Metab 2016;101:550–560. [DOI] [PubMed] [Google Scholar]
- 59. Hansen J, Rinnov A, Krogh‐Madsen R, Fischer CP, Andreasen AS, Berg RMG, et al. Plasma follistatin is elevated in patients with type 2 diabetes: relationship to hyperglycemia, hyperinsulinemia, and systemic low‐grade inflammation. Diabetes Metab Res Rev 2013;29:463–472. [DOI] [PubMed] [Google Scholar]
- 60. Yndestad A, Haukeland JW, Dahl TB, Bjøro K, Gladhaug IP, Berge C, et al. A complex role of activin A in non‐alcoholic fatty liver disease. Am J Gastroenterol 2009;104:2196–2205. [DOI] [PubMed] [Google Scholar]
- 61. Gilson H, Schakman O, Kalista S, Lause P, Tsuchida K, Thissen J‐P. Follistatin induces muscle hypertrophy through satellite cell proliferation and inhibition of both myostatin and activin. Am J Physiol Metab 2009;297:E157–E164. [DOI] [PubMed] [Google Scholar]
- 62. Bodine SC, Stitt TN, Gonzalez M, Kline WO, Stover GL, Bauerlein R, et al. Akt/mTOR pathway is a crucial regulator of skeletal muscle hypertrophy and can prevent muscle atrophy in vivo. Nat Cell Biol 2001;3:1014–1019. [DOI] [PubMed] [Google Scholar]
- 63. Rommel C, Bodine SC, Clarke BA, Rossman R, Nunez L, Stitt TN, et al. Mediation of IGF‐1‐induced skeletal myotube hypertrophy by PI(3)K/Akt/mTOR and PI(3)K/Akt/GSK3 pathways. Nat Cell Biol 2001;3:1009–1013. [DOI] [PubMed] [Google Scholar]
- 64. Chang PY, Le Marchand‐Brustel Y, Cheatham LA, Moller DE. Insulin stimulation of mitogen‐activated protein kinase, p90rsk, and p70 S6 kinase in skeletal muscle of normal and insulin‐resistant mice. Implications for the regulation of glycogen synthase. J Biol Chem 1995;270:29928–29935. [DOI] [PubMed] [Google Scholar]
- 65. Kalista S, Schakman O, Gilson H, Lause P, Demeulder B, Bertrand L, et al. The type 1 insulin‐like growth factor receptor (IGF‐IR) pathway is mandatory for the follistatin‐induced skeletal muscle hypertrophy. Endocrinology 2012;153:241–253. [DOI] [PubMed] [Google Scholar]
- 66. Chevalier S, Marliss EB, Morais JA, Lamarche M, Gougeon R. Whole‐body protein anabolic response is resistant to the action of insulin in obese women. Am J Clin Nutr 2005;82:355–365. [DOI] [PubMed] [Google Scholar]
- 67. Castets P, Lin S, Rion N, Di Fulvio S, Romanino K, Guridi M, et al. Sustained activation of mTORC1 in skeletal muscle inhibits constitutive and starvation‐induced autophagy and causes a severe, late‐onset myopathy. Cell Metab 2013;17:731–744. [DOI] [PubMed] [Google Scholar]
- 68. Sylow L, Kleinert M, Richter EA, Jensen TE. Exercise‐stimulated glucose uptake‐regulation and implications for glycaemic control. Nat Rev Endocrinol 2017;13:133–148. [DOI] [PubMed] [Google Scholar]
- 69. Mafakheri S, Chadt A, Al‐Hasani H. Regulation of RabGAPs involved in insulin action. Biochem Soc Trans 2018;46:683–690. [DOI] [PubMed] [Google Scholar]
- 70. Dokas J, Chadt A, Nolden T, Himmelbauer H, Zierath JR, Joost H‐G, et al. Conventional knockout of Tbc1d1 in mice impairs insulin‐ and AICAR‐stimulated glucose uptake in skeletal muscle. Endocrinology 2013;154:3502–3514. [DOI] [PubMed] [Google Scholar]
- 71. Pehmøller C, Treebak JT, Birk JB, Chen S, Mackintosh C, Hardie DG, et al. Genetic disruption of AMPK signaling abolishes both contraction‐ and insulin‐stimulated TBC1D1 phosphorylation and 14‐3‐3 binding in mouse skeletal muscle. Am J Physiol Endocrinol Metab 2009;297:E665–E675. [DOI] [PMC free article] [PubMed] [Google Scholar]
- 72. Levinger I, Jerums G, Stepto NK, Parker L, Serpiello FR, McConell GK, et al. The effect of acute exercise on undercarboxylated osteocalcin and insulin sensitivity in obese men. J Bone Miner Res 2014;29:2571–2576. [DOI] [PubMed] [Google Scholar]
- 73. Ikeda S, Tamura Y, Kakehi S, Takeno K, Kawaguchi M, Watanabe T, et al. Exercise‐induced enhancement of insulin sensitivity is associated with accumulation of M2‐polarized macrophages in mouse skeletal muscle. Biochem Biophys Res Commun 2013;441:36–41. [DOI] [PubMed] [Google Scholar]
- 74. Pehmøller C, Brandt N, Birk JB, Høeg LD, Sjøberg KA, Goodyear LJ, et al. Exercise alleviates lipid‐induced insulin resistance in human skeletal muscle‐signaling interaction at the level of TBC1 domain family member 4. Diabetes 2012;61:2743–2752. [DOI] [PMC free article] [PubMed] [Google Scholar]
- 75. Treebak JT, Frøsig C, Pehmøller C, Chen S, Maarbjerg SJ, Brandt N, et al. Potential role of TBC1D4 in enhanced post‐exercise insulin action in human skeletal muscle. Diabetologia 2009;52:891–900. [DOI] [PMC free article] [PubMed] [Google Scholar]
- 76. Mendell JR, Sahenk Z, Malik V, Gomez AM, Flanigan KM, Lowes LP, et al. A phase 1/2a follistatin gene therapy trial for becker muscular dystrophy. Mol Ther 2015;23:192–201. [DOI] [PMC free article] [PubMed] [Google Scholar]
- 77. von Haehling S, Morley JE, Coats AJS, Anker SD. Ethical guidelines for publishing in the journal of cachexia, sarcopenia and muscle: update 2017. J Cachexia Sarcopenia Muscle 2017;8:1081–1083. [DOI] [PMC free article] [PubMed] [Google Scholar]
Associated Data
This section collects any data citations, data availability statements, or supplementary materials included in this article.
Supplementary Materials
Figure S1. The ratio of phosphorylated (p‐)protein/total protein of (A) AKTThr308, B) AKTSer473, C) TBC1D4Thr642, D) TBC1D1Thr596, E) p70S6KThr389, and F) PAK1Thr423 in tibialis anterior and gastrocnemius muscles following 2‐week rAAV6:Fst288 overexpression in muscle (n = 5‐8, one or two mouse samples excluded due to poor quality blot). G) Basal and insulin‐stimulated p‐AMPKThr172 in tibialis anterior muscle (n = 6‐8, one mouse sample excluded due to poor quality blot). Main effect of insulin‐stimulation is indicated by ††/††† P < 0.01/0.001. Statistically significant effect of Fst288 overexpression is indicated by */** P < 0.05/0.01. Data are shown as mean ± SEM with individual values.
Figure S2. The ratio of phosphorylated (p‐)protein/total protein of A) PDH‐E1αSer293 and B) PDH‐E1αSer300 in tibialis anterior and gastrocnemius muscle following 2‐week rAAV6:Fst288 overexpression in muscle (n = 6‐8, out of lysate for one tibialis anterior muscle sample). Main effect of insulin‐stimulation is indicated by ††† p < 0.001. Statistically significant effect of Fst288 overexpression is indicated by *P < 0.05. Data are shown as mean ± SEM with individual values.