

Abstract
Objective
Adult polyglucosan body disease (APBD) is an adult‐onset neurological variant of glycogen storage disease type IV. APBD is caused by recessive mutations in the glycogen branching enzyme gene, and the consequent accumulation of poorly branched glycogen aggregates called polyglucosan bodies in the nervous system. There are presently no treatments for APBD. Here, we test whether downregulation of glycogen synthesis is therapeutic in a mouse model of the disease.
Methods
We characterized the effects of knocking out two pro‐glycogenic proteins in an APBD mouse model. APBD mice were crossed with mice deficient in glycogen synthase (GYS1), or mice deficient in protein phosphatase 1 regulatory subunit 3C (PPP1R3C), a protein involved in the activation of GYS1. Phenotypic and histological parameters were analyzed and glycogen was quantified.
Results
APBD mice deficient in GYS1 or PPP1R3C demonstrated improvements in life span, morphology, and behavioral assays of neuromuscular function. Histological analysis revealed a reduction in polyglucosan body accumulation and of astro‐ and micro‐gliosis in the brains of GYS1‐ and PPP1R3C‐deficient APBD mice. Brain glycogen quantification confirmed the reduction in abnormal glycogen accumulation. Analysis of skeletal muscle, heart, and liver found that GYS1 deficiency reduced polyglucosan body accumulation in all three tissues and PPP1R3C knockout reduced skeletal muscle polyglucosan bodies.
Interpretation
GYS1 and PPP1R3C are effective therapeutic targets in the APBD mouse model. These findings represent a critical step toward the development of a treatment for APBD and potentially other glycogen storage disease type IV patients.
Introduction
Adult polyglucosan body disease (APBD) is a progressive neurological disorder with central and peripheral nervous system involvement. Symptoms present around age 50 and include neurogenic bladder, distal sensory deficits, gait difficulties, and mild cognitive impairment. Disease progression leads to wheelchair dependence and shortened life expectancy. 1 , 2
APBD is caused by autosomal recessive mutations in the glycogen branching enzyme gene (GBE1) and is therefore one of several glycogen storage disease type IV (GSD IV, also known as Andersen disease) variants. 3 Despite its monogenic inheritance, GSD IV is clinically heterogeneous in tissues affected and age of onset. Patients are classified as presenting with the (1) fatal perinatal or congenital, (2) classical progressive hepatic, (3) non‐progressive hepatic, (4) childhood or (5) APBD variant. Disease severity and age of onset loosely correlate with residual GBE1 activity and, accordingly, APBD patients retain comparatively more GBE1 activity than earlier‐onset variants. 4 APBD occurs at a higher prevalence in the Ashkenazi Jewish population in which the majority of patients are homozygous for a GBE1 destabilizing mutation (p.Y329S) resulting in approximately 18% residual GBE1 activity. 5 , 6 , 7
GBE1 is responsible for catalyzing regular branch points in glycogen molecules and acts in concert with glycogen synthase (GYS), responsible for linear glycogen chain elongation, to form highly branched, soluble glycogen molecules. 8 GBE1 deficiency results in an imbalance between chain branching and elongation, and the formation of poorly branched glycogen. 9 The overly long chains of the poorly branched molecules wind round each other and extrude water, 10 leading the molecules to precipitate and aggregate into pathogenic inclusions called polyglucosan bodies (PBs). Being out of solution, PBs cannot be metabolized and accumulate with age, in most tissues eventually exceeding the amount of soluble glycogen. 11 PBs amassed in neuronal and astrocytic processes, with noted prevalence in neuronal axons, are thought to be responsible for APBD’s neurological manifestations. 2 , 12 There are presently no treatments to prevent PB formation and ensuing disease.
A therapeutic approach to reduce PB formation could target GYS, or enzymes involved in its activation, to correct the balance between chain elongation and branching. Mammals possess two GYS isoforms: (1) GYS1, expressed in most tissues including the nervous system and (2) GYS2, expressed only in the liver. Both are activated by protein phosphatase 1 (PP1)‐mediated multisite dephosphorylation, where PP1 comprises a catalytic subunit and a glycogen‐targeting regulatory subunit. 8 PP1 regulatory subunit 3C (PPP1R3C, also known as protein targeting to glycogen [PTG]) is ubiquitously expressed and its knockout indirectly reduces GYS activation and, reciprocally, increases activation of the glycogen digesting enzyme glycogen phosphorylase. 13 , 14 GYS1 and PPP1R3C therefore present two potential therapeutic targets for the prevention of PB formation in APBD. This hypothesis is supported by previous observations of PB prevention in mouse models of the progressive myoclonic epilepsy Lafora disease. 14 , 15 , 16 , 17
We here interrogated the effects of GYS1 and PPP1R3C deficiency on disease progression in an APBD mouse model. We demonstrate significant rescue in phenotype, histological parameters and abnormal glycogen accumulation, and obtain novel insights into the roles of these enzymes in glycogen metabolism.
Materials and Methods
Mice
APBD mice (Gbe1ys / ys) are homozygous for the Gbe1 c.986A > C (p.Y329S) mutation and retain 16‐21% GBE1 activity in brain, muscle, and heart, and 37% in liver. 18 Gbe1ys / ys mice with mono‐allelic Gys1 knockout 19 (Gbe1ys / ys Gys1 +/−), and Gbe1ys / ys mice with mono‐ or bi‐allelic Ppp1r3c knockout 17 (Gbe1ys / ys Ppp1r3c +/−, Gbe1ys / ys Ppp1r3c −/−) were generated in two separate mouse lines. Wild‐type and Gys1 +/− or Ppp1r3c −/− littermates were used as controls and Gys1 −/− mice were not studied given their 90% penetrant perinatal lethal phenotype. 19 Mice were sacrificed by cervical dislocation and tissues were frozen in liquid nitrogen or fixed in 10% neutral‐buffered formalin. GYS1‐ and PPP1R3C‐deficient APBD mouse lines (henceforth Gbe1ys Gys1 − and Gbe1ys Ppp1r3c −) were housed, and experiments with them performed at Ball State University (Muncie, IN, USA) and The Centre for Phenogenomics (Toronto, ON, CA), respectively. Mouse line genetic backgrounds were mixed: Gbe1ys Gys1 − line background was C57BL/6NTac;129/Ola;C57BL/6J;129SvJ and Gbe1ys Ppp1r3c − line background was C57BL/6NTac;129/Ola;C57BL/6J. Experiments were approved by the institutional Animal Care Committees.
Physical and behavioral phenotyping
Life span was measured as days to humane endpoint or 24 months. Body length was measured in the Gbe1ys Ppp1r3c − mouse line using the ExerGait XL treadmill (Columbus Instruments, Columbus, OH, USA) and TreadScan software (Clever Sys Inc., Reston, VA, USA).
Time to traverse a 60 × 2 cm beam and number of foot faults were measured in Gbe1ys Gys1 − mice. Scoring was 0 if unable to traverse, 1 if able to but with foot faults, or 2 if able to with no faults. Scores were averaged across 4‐5 trials with a maximum time of 60 sec/trial.
Activity of Gbe1ys Gys1 − mice was video‐recorded in a 32 × 26 cm chamber for 30 min. Pixel change/second was used as an indicator of total activity and quantified using FreezeScan software (Clever Sys Inc., Reston, VA, USA). Gbe1ys Ppp1r3c − mice were recorded in a 48 x 36 cm chamber overlaying a 15‐square grid for 10 min. Squares entered with four limbs indicated locomotor activity. Counts were binned with size of 10 (<10 squares scored 1, <20 scored 2, etc. with >99 scored 11).
Hindfeet stride length was measured in Gbe1ys Gys1 − mice after paw painting. Ten left and right strides were averaged. Distance from front of treadmill, homolateral feet distance and maximum foot distance from transverse plane were measured in Gbe1ys Ppp1r3c − mice using the ExerGait XL treadmill (Columbus Instruments, Columbus, OH, USA) and TreadScan software (Clever Sys Inc., Reston, VA, USA; Fig. S1). Treadmill speed was 19 cm/sec and 20 sec of video was analyzed (100 frames/second). Homolateral feet distance is the distance between the stride midpoints of front and rear feet. Left feet and right feet distances were averaged. The maximum foot distance from transverse plane was averaged between front left and right and rear left and right feet.
Latency to fall or complete two passive rotations on a rotarod was measured in both mouse lines across a 5‐minute trial with continuous acceleration from 4 to 40 rotations/minute. Scores were averaged across four trials with 15‐minute inter‐trial intervals.
Maximum forelimb grip strength was measured in both mouse lines and scores were averaged across five consecutive trials.
Histological analysis
Periodic acid‐Schiff diastase (PASD) staining was performed. Slides were scanned, and PBs were quantified based on pixel color (HistoQuant; 3DHistech, Budapest, Hungary) and reported as percent area covered by PBs. Liver PBs were classified as having an area greater than 50 μm2. Glial fibrillary acidic protein (GFAP) and allograft inflammatory factor 1 (AIF1) immunohistochemistry was conducted to assess astro‐ and micro‐gliosis, respectively, using rabbit polyclonal anti‐GFAP (1:200; BioLegend, San Diego, CA, USA) and anti‐AIF1 (1:2000; Wako Chemicals, Richmond, VA, USA) antibodies.
Glycogen quantification
Total brain, skeletal muscle, and liver glycogen were extracted, purified, and quantified as previously described 11 and reported as μmol glucose/g of tissue (fresh weight).
Statistical analysis
Survival curves were compared using log‐rank and log‐rank pairwise comparisons with Bonferroni‐adjusted significance thresholds. The remaining data are presented as mean ± standard error. Statistical analyses included one‐ or two‐way analysis of variance and Tukey–Kramer multiple comparisons, unpaired two‐tailed t‐tests, or Kruskal–Wallis test and Dunn’s multiple comparisons for nonparametric data. The significance threshold of 0.05 was used. Pairwise comparison results are depicted using letters on the graphs (bars sharing letters are not “significantly different,” bars that do not share letters are “significantly different”) and superscript numbers enable reporting of pairwise levels of significance (e.g., “a1” and “a2” are significantly different than “b”, but to different levels of significance). Statistics were calculated using GraphPad Prism 7.0b (GraphPad Software, San Diego, CA, USA).
Results
Mono‐allelic Gys1 knockout rescues Gbe1ys/ys life span, reduced body mass, and behavioral phenotype
In the Gbe1ys Gys1 − mouse line, Gbe1ys / ys mice had a shortened median life span of 10.8 months. This was rescued in Gbe1ys / ys Gys1 +/− animals to indistinguishable from controls (Fig. 1A). Disease progression‐associated body mass decline observed in male Gbe1ys / ys mice between ages 7 and 9 months was also rescued (Fig. 1B).
Figure 1.
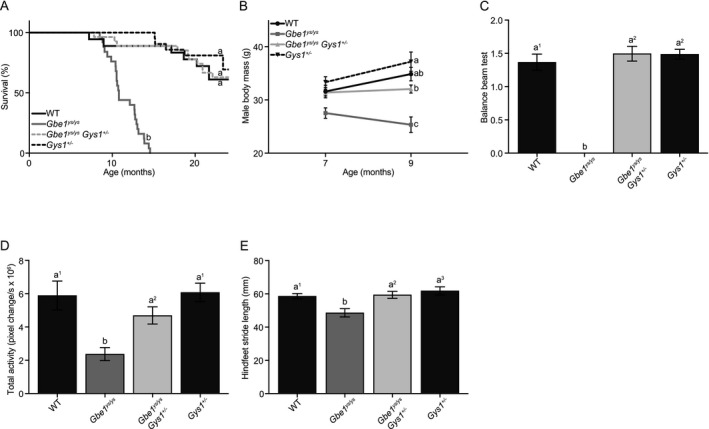
Mono‐allelic Gys1 knockout rescues Gbe1ys / ys disease phenotype. (A) Survival curves for wild‐type (WT), Gbe1ys / ys, Gbe1ys / ys Gys1 +/− and Gys1 +/− mice (n = 15–25; curve comparison with log‐rank test: P ≤ 0.0001, pairwise comparison with log‐rank test with a Bonferroni‐corrected significance threshold: a vs. b P ≤ 0.0001). (B) Body mass of 7‐ and 9‐month‐old male mice (n = 8–18; two‐way analysis of variance [ANOVA; effect of genotype]: P ≤ 0.0001, Tukey–Kramer multiple comparisons test [9‐month time point]: a vs. b P ≤ 0.01, a, ab vs. c P ≤ 0.0001, b vs. c P ≤ 0.001). (C) Balance beam testing in 10.5‐ to 14‐month‐old mice (n = 6–8; Kruskal–Wallis test: P ≤ 0.001, Dunn’s multiple comparisons test: a1 vs. b P ≤ 0.05, a2 vs. b P ≤ 0.01). (D) Total activity (n = 10–15; ANOVA: P ≤ 0.0001, Tukey–Kramer multiple comparisons test: a1 vs. b P ≤ 0.0001, a2 vs. b P ≤ 0.05) and (E) hindfeet stride length (n = 15–17; ANOVA: P ≤ 0.001, Tukey–Kramer multiple comparisons test: a1 vs. b P ≤ 0.05, a2 vs. b P ≤ 0.01, a3 vs. b P ≤ 0.001) in 9‐month‐old mice. (B–E) Data presented as mean ± standard error of the mean.
Balance beam testing in 10.5‐ to 14‐month‐old mice found Gbe1ys / ys mice unable to cross with or without foot faults, while Gbe1ys / ys Gys1 +/− latency to cross and foot faults were normalized to that of controls (Fig. 1C). Total spontaneous activity and hindfeet stride length were both reduced in 9‐month‐old Gbe1ys / ys mice and rescued in Gbe1ys / ys Gys1 +/− mice (Fig. 1D and E).
Mono‐ and bi‐allelic Ppp1r3c knockout improve Gbe1ys/ys life span, morphology, and behavioral phenotype
In the Gbe1ys Ppp1r3c − mouse line, the median Gbe1ys / ys life span was 12.4 months (mouse line variance in median life span likely due to differences in genetic background). This was extended to 13.2 months in Gbe1ys / ys Ppp1r3c +/− and 21.6 months in Gbe1ys / ys Ppp1r3c −/− mice (Fig. 2A). Although almost doubled in Gbe1ys / ys Ppp1r3c −/− mice, life span was not normalized to that of controls. Male body mass did not differ between genotypes at 7 months of age, but by 12 months Gbe1ys / ys mice had a significantly lower average body mass (Fig. 2 B). Gbe1ys / ys Ppp1r3c +/− and Gbe1ys / ys Ppp1r3c −/− mice did not lose body mass from 7 to 12 months of age, but the former genotype’s body mass trend did plateau. Gbe1ys / ys mice developed an overt hunched, kyphotic phenotype (Fig. S2) first visible at 4 months and progressing in severity to be the likely cause of a comparatively short body length by 12 to 14.5 months (Fig. 2C). Short body length was not observed in Gbe1ys / ys Ppp1r3c +/− or Gbe1ys / ys Ppp1r3c −/− mice at this age.
Figure 2.
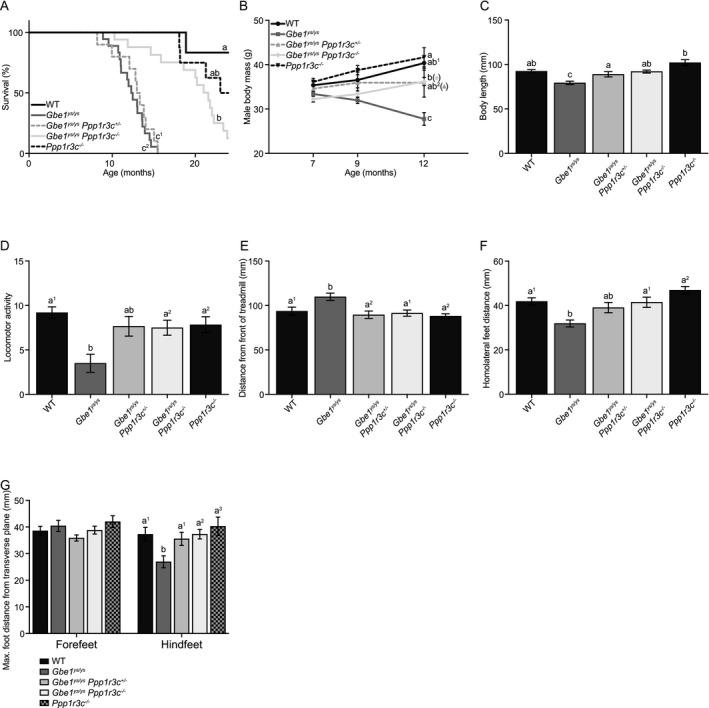
Mono‐ and bi‐allelic Ppp1r3c knockout improve Gbe1ys / ys disease phenotype. (A) Survival curves for wild‐type (WT), Gbe1ys / ys, Gbe1ys / ys Ppp1r3c +/−, Gbe1ys / ys Ppp1r3c −/−, and Ppp1r3c −/− mice (n = 6–18; curve comparison with log‐rank test: P ≤ 0.0001, pairwise comparison with log‐rank test with a Bonferroni‐corrected significance threshold: a vs. b P ≤ 0.005, a vs. c1 P ≤ 0.001, a vs. c2 P ≤ 0.0001, ab, b vs. c1, c2 P ≤ 0.0001). (B) Body mass was measured at 7, 9, and 12 months of age in male mice (n = 5–13; two‐way analysis of variance [ANOVA; effect of genotype]: P ≤ 0.0001, Tukey–Kramer multiple comparisons test [12‐month time point]: a vs. b P ≤ 0.05, a, ab1 vs. c P ≤ 0.0001, ab2 vs. c P ≤ 0.01, b vs. c P ≤ 0.001). (C) Body length was measured in 12‐ to 14.5‐month‐old mice (n = 7–9; ANOVA: P ≤ 0.0001, Tukey–Kramer multiple comparisons test: a vs. b P ≤ 0.01, a vs. c P ≤ 0.05, ab vs. c P ≤ 0.01, b vs. c P ≤ 0.0001). (D) Scoring of locomotor activity (n = 8–16; ANOVA: P ≤ 0.01, Tukey–Kramer multiple comparisons test: a1 vs. b P ≤ 0.01, a2 vs. b P ≤ 0.05), (E) distance from front of treadmill (n = 7–9; ANOVA: P ≤ 0.01, Tukey–Kramer multiple comparisons test: a1 vs. b P ≤ 0.05, a2 vs. b P ≤ 0.01), (F) homolateral feet distance (n = 7–9; ANOVA: P ≤ 0.0001, Tukey–Kramer multiple comparisons test: a1 vs. b P ≤ 0.01, a2 vs. b P ≤ 0.0001) and (G) maximum foot distance from transverse plane (n = 7–9; two‐way ANOVA [effect of genotype]: P ≤ 0.05, Tukey–Kramer multiple comparisons test: a1 vs. b P ≤ 0.05, a2 vs. b P ≤ 0.01, a3 vs. b P ≤ 0.001) in 12‐ to 14.5‐month‐old mice. (B–G) Data presented as mean ± standard error of the mean.
Spontaneous locomotor activity in a gridded chamber was significantly lower in 12‐ to 14.5‐month‐old Gbe1ys / ys mice compared to Gbe1ys / ys Ppp1r3c −/− and control mice (Fig. 2D). Automated gait analysis of similarly aged mice identified several abnormalities collectively indicative of Gbe1ys / ys locomotor impairment. Gbe1ys / ys mice were positioned further from the front of the treadmill, less able to keep pace with the treadmill speed, than Gbe1ys / ys Ppp1r3c +/−, Gbe1ys / ys Ppp1r3c −/−, and control mice (Fig. 2E). Gbe1ys / ys mice had a reduced distance between homolateral front and rear stride midpoints, a characteristic rescued in Gbe1ys / ys Ppp1r3c −/− mice (Fig. 2F). Further interrogation revealed no genotype differences in the maximum forefeet distance from transverse plane, but shorter hindfeet distances in Gbe1ys / ys mice (Fig. 2G). These findings are in alignment with previous reporting of progressive hindlimb dysfunction and paralysis in Gbe1ys / ys mice. 18
In both mouse lines, no genotype‐specific phenotype was observed in rotarod latency to fall (9‐month‐old mice) or maximum forelimb grip strength (9‐month‐old Gbe1ys Gys1 − line mice, 12‐ to 14.5‐month‐old Gbe1ys Ppp1r3c − line mice; data not shown).
Of note, while GYS1 or PPP1R3C deficiency improved, to varying extents, the Gbe1ys / ys phenotype at the time of measurement, Gbe1ys / ys Gys1 +/−, Gbe1ys / ys Ppp1r3c +/−, and Gbe1ys / ys Ppp1r3c −/− mice did develop the stereotypical observable disease phenotype (kyphosis, reduced movement, abnormal gait) as they aged.
Mono‐allelic Gys1 knockout reduces PBs, glycogen accumulation, and gliosis in brain and reduces PBs in skeletal muscle, heart and liver
In brain, mono‐allelic Gys1 knockout in 8.5‐ to 10.5‐month‐old Gbe1ys / ys mice reduced PASD‐positive PB accumulation (Fig. 3A–D). Quantification of hippocampal area covered by PBs confirmed a greater than 50% PB reduction in Gbe1ys / ys Gys1 +/− mice (Fig. 4A). Measurement of total brain glycogen content, consisting of both PB and non‐PB (adequately branched and soluble) glycogen, also found mono‐allelic Gys1 knockout to approximately halve glycogen levels: Gbe1ys / ys Gys1 +/− mice did not accumulate the abnormal glycogen levels seen in Gbe1ys / ys mice, and Gys1 +/− control mice had almost half the glycogen content of wild‐type mice (Fig. 4B). Immunohistochemical assessment of neuroinflammatory markers GFAP and AIF1 showed astro‐ and micro‐gliosis in Gbe1ys / ys mice and not in Gbe1ys / ys Gys1 +/− mice (Fig. 3E–L).
Figure 3.
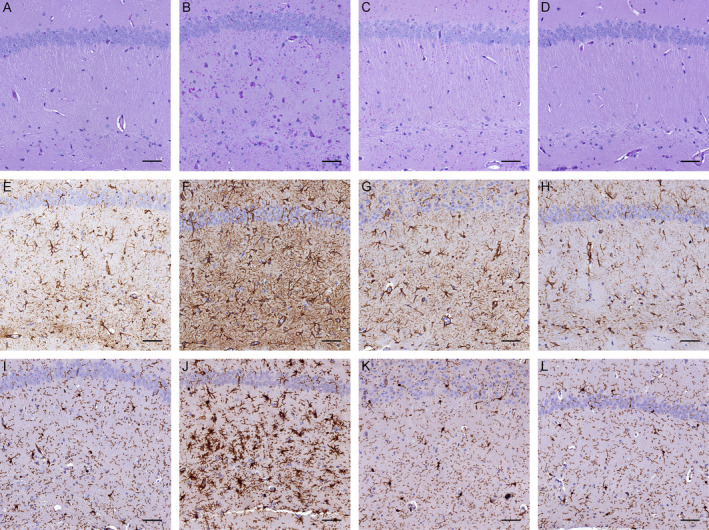
Mono‐allelic Gys1 knockout reduces polyglucosan body (PB) accumulation and gliosis in Gbe1ys / ys mice. Hippocampal (A–D) periodic acid‐Schiff diastase (PASD) staining and (E–H) anti‐GFAP and (I–L) anti‐AIF1 immunohistochemistry of 10.5‐month‐old (A, E, I) wild‐type, (B, F, J) Gbe1ys / ys, (C, G, K) Gbe1ys / ys Gys1 +/− and (D, H, L) Gys1 +/− mice. Scale bars = 50 μm.
Figure 4.
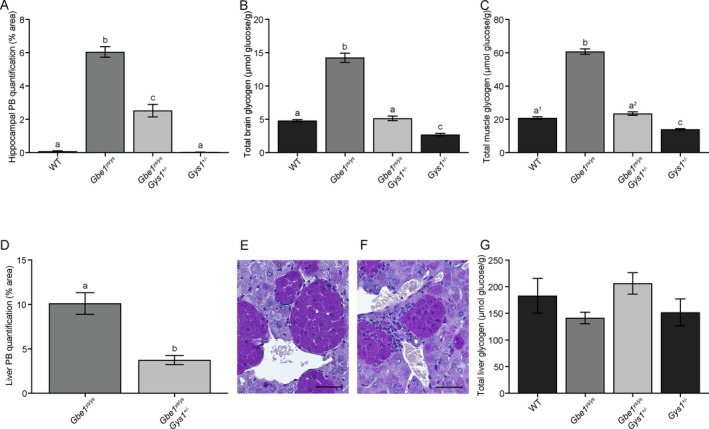
Mono‐allelic Gys1 knockout reduces polyglucosan body (PB) and disease‐associated glycogen accumulation in brain, skeletal muscle, and liver of Gbe1ys / ys mice. Quantification of (A) hippocampal area covered by PBs (one‐way analysis of variance [ANOVA]: P ≤ 0.0001, Tukey–Kramer multiple comparisons test: a vs. b vs. c P ≤ 0.0001), (B) total brain glycogen (ANOVA: P ≤ 0.0001, Tukey–Kramer multiple comparisons test: a, c vs. b P ≤ 0.0001, a vs. c P ≤ 0.01) and (C) total skeletal muscle glycogen (ANOVA: P ≤ 0.0001, Tukey–Kramer multiple comparisons test: a1, a2, c vs. b P ≤ 0.0001, a1 vs. c P ≤ 0.01, a2 vs. c P ≤ 0.0001). (D) Quantification of liver area covered by macrophage‐associated PBs (unpaired two‐tailed t‐test: a vs. b P ≤ 0.001). Macrophage‐associated PBs in (E) Gbe1ys / ys and (F) Gbe1ys / ys Gys1 +/− liver; compact macrophage nuclei distinguishable from the large and capacious nuclei of hepatocytes. Whether these macrophages are liver‐resident Kupffer cells or of other origin was not determined. Scale bars = 50 μm. (G) Quantification of total liver glycogen. Mice are age‐matched cohorts of 8.5‐ to 10.5‐month‐old mice (n = 5–7). Data presented as mean ± standard error of the mean. WT = wild‐type.
In skeletal muscle, PBs were significantly reduced in 8.5‐ to 10.5‐month‐old Gbe1ys / ys Gys1 +/− compared to Gbe1ys / ys mice (Fig. 5A–D). As in the brain, total muscle glycogen content was again almost halved with mono‐allelic Gys1 knockout in Gbe1ys / ys Gys1 +/− and Gys1 +/− mice compared to Gbe1ys/ys and wild‐type mice, respectively (Fig. 4C). In the heart, PBs were completely absent in Gbe1ys / ys Gys1 +/− mice (Fig. 5E–H).
Figure 5.
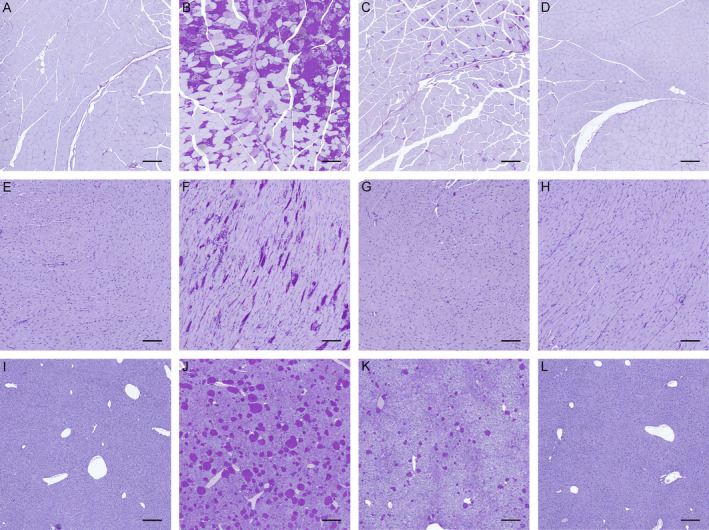
Mono‐allelic Gys1 knockout reduces polyglucosan body (PB) accumulation in murine Gbe1ys / ys skeletal muscle, heart, and liver. Periodic acid‐Schiff diastase (PASD) staining of (A–D) skeletal muscle, (E–H) heart, and (I–L) liver from 10.5‐month‐old (A, E, I) wild‐type, (B, F, J) Gbe1ys / ys, (C, G, K) Gbe1ys / ys Gys1 +/− and (D, H, L) Gys1 +/− mice. (A–D, I–L) Scale bars = 200 μm. (E–H) Scale bars = 100 μm.
In liver, by histochemical analysis PBs in 8.5‐ to 10.5‐month‐old Gbe1ys / ys Gys1 +/− mice were significantly reduced compared to Gbe1ys / ys mice (Figs. 4D and 5I–L). This was surprising as hepatocytes do not express GYS1, but rather the liver‐specific isoform GYS2. 20 However, closer evaluation of the liver sections revealed that the PBs that were reduced in Gbe1ys / ys Gys1 +/− mice were not ones present in hepatocytes, but rather extremely dense and prominent PBs found in macrophages (Fig. 4E and F). With biochemical measurement, there was no significant difference in total liver glycogen between genotypes (Fig. 4G), likely because the reduction in the macrophage PB glycogen was below our detection limit in the context of the overall large amount of glycogen in the liver as a whole.
PASD staining of brain, muscle, heart, and liver from 26‐ to 28‐month‐old Gbe1ys / ys Gys1 +/− mice showed that PBs had continued to accumulate in brain, muscle, and liver since the 8.5‐ to 10.5‐month time point, and continued to remain largely absent in heart (Fig. S3).
Mono‐ and bi‐allelic Ppp1r3c knockout reduce PBs, glycogen accumulation, and gliosis in brain and reduce glycogen in skeletal muscle and liver
In brain, PASD staining showed fewer PBs in 12‐ to 14.5‐month‐old Gbe1ys / ys Ppp1r3c +/− and Gbe1ys / ys Ppp1r3c −/− mice compared to Gbe1ys / ys mice (Fig. 6A–E), with hippocampal PB quantification confirming reductions of approximately 25% and 55%, respectively (Fig. 7A). Of qualitative note, PBs in Gbe1ys / ys Ppp1r3c −/− brain appeared more homogenous in texture and circular shape, and less profuse in regions such as the stratum lacunosum moleculare of the hippocampus. Comparison to 3‐ and 6‐month‐old Gbe1ys / ys mice confirmed this was not simply a function of reduced PB load (data not shown). Quantification of total brain glycogen found Gbe1ys / ys Ppp1r3c +/− and Gbe1ys / ys Ppp1r3c −/− mice to have significantly less accumulated glycogen (Fig. 7B), and anti‐GFAP and ‐AIF1 immunohistochemistry indicated reduced gliosis (Fig. 6F–O).
Figure 6.
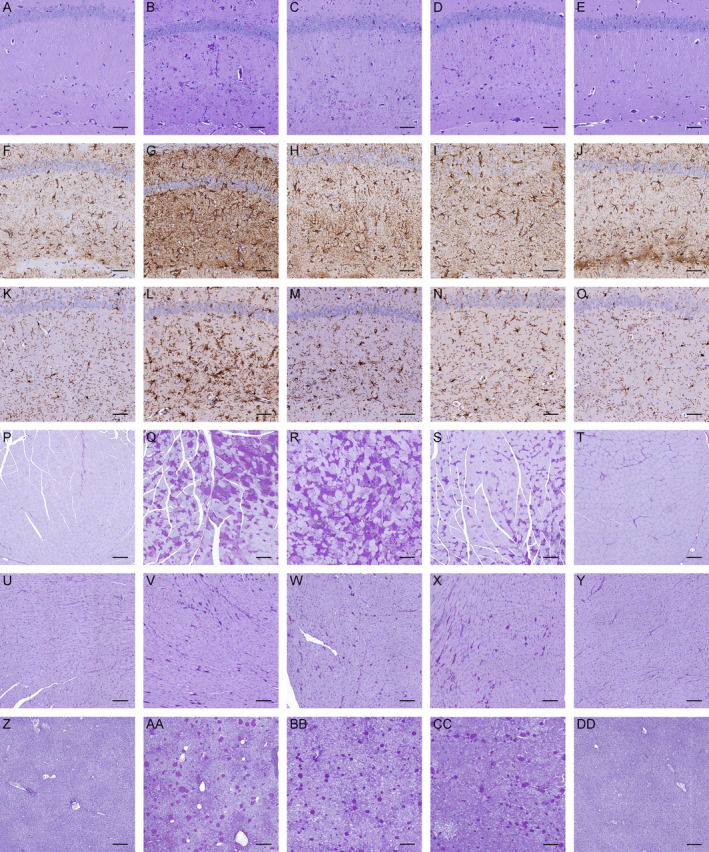
Mono‐ and bi‐allelic Ppp1r3c knockout reduce polyglucosan body (PB) accumulation and gliosis in Gbe1ys / ys brain, and bi‐allelic Ppp1r3c knockout reduces PBs in skeletal muscle, but not heart or liver. Periodic acid‐Schiff diastase (PASD) staining of (A–E) hippocampus, (P–T) skeletal muscle, (U–Y) heart and (Z‐DD) liver, and (F–J) anti‐GFAP and (K–O) anti‐AIF1 immunohistochemistry of 13.5‐month‐old (A, F, K, P, U, Z) wild‐type, (B, G, L, Q, V, AA) Gbe1ys / ys, (C, H, M, R, W, BB) Gbe1ys / ys Ppp1r3c +/−, (D, I, N, S, X, CC) Gbe1ys / ys Ppp1r3c −/− and (E, J, O, T, Y, DD) Ppp1r3c −/− mice. (A–O) Scale bars = 50 μm. (P‐T, Z‐DD) Scale bars = 200 μm. (U‐Y) Scale bars = 100 μm.
Figure 7.
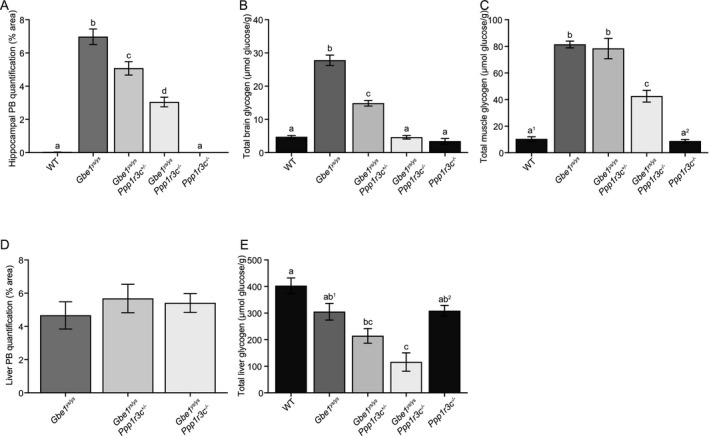
Mono‐ and bi‐allelic Ppp1r3c knockout reduce polyglucosan bodies (PBs) and disease‐associated glycogen accumulation in brain, with nuanced effects on skeletal muscle and liver. Quantification of (A) hippocampal area covered by PBs (one‐way analysis of variance [ANOVA]: P ≤ 0.0001, Tukey–Kramer multiple comparisons test: a vs. b, c, d P ≤ 0.0001, b vs. d P ≤ 0.0001, b, d vs. c P ≤ 0.01), (B) total brain glycogen (ANOVA: P ≤ 0.0001, Tukey–Kramer multiple comparisons test: a vs. b vs. c P ≤ 0.0001) and (C) total skeletal muscle glycogen (ANOVA: P ≤ 0.0001, Tukey–Kramer multiple comparisons test: a1, a2 vs. b P ≤ 0.0001, a1 vs. c P ≤ 0.001, a2 vs. c P ≤ 0.0001). Quantification of (D) liver area covered by PBs and (E) total liver glycogen (ANOVA: P ≤ 0.0001, Tukey–Kramer multiple comparisons test: a vs. bc P ≤ 0.01, a, ab2 vs. c P ≤ 0.001, ab1 vs. c P ≤ 0.01). Mice are age‐matched cohorts of 12‐ to 14.5‐month‐old mice (n = 4–6). Data presented as mean ± standard error of the mean. WT = wild‐type.
In skeletal muscle, bi‐allelic Ppp1r3c knockout in 12‐ to 14.5‐month‐old Gbe1ys / ys Ppp1r3c −/− mice reduced PBs (Fig. 6P–T) and almost halved total glycogen content (Fig. 7C), whereas mono‐allelic Ppp1r3c knockout had no discernable effect on either. Both mono‐ and bi‐allelic Ppp1r3c knockout had no observable effect on heart PBs although greater inter‐mouse variability in heart PBs in this line could have obscured a subtle effect (Fig. 6U–Y).
In liver, PPP1R3C deficiency appeared to have the opposite effect of GYS1 deficiency. Bi‐allelic Ppp1r3c knockout had no effect on the macrophage‐associated liver PBs (Fig. 6Z–DD and Fig. 7D), but reduced total liver glycogen in 12‐ to 14.5‐month‐old Gbe1ys / ys Ppp1r3c −/− mice (Fig. 7E).
PASD staining of brain, muscle, heart, and liver from 22‐ to 24‐month‐old Gbe1ys / ys Ppp1r3c −/− mice showed that PBs had continued to accumulate in all four tissues since the 12‐ to 14.5‐month time point (Fig. S4). Of note, in both mouse lines, PASD staining showed liver tumors in old Gbe1ys / ys Gys1 +/− (26‐ to 28‐month‐old) and Gbe1ys / ys Ppp1r3c −/− (22‐ to 24‐month‐old) mice. Liver tumors were not present in old control mice (wild‐type, Gys1 +/−, Ppp1r3c −/−) and rarely observed in younger mice of any genotype. Liver tumors have been described as possible long‐term complications of GBE1 deficiency‐induced liver pathophysiology. 21
Discussion
The aim of this study was to assess the potential efficacy of GYS1 and PPP1R3C as therapeutic targets for the adult‐onset, neurological GSD IV variant APBD, with the rationale of rebalancing the ratio between glycogen chain elongation and branching. Deficiency of both targets improved the murine phenotype, critically reducing PBs, abnormal glycogen accumulation, and markers of neuroinflammation in the brain. These findings establish the first in vivo validated therapeutic targets for APBD and support GYS1‐ and PPP1R3C‐targeted therapeutic development. Varied effects on PBs and abnormal glycogen in skeletal muscle, heart, and liver inform the broader therapeutic applicability of these targets.
Life span and morphological improvement are noteworthy, and interpretation of these gross phenotypic characteristics necessitates consideration of the inherent limitations of disease models. The APBD mouse model faithfully recapitulates many characteristics of the human disease, but the causes of murine death and body mass decline are unknown. To speculate, near‐doubling of Gbe1ys / ys Ppp1r3c −/− life span in the absence of reduced heart or liver PBs suggests the cause of death may be of neurological and/or muscular origin. Loss of body mass could be due to, for example, muscle atrophy, as observed in APBD and other GSD IV variants, 2 , 4 shifts in systemic energy metabolism, or cachexia. The observed and rescued kyphosis, with body length as a crude proxy, is a common phenotype in neurodegenerative and neuromuscular disease mouse models 22 , 23 and is reported in APBD. 2 Consideration of the underlying pathology informs the relevancy of these traits to human APBD and is especially important given the poorly delineated relationship between residual GBE1 enzymatic activity and GSD IV variant presentation.
Behavioral tests assaying neuromuscular function showed rescue of the clinically relevant phenotypes of balance, gait and motor coordination, and activity abnormalities. Of note, in the Gbe1ys Ppp1r3c − mouse line, reduced homolateral feet distance could be a function of a shorter body length. However, the hindfeet‐specific reduction in maximum distance from transverse plane, in addition to the absence of a measurable phenotype in rotarod and forelimb grip strength testing, suggest the abnormal gait phenotype is predominantly due to hindlimb dysfunction. This would be consistent with an underlying neuropathy rather than exclusively a myopathy. Paraparesis, presenting as gait difficulties with subsequent loss of independent walking, is a cardinal APBD symptom 1 and rescue of a similar phenotype with GYS1 and PPP1R3C deficiency in the mouse model supports the likelihood of the murine results’ predictive validity.
Both GYS1 and PPP1R3C deficiency improved the APBD neuropathological features of PB profusion, gliosis, and glycogen accumulation. Comparison of the extent of PB and glycogen reduction finds GYS1 to be the more sensitive therapeutic target in brain, with mono‐allelic Gys1 knockout having an analogous effect to bi‐allelic Ppp1r3c knockout, relative to Gbe1ys / ys mice in their respective lines. Another difference was the relatively less uniform effect of PPP1R3C versus GYS1 deficiency on PBs across the brain. This may at least in part be due to the brain utilizing four glycogen‐targeting PP1 regulatory subunits (PPP1R3D to PPP1R3G), in addition to PPP1R3C, in the targeting of PP1 to glycogen. 24 , 25 These separate glycogen‐targeting PP1 subunits could potentially also in part explain the more spherical shape of remaining PBs in Gbe1ys / ys Ppp1r3c −/− mice. While PPP1R3C is the dominant subunit in murine astrocytes, PPP1R3D is expressed at levels equal to PPP1R3C in neurons, 24 , 25 and thus PPP1R3C deficiency may be expected to impact neuronal PBs less than astrocytic PBs. A study of cell‐type‐specific PB shapes in APBD has not been undertaken, but at least in the related polyglucosan disease, Lafora disease, neuronal PBs are spherical, while astrocytic PBs are more randomly structured. 26
Increased total glycogen in APBD mice comprises wild‐type levels of soluble glycogen and increased amounts of insoluble glycogen (the PBs). 11 Given the low amount of glycogen in brain, compared to, for example, liver, the multi‐fold increase in Gbe1ys / ys total brain glycogen is driven by the accumulation of insoluble, PB glycogen. The measured reduction of total brain glycogen in Gbe1ys / ys Gys1 +/− and Gbe1ys / ys Ppp1r3c −/− mice to wild‐type levels, despite the presence of some PBs, is therefore likely indicative of a significant reduction in insoluble glycogen and a partial reduction in soluble glycogen.
While the main aim of this study was to assess the effect of GYS1 and PPP1R3C deficiency on the Gbe1ys / ys neurological phenotype, analysis of skeletal muscle, heart, and liver informs i) the above‐discussed contribution of these tissues to gross Gbe1ys / ys phenotypic traits like life span, ii) the potential implications of a GYS1‐ or PPP1R3C‐targeted APBD therapeutic with systemic bioavailability, and iii) the translatability of these targets to GSD IV variants involving myopathy, cardiomyopathy, or liver disease.
In skeletal muscle and heart, mono‐allelic Gys1 knockout had a greater effect on PB and glycogen reduction than bi‐allelic Ppp1r3c knockout, relative to their respective Gbe1ys / ys and wild‐type littermates. The lack of observable PB reduction in Gbe1ys / ys Ppp1r3c +/− skeletal muscle and in Gbe1ys / ys Ppp1r3c +/− and Gbe1ys / ys Ppp1r3c −/− heart lends to consideration of the roles of the seven known glycogen‐targeting PP1 regulatory subunits. In murine skeletal muscle, several other glycogen‐targeting subunits are expressed with, for example, knockout of PP1 regulatory subunit 3A reducing total glycogen by 90%. 27 In murine heart, the roles of PP1 glycogen‐targeting subunits are poorly understood. Parallel delineation of the unique, shared, and/or compensatory functions of the glycogen‐targeting subunits across tissues, and their respective interactions with the different PP1 catalytic subunits is needed to better understand the complex role of these subunits in glycogen metabolism regulation.
Unlike in the brain and muscle, the lack of a multi‐fold increase in total Gbe1ys / ys liver glycogen is indicative of a different relationship between GBE1 deficiency and prototypical PB accumulation in the liver. Distinctions in liver glycogen are precedent in its function and metabolism, including the utilization of several liver‐specific isoforms of glycogen metabolizing enzymes. Hepatocytes, the primary glycogen storage cell type, express GYS2, not GYS1, and therefore no reduction in total glycogen with GYS1 deficiency was not unexpected. PPP1R3C is one of three PP1 glycogen‐targeting subunits expressed in murine liver 28 and accordingly, its deficiency contributed to reduced total glycogen in Gbe1ys / ys Ppp1r3c +/− and Gbe1ys / ys Ppp1r3c −/− liver.
The findings of diffuse and dense PB accumulation in hepatic macrophages and their reduction in Gbe1ys / ys Gys1 +/− mice highlight a relatively unexplored aspect of GSD IV pathology. Hypertrophic hepatic macrophages have been previously described in Gbe1ys / ys murine liver, 29 and PBs have been commonly reported in hepatic and extra‐hepatic macrophages across GSD IV variants. 30 , 31 It remains unknown whether PBs in macrophages are consequent of endogenous glycogen metabolism and/or engulfment of exogenous PBs. Macrophages have been shown to actively metabolize glycogen, with increased synthesis and Gys1 expression regulating their inflammatory phenotype, 32 however, it remains unclear if GBE1 deficiency in this metabolic context would lead to PB formation. Speculation regarding potential macrophage engulfment of exogenous PBs is complicated by the heterogeneous roles of these cells in local and systemic immune responses. 33 Our data suggest that the liver macrophage PBs do not, at least in large part, originate in hepatocytes, because otherwise the significant reduction in hepatocyte glycogen by PPP1R3C deficiency should have impacted macrophage PB quantities. Interrogation of the reparative and/or pathogenic roles of the immune response in GSD IV, and particularly in the nervous system in APBD, would be valuable.
We have validated GYS1 and PPP1R3C as two therapeutic targets for APBD and found the comparative efficacy of GYS1‐targeting superior. GYS1 appears to afford wide therapeutic and safety windows, with 50% knockdown sufficing to rescue the disease model behavioral phenotype and significantly slow PB accumulation. Given the adult‐onset and gradually progressing symptoms of APBD, a therapy that halts or slows the causative pathology should afford major patient benefit. The anticipated safety profile of GYS1 knockdown is furthermore favorable as humans with one null GYS1 allele are healthy. 34 GYS1 could be downregulated at the DNA, RNA, or protein levels, and progress is already being made at least in the latter with promising compounds including guaiacol 35 and imidazole analogs. 36 PPP1R3C deficiency has to date not been associated with a pathological state in humans.
Since GYS1 is also the GYS isoform of skeletal muscle and heart, a therapeutic agent for APBD should also be useful in the childhood variant of GSD IV characterized by myopathy and cardiomyopathy. The previously similarly demonstrated efficacy of genetic targeting of Gys1 and Ppp1r3c in rescuing Lafora disease mouse models predicts broad utility of this approach including in yet other glycogen storage and polyglucosan diseases, such as phosphofructokinase‐, RBCK1‐ or glycogenin‐deficiencies, 37 and thus a more favorable path to drug development in diseases that are individually orphan.
Authors’ Contributions
E.E.C., B.A.P., and B.A.M. contributed to the conception and design of the study. E.E.C., P.W., X.Z., J.J.C., J.W.S., M.A.S., Y.X., C.S.B., and A.M.P. contributed to the acquisition of data. E.E.C., J.J.C., J.W.S., B.M.E., B.A.P., and B.A.M. contributed to the analysis of data. E.E.C. and B.A.M. contributed to the drafting of manuscript and figures. P.J.R., A.A.D‐R., and H.O.A. contributed animal models and review of the manuscript.
Conflicts of Interest
Nothing to report.
Supporting information
Figure S1. Illustrative diagram of gait analysis methodology and parameters.
Figure S2. Progressive kyphotic phenotype in (A) 5‐month‐old and (B) 12.5‐month‐old Gbe1ys / ys mice, compared to normal phenotype in 15‐month‐old (C) wild‐type and (D) Ppp1r3c −/− mice.
Figure S3. Mono‐allelic Gys1 knockout slows the continual accumulation of polyglucosan bodies (PBs) in Gbe1ys / ys mice. Periodic acid‐Schiff diastase (PASD) staining of (A) hippocampus, (B) skeletal muscle, (C) heart, and (D) liver in 26‐ to 28‐month‐old Gbe1ys / ys Gys1 +/− mice. (A) Scale bars = 50 μm. (B and D) Scale bars = 200 μm. (C) Scale bars = 100 μm.
Figure S4. Bi‐allelic Ppp1r3c knockout slows continual accumulation of polyglucosan bodies (PBs) in Gbe1ys / ys mice. Periodic acid‐Schiff diastase (PASD) staining of (A) hippocampus, (B) skeletal muscle, (C) heart, and (D) liver in 22‐ to 24‐month‐old Gbe1ys / ys Ppp1r3c −/− mice. (A) Scale bars = 50 μm. (B, D) Scale bars = 200 μm. (C) Scale bars = 100 μm.
Acknowledgments
This work was funded by the Adult Polyglucosan Body Disease Research Foundation and the National Institutes of Health under award numbers P01NS097197 and R01DK27221. B.A.M. holds the University of Texas Southwestern Jimmy Elizabeth Westcott Chair in Pediatric Neurology. M.A.S. is supported by a Mater Research McGuckin Early Career Fellowship, the University of Queensland’s Amplify Initiative and Mater Foundation. We thank Dr B. Verhalen for help in literature review.
Funding Information
This work was funded by the Adult Polyglucosan Body Disease Research Foundation and the National Institutes of Health under award numbers P01NS097197 and R01DK27221. B.A.M. holds the University of Texas Southwestern Jimmy Elizabeth Westcott Chair in Pediatric Neurology. M.A.S. is supported by a Mater Research McGuckin Early Career Fellowship, the University of Queensland’s Amplify Initiative and Mater Foundation.
Funding Statement
This work was funded by National Institutes of Health grants P01NS097197 and R01DK27221; Adult Polyglucosan Body Disease Research Foundation grant ; Mater Research McGuckin Early Career Fellowship grant ; the University of Queensland’s Amplify Initiative and Mater Foundation grant .
References
- 1. Mochel F, Schiffmann R, Steenweg ME, et al. Adult polyglucosan body disease: natural history and key magnetic resonance imaging findings. Ann Neurol 2012;72:433–441. [DOI] [PMC free article] [PubMed] [Google Scholar]
- 2. Robitaille Y, Carpenter S, Karpati G, DiMauro S. A distinct form of adult polyglucosan body disease with massive involvement of central and peripheral neuronal processes and astrocytes: a report of four cases and a review of the occurrence of polyglucosan bodies in other conditions such as Lafora’s disease and normal ageing. Brain 1980;103:315–336. [DOI] [PubMed] [Google Scholar]
- 3. Lossos A, Barash V, Soffer D, et al. Hereditary branching enzyme dysfunction in adult polyglucosan body disease: a possible metabolic cause in two patients. Ann Neurol 1991;30:655–662. [DOI] [PubMed] [Google Scholar]
- 4. Moses SW, Parvari R. The variable presentations of glycogen storage disease type IV: a review of clinical, enzymatic and molecular studies. Curr Mol Med 2002;2:177–188. [DOI] [PubMed] [Google Scholar]
- 5. Akman HO, Kakhlon O, Coku J, et al. Deep intronic GBE1 mutation in manifesting heterozygous patients with adult polyglucosan body disease. JAMA Neurol 2015;72:441–445. [DOI] [PubMed] [Google Scholar]
- 6. Froese DS, Michaeli A, McCorvie TJ, et al. Structural basis of glycogen branching enzyme deficiency and pharmacologic rescue by rational peptide design. Hum Mol Genet 2015;24:5667–5676. [DOI] [PMC free article] [PubMed] [Google Scholar]
- 7. Lossos A, Meiner Z, Barash V, et al. Adult polyglucosan body disease in Ashkenazi Jewish patients carrying the Tyr329Ser mutation in the glycogen‐branching enzyme gene. Ann Neurol 1998;44:867–872. [DOI] [PubMed] [Google Scholar]
- 8. Roach PJ, Depaoli‐Roach AA, Hurley TD, Tagliabracci VS. Glycogen and its metabolism: some new developments and old themes. Biochem J 2012;441:763–787. [DOI] [PMC free article] [PubMed] [Google Scholar]
- 9. Mercier C, Whelan WJ. Further characterization of glycogen from type‐IV glycogen‐storage disease. Eur J Biochem 1973;40:221–223. [DOI] [PubMed] [Google Scholar]
- 10. Gidley MJ, Bulpin PV. Crystallisation of malto‐oligosaccharides as models of the crystalline forms of starch: minimum chain‐length requirement for the formation of double helices. Carbohydr Res 1987;161:291–300. [Google Scholar]
- 11. Sullivan MA, Nitschke S, Skwara EP, et al. Skeletal muscle glycogen chain length correlates with insolubility in mouse models of polyglucosan‐associated neurodegenerative diseases. Cell Rep 2019;27:1334–1344. [DOI] [PMC free article] [PubMed] [Google Scholar]
- 12. Klein CJ, Boes CJ, Chapin JE, et al. Adult polyglucosan body disease: case description of an expanding genetic and clinical syndrome. Muscle Nerve 2004;29:323–328. [DOI] [PubMed] [Google Scholar]
- 13. Printen JA, Brady MJ, Saltiel AR. PTG, a protein phosphatase 1‐binding protein with a role in glycogen metabolism. Science 1997;275:1475–1478. [DOI] [PubMed] [Google Scholar]
- 14. Turnbull J, Epp JR, Goldsmith D, et al. PTG protein depletion rescues malin‐deficient Lafora disease in mouse. Ann Neurol 2014;75:442–446. [DOI] [PubMed] [Google Scholar]
- 15. Duran J, Gruart A, García‐Rocha M, et al. Glycogen accumulation underlies neurodegeneration and autophagy impairment in Lafora disease. Hum Mol Genet 2014;23:3147–3156. [DOI] [PubMed] [Google Scholar]
- 16. Pederson BA, Turnbull J, Epp JR, et al. Inhibiting glycogen synthesis prevents Lafora disease in a mouse model. Ann Neurol 2013;74:297–300. [DOI] [PMC free article] [PubMed] [Google Scholar]
- 17. Turnbull J, DePaoli‐Roach AA, Zhao X, et al. PTG depletion removes Lafora bodies and rescues the fatal epilepsy of Lafora disease. PLoS Genet 2011;7:e1002037. [DOI] [PMC free article] [PubMed] [Google Scholar]
- 18. Akman HO, Emmanuele V, Kurt YG, et al. A novel mouse model that recapitulates adult‐onset glycogenosis type 4. Hum Mol Genet 2015;24:6801–6810. [DOI] [PMC free article] [PubMed] [Google Scholar]
- 19. Pederson BA, Chen H, Schroeder JM, et al. Abnormal cardiac development in the absence of heart glycogen. Mol Cell Biol 2004;24:7179–7187. [DOI] [PMC free article] [PubMed] [Google Scholar]
- 20. Kaslow HR, Lesikar DD. Isozymes of glycogen synthase. FEBS Lett 1984;172:294–298. [DOI] [PubMed] [Google Scholar]
- 21. de Moor RA, Schweizer JJ, van Hoek B, et al. Hepatocellular carcinoma in glycogen storage disease type IV. Arch Dis Child 2000;82:479–480. [DOI] [PMC free article] [PubMed] [Google Scholar]
- 22. Guyenet SJ, Furrer SA, Damian VM, et al. A simple composite phenotype scoring system for evaluating mouse models of cerebellar ataxia. J Vis Exp 2010;39:1787. [DOI] [PMC free article] [PubMed] [Google Scholar]
- 23. Thomas PS Jr, Fraley GS, Damian V, et al. Loss of endogenous androgen receptor protein accelerates motor neuron degeneration and accentuates androgen insensitivity in a mouse model of X‐linked spinal and bulbar muscular atrophy. Hum Mol Genet 2006;15:2225–2238. [DOI] [PubMed] [Google Scholar]
- 24. Zhang Y, Chen K, Sloan SA, et al. An RNA‐sequencing transcriptome and splicing database of glia, neurons, and vascular cells of the cerebral cortex. J Neurosci 2014;34:11929–11947. [DOI] [PMC free article] [PubMed] [Google Scholar]
- 25. Zhang Y, Sloan SA, Clarke LE, et al. Purification and characterization of progenitor and mature human astrocytes reveals transcriptional and functional differences with mouse. Neuron 2016;89:37–53. [DOI] [PMC free article] [PubMed] [Google Scholar]
- 26. Augé E, Pelegrí C, Manich G, et al. Astrocytes and neurons produce distinct types of polyglucosan bodies in Lafora disease. Glia 2018;66:2094–2107. [DOI] [PMC free article] [PubMed] [Google Scholar]
- 27. Suzuki Y, Lanner C, Kim JH, et al. Insulin control of glycogen metabolism in knockout mice lacking the muscle‐specific protein phosphatase PP1G/RGL. Mol Cell Biol 2001;21:2683–2694. [DOI] [PMC free article] [PubMed] [Google Scholar]
- 28. Halpern KB, Shenhav R, Matcovitch‐Natan O, et al. Single‐cell spatial reconstruction reveals global division of labor in the mammalian liver. Nature 2017;542:352–356. [DOI] [PMC free article] [PubMed] [Google Scholar]
- 29. Yi H, Zhang Q, Brooks ED, et al. Systemic correction of murine glycogen storage disease type IV by an AAV‐mediated gene therapy. Hum Gene Ther 2016;28:286–294. [DOI] [PubMed] [Google Scholar]
- 30. Peress NS, DiMauro S, Roxburgh VA. Adult polysaccharidosis clinicopathological, ultrastructural, and biochemical features. Arch Neurol 1979;36:840–845. [DOI] [PubMed] [Google Scholar]
- 31. Schröder JM, May R, Shin YS, et al. Juvenile hereditary polyglucosan body disease with complete branching enzyme deficiency (type IV glycogenosis). Acta Neuropathol 1993;85:419–430. [DOI] [PubMed] [Google Scholar]
- 32. Ma J, Wei K, Liu J, et al. Glycogen metabolism regulates macrophage‐mediated acute inflammatory responses. Nat Commun 2020;11:1769. [DOI] [PMC free article] [PubMed] [Google Scholar]
- 33. Blériot C, Ginhoux F. Understanding the heterogeneity of resident liver macrophages. Front Immunol 2019;10:2694. [DOI] [PMC free article] [PubMed] [Google Scholar]
- 34. Kollberg G, Tulinius M, Gilljam T, et al. Cardiomyopathy and exercise intolerance in muscle glycogen storage disease 0. N Engl J Med 2007;357:1507–1514. [DOI] [PubMed] [Google Scholar]
- 35. Kakhlon O, Ferreira I, Solmesky LJ, et al. Guaiacol as a drug candidate for treating adult polyglucosan body disease. JCI Insight 2018;3:e99694. [DOI] [PMC free article] [PubMed] [Google Scholar]
- 36. Tang B, Frasinyuk MS, Chikwana VM, et al. Discovery and development of small‐molecule inhibitors of glycogen synthase. J Med Chem 2020;63:3538–3551. [DOI] [PMC free article] [PubMed] [Google Scholar]
- 37. Hedberg‐Oldfors C, Oldfors A. Polyglucosan storage myopathies. Mol Aspects Med 2015;46:85–100. [DOI] [PubMed] [Google Scholar]
Associated Data
This section collects any data citations, data availability statements, or supplementary materials included in this article.
Supplementary Materials
Figure S1. Illustrative diagram of gait analysis methodology and parameters.
Figure S2. Progressive kyphotic phenotype in (A) 5‐month‐old and (B) 12.5‐month‐old Gbe1ys / ys mice, compared to normal phenotype in 15‐month‐old (C) wild‐type and (D) Ppp1r3c −/− mice.
Figure S3. Mono‐allelic Gys1 knockout slows the continual accumulation of polyglucosan bodies (PBs) in Gbe1ys / ys mice. Periodic acid‐Schiff diastase (PASD) staining of (A) hippocampus, (B) skeletal muscle, (C) heart, and (D) liver in 26‐ to 28‐month‐old Gbe1ys / ys Gys1 +/− mice. (A) Scale bars = 50 μm. (B and D) Scale bars = 200 μm. (C) Scale bars = 100 μm.
Figure S4. Bi‐allelic Ppp1r3c knockout slows continual accumulation of polyglucosan bodies (PBs) in Gbe1ys / ys mice. Periodic acid‐Schiff diastase (PASD) staining of (A) hippocampus, (B) skeletal muscle, (C) heart, and (D) liver in 22‐ to 24‐month‐old Gbe1ys / ys Ppp1r3c −/− mice. (A) Scale bars = 50 μm. (B, D) Scale bars = 200 μm. (C) Scale bars = 100 μm.