

Abstract
Objective
To identify genetic factors associated with susceptibility to and clinical features of neuromyelitis optica spectrum disorders (NMOSD).
Methods
Genome‐wide single nucleotide polymorphism (SNP) genotyping was conducted in 211 Japanese patients with NMOSD fulfilling the 2006 criteria with or without anti‐aquaporin‐4 (AQP4) antibody and 1,919 Japanese healthy controls (HCs). HLA‐DRB1 and HLA‐DPB1 alleles were genotyped in 184 NMOSD cases and 317 HCs. Multiple sclerosis (MS) risk alleles outside the major histocompatibility complex (MHC) region were tested in NMOSD and MS genetic burden (MSGB) scores were compared between HCs and NMOSD.
Results
A SNP (rs1964995) in the MHC region was associated with NMOSD susceptibility (odds ratio (OR) = 2.33, P = 4.07 × 10⁻¹¹). HLA‐DRB1*08:02 (OR = 2.86, P = 3.03 × 10⁻⁴) and HLA‐DRB1*16:02 (OR = 8.39, P = 1.92 × 10⁻³) were risk alleles for NMOSD susceptibility whereas HLA‐DRB1*09:01 was protective (OR = 0.27, P = 1.06 × 10⁻⁵). Three MS risk variants were associated with susceptibility and MSGB scores were significantly higher in NMOSD than in HCs (P = 0.0095). A SNP in the KCNMA1 (potassium calcium‐activated channel subfamily M alpha 1) gene was associated with disability score with genome‐wide significance (rs1516512, P = 2.33 × 10⁻⁸) and transverse myelitis (OR = 1.77, P = 0.011). KCNMA1 was immunohistochemically detected in the perivascular endfeet of astrocytes and its immunoreactivity was markedly diminished in active spinal cord lesions in NMOSD.
Interpretation
Specific HLA‐DRB1 alleles confer NMOSD susceptibility and KCNMA1 is associated with disability and transverse myelitis in NMOSD.
Introduction
Neuromyelitis optica spectrum disorders (NMOSD) are characterized by recurrent attacks on central nervous system (CNS) tissues and preferentially affect the optic nerves, spinal cord, and area postrema. 1 NMOSD can be differentiated from multiple sclerosis (MS), another demyelinating disease of the CNS presenting with multiple attacks, by autoantibodies to aquaporin‐4 (AQP4) water channel protein, 2 , 3 although a subset of NMOSD patients has antibodies to myelin oligodendrocyte glycoprotein (MOG) 4 , 5 or no autoantibodies. NMOSD lesions show a loss of AQP4 and astrocytes together with vasculocentric deposition of complement and immunoglobulins, 6 which suggests a mechanism distinct from MS. The prevalence of NMOSD is lower than MS worldwide. 7 However, NMOSD prevalence is higher in Afro‐Caribbean individuals than Caucasians when the same diagnostic criteria and antibody detection measures were used, 8 which suggests that the ancestral background might influence disease susceptibility in NMOSD.
Many genetic factors for MS have been identified by multiple genome‐wide association studies (GWAS) in populations of European ancestry, 9 , 10 , 11 which revealed multiple genetic loci associated with risk with small effect sizes, and several alleles in the major histocompatibility complex (MHC) region with intermediate effect sizes such as human leukocyte antigen (HLA)‐DRB1*15:01. By these genetic risk alleles identified for MS, the MS genetic burden (MSGB) was calculated to estimate the genetic predisposition to MS, which was significantly higher in MS than in healthy controls (HCs). 12 , 13
Conversely, few genetic association studies have been conducted in NMOSD, partly because of its rarity. Several HLA alleles were reported to confer NMOSD susceptibility according to ancestry: HLA‐DPB1*05:01 for Japanese and Southern Han Chinese, and HLA‐DRB1*03 for Europeans. 14 , 15 , 16 , 17 One of the two GWAS conducted in NMOSD to date did not demonstrate any variants associated with NMOSD susceptibility with genome‐wide significance in Korean cases. 18 Another study of patients of North European descent found a significant association with the MHC region; however, adjustment of population stratification was needed and classical HLA alleles were determined by imputation not by genotyping. 19
The characteristic features of NMOSD encompass longitudinally extensive spinal cord lesions (LESCLs) on MRI, which are rarely encountered in MS, 20 , 21 and severe bilateral optic neuritis extending to the optic chiasma culminating in blindness. However, any genetic effects on these features have not been identified in NMOSD. The risk loci for disability might be different from those for susceptibility, as shown in MS and other autoimmune diseases. 10 , 13 , 22 Therefore, in the present study, we aimed to identify genetic factors associated with the susceptibility and clinical features of NMOSD using genome‐wide genotyped single nucleotide polymorphisms (SNPs) and genotyped HLA‐DRB1 and ‐DPB1 alleles in Japanese patients with NMOSD. We also studied MSGB scores to elucidate the differences or similarities in the pathomechanisms of NMOSD and MS.
Subjects and Methods
Study participants
Peripheral blood mononuclear cells from Japanese HCs and NMOSD patients were collected from nine institutes in Japan that joined the Japan Multiple Sclerosis Genetic Consortium between 1987 and 2013. The ethics committee of each institution approved this study and all participants provided written informed consent. All NMOSD patients met the 2006 revised NMO criteria 23 and other CNS demyelinating diseases similar to MS fulfilling the 2010 McDonald criteria 24 were excluded. We collected demographic data from enrolled patients by a retrospective review of their medical records. Clinical parameters included age at onset, disease duration, history of transverse myelitis, 25 Kurtzke’s Expanded Disability Status Scale (EDSS) scores, 26 oligoclonal IgG bands in cerebrospinal fluid determined by isoelectric focusing, IgG index, and the presence of LESCLs by MRI.
SNP genotyping and quality control
We obtained genomic DNA from peripheral blood mononuclear cells using a DNeasy Blood and Tissue kit (Qiagen, Hilden, Germany). The HumanOmniExpress‐12 BeadChip (Illumina, San Diego, CA), which contains approximately 730,000 probes corresponding to known SNPs, was used for SNP genotyping in cases and controls. Standard quality control measures were implemented using PLINK v1.90. 27 SNPs with missing rates higher than 2%, Hardy–Weinberg proportion test P < 10−5, and distinct missing proportion between cases and controls with P < 10−3 were excluded. Samples were excluded for missing genotyping rates exceeding 2%, extreme autosomal heterozygosity of >3 standard deviations (SD), or excessive Identity by Descent with PI_HAT >0.20.
Population Stratification
Principal component (PC) analyses were used to assess ancestry and control for the effects of population stratification. PC analysis was conducted using pruned autosomal non‐MHC SNPs with minor allele frequency >1% and pairwise r2 < 0.1 with a window size of 100 SNPs. Outliers whose PC1 exceeded 6 SD were excluded. Adding PC1 to PC5 in order as covariates, each genomic inflation factor was calculated and combinations of PCs minimizing the factor were determined. PC analyses were performed using the R package SNPRelate. 28
Fine mapping with imputation
Because several risk SNPs outside the MHC region associated with MS in Europeans are not included in the SNP array, imputation was performed using IMPUTE2 (v2.3.0) and the 1000 Genomes Phase 3 integrated haplotypes (released in October 2014) were used as a reference panel. 29 Association tests were conducted with the frequentist test using SNPTEST (v2.5.3) assuming an additive effect of each SNP.
HLA
Among recruited cases and controls, four‐digit DRB1 and DPB1 alleles were determined using the sequence‐specific oligonucleotide probe method.
MSGB
The MSGB score was computed based on a weighted scoring algorithm using SNPs associated with MS of European ancestry to assess a shared genetic background between MS and NMOSD. 12 This method extends the log‐additive models used in previous analyses with weights given to each SNP based on its effect size as reported by odds ratios (ORs). By formally reported risk variants and ORs, 11 the log of OR associated with the presence of a single dose of risk allele is added to the score of each risk allele carried by the subject.
Association analysis
Following quality control analyses, association tests of SNPs and HLA alleles were conducted assuming an additive effect of the allele for the phenotype with sex. HLA allele association tests were conducted only for alleles with an allele frequency greater than 0.01 in total genotyped samples. EDSS scores were rank‐normalized for linear regression analysis including the age of onset and disease duration as covariates. 30 To estimate the MSGB contribution to NMOSD heritability, Nagelkerke R2 values were calculated using the R package of fmsb. Statistical significance was set at P < 5.0 × 10⁻⁸ for genome‐wide SNP association tests and SNPs with false discovery rate (FDR) corrected P < 0.05 were nominated as suggestive associated variants. All association tests for genotyped SNPs were conducted using PLINK (v1.90).
Immunohistopathological analysis of spinal cord lesions in NMOSD
To assess the distribution of potassium calcium‐activated channel subfamily M alpha 1 (KCNMA1), autopsied spinal cord tissues from three NMOSD cases and one control case (muscular dystrophy) archived in the Department of Neuropathology, Kyushu University were used. 31 , 32 , 33 Demographics of NMOSD cases are shown in Table 1. Because NMOSD‐1 and −3 died prior to the introduction of the anti‐AQP4 antibody assay, their serostatus could not be assessed. NMOSD‐2 was seropositive for anti‐AQP4 antibody. Rabbit polyclonal antibodies to KCNMA1 (1:400; Abcam and Sigma‐Aldrich), myelin oligodendrocyte glycoprotein (MOG) (1:1000; Sigma‐Aldrich), AQP4 (1:500; Santa Cruz Biotechnology), and CD68 (1:200; DakoCytomation) were used to evaluate immunoreactivity. Immunohistochemistry was performed as previously described. 32 According to the lesion classification based on the density of infiltrated macrophages, 34 , 35 all lesions from the three NMOSD cases in the present study were defined as active.
Table 1.
Summary of clinical and pathological findings in autopsied NMOSD cases.
| Autopsy | Age (yrs) | Sex |
Disease duration (yrs) |
Clinically estimated lesion sites 1 | Pathologically determined lesion sites 1 | Neurological symptom possibly associated with death |
|---|---|---|---|---|---|---|
| NMOSD‐1 | 88 | M | 0.4 | S1 | O, S | Paraplegia |
| NMOSD‐2 2 | 37 | F | 17.0 | O8, Bs1, S9, Cr3 | Bs, S, Cr | Quadriplegia |
| NMOSD‐3 | 54 | F | 4.0 | O1, S6 | O, S | Bulbar palsy |
Abbreviations: Bs, brainstem; Cl, cerebellum; Cr, cerebrum, F, female; M, male; NMOSD, neuromyelitis optica spectrum disorders; O, optic nerve; S, spinal cord.
Numbers indicate exacerbations in each lesion site (for example, O2 represents two optic neuritis episodes).
A NMOSD case seropositive for anti‐AQP4 antibody.
Results
Demographic features
We performed genome‐wide SNP genotyping of 211 NMOSD cases and 1,919 controls. After applying quality control, 203 cases and 1,782 controls were included, and 656,304 SNPs were available for the association analyses (Fig. 1). The demographic features are shown in Table 2. Anti‐AQP4 antibodies were positive in 82.7% of cases and 35 cases without anti‐AQP4 antibody were diagnosed as NMOSD based on clinical and imaging features. 23 Most patients had LESCLs (72.8%) and transverse myelitis was observed in 46.2% of patients. The genomic inflation factor was 1.033 and the value was closest to value one (1.024) when PC1 to 3 were included as covariates. Thus, these three PCs were included as covariates for all association tests.
Figure 1.
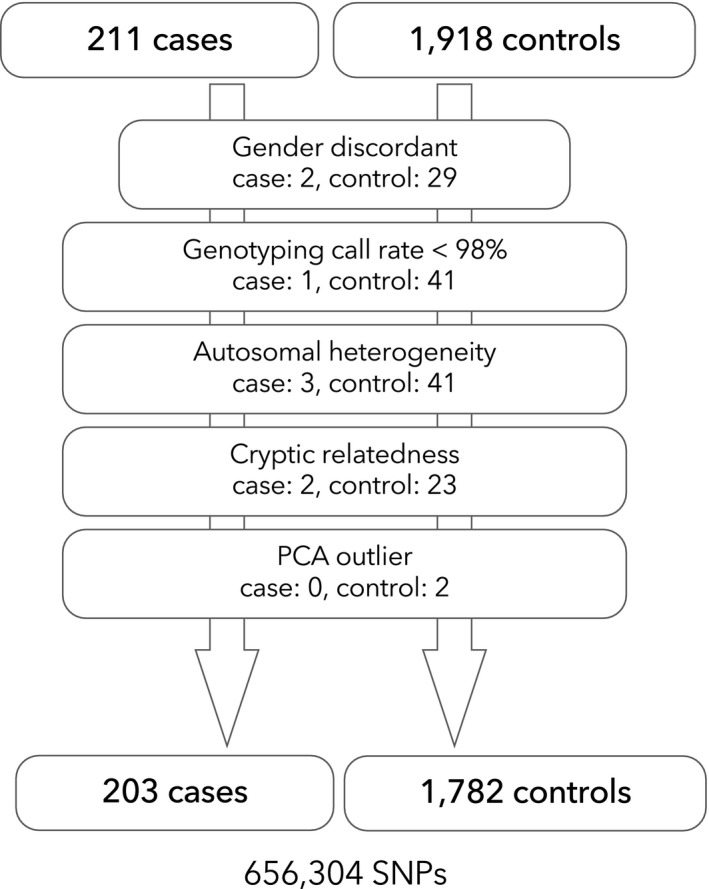
Flowchart of sample quality control. Following quality control procedures for samples, 203 cases and 1782 controls were available for the genome‐wide association study for NMOSD.
Table 2.
Demographic features of NMOSD patients and healthy controls.
| NMOSD (n = 203) | Controls (n = 1782) | |
|---|---|---|
| Female: Male | 179: 24 | 583: 1,199 |
| Anti‐AQP4 antibody + (%) | 167/202 (82.7) | NA |
| Age of onset, mean (SD), y | 42.3 (16.0) | NA |
| Disease duration, median (IQR), y | 7.0 (4.0–15.0) | NA |
| EDSS score, median (IQR) | 5.0 (3.0–7.0) | NA |
| LESCLs (%) | 147/202 (72.8) | NA |
| Transverse myelitis (%) | 86/186 (46.2) | NA |
| Oligoclonal IgG bands (%) | 20/170 (11.8) | NA |
Abbreviations: EDSS, Kurtzke’s Expanded Disability Status Scale; NA, Not Applicable.
SNP associations with NMOSD
After quality control for variants, 656,304 SNPs were used for the single variant association test for NMOSD with logistic regression adjusted for sex. The most significant signal was observed in the MHC region (rs1964995, OR = 2.33, 95% confidence interval [CI]: 1.81–3.00, P = 4.07 × 10⁻¹¹), mapped between HLA‐DRA and HLA‐DRB5 (Fig. 2A). rs1964995 was also the top associated variant for patients with anti‐AQP4 antibody (OR = 2.43, 95% CI: 1.85–3.20, P = 2.46 × 10⁻¹⁰) after excluding seronegative patients. There were no associated SNPs with genome‐wide significance after conditioning by rs1964995. rs7186814 in chromosome 16 (LOC105371343, OR = 2.31, 95% CI: 1.67–3.21, P = 5.01 × 10⁻⁷) was a potential associated variant outside the MHC region. When we used a pi‐hat threshold of >0.1, essentially the same results were obtained (data not shown). When a less stringent p‐value threshold (1.0 × 10⁻⁴. 5 ) was applied as a discovery P‐value, 10 29 variants outside the MHC were identified. Among these, the statistics of 22 variants were available from a previous GWAS for NMOSD in people of European descent, 19 but the associations were not replicated (Table S1). The genotyping data included 46 SNPs, which were located in the AQP4 gene and 50 kb beyond the 5’‐ and 3’‐ untranslated regions (UTRs), but there were no nominally associated SNPs in this region.
Figure 2.
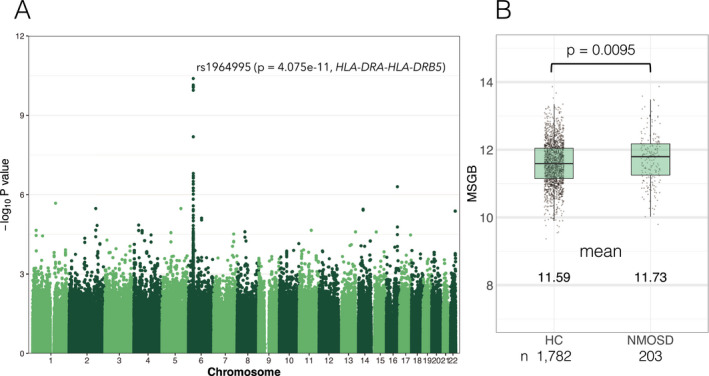
P‐values from the genome‐wide association study and multiple sclerosis genetic burden scores of NMOSD. (A) Manhattan plot of association signals with NMOSD susceptibility. The P‐value (‐log10 P) of the association (ordinate) adjusted by sex is plotted against the base pair position for each chromosome variant (abscissa). A peak association (rs1964995) was observed in the MHC region between HLA‐DRA and HLA‐DR5. (B) MS genetic burden score of individuals is plotted and compared between NMOSD and HCs.
Association with HLA‐DRB1 and ‐DPB1 alleles
Among the cases and controls, four‐digit HLA‐DRB1 and ‐DPB1 alleles were genotyped in 184 NMOSD cases and 317 controls. HLA‐DRB1*09:01 was protective (OR = 0.27, 95% CI: 0.14–0.47, P = 1.06 × 10⁻⁵) and HLA‐DRB1*08:02 (OR = 2.86, 95% CI: 1.63–5.12, P = 3.03 × 10⁻⁴) and HLA‐16:02 (OR = 8.39, 95% CI: 2.46–39.4, P = 1.92 × 10⁻³) were risk alleles for NMOSD susceptibility (Table 3) including sex as a covariate in the additive effect model. There were no associated DPB1 alleles for NMOSD in the additive effect model, whereas DPB1*05:01 was a risk allele (OR = 2.38, 95% CI: 1.52–3.82, P = 2.22 × 10⁻⁴) for NMOSD in the dominant effect model (Table 4).
Table 3.
Association with HLA‐DRB1 alleles in the additive effect model.
| HLA‐DRB1 alleles | Allele frequency | OR (95% CI) | P | ||
|---|---|---|---|---|---|
| All | Controls | Cases | |||
| DRB1*09:01 | 0.102 | 0.137 | 0.041 | 0.27 (0.14–0.47) | 1.06E‐05 1 |
| DRB1*08:02 | 0.064 | 0.041 | 0.103 | 2.86 (1.63–5.12) | 3.03E‐04 1 |
| DRB1*16:02 | 0.016 | 0.005 | 0.035 | 8.39 (2.46–39.4) | 1.92E‐03 1 |
| DRB1*12:02 | 0.031 | 0.021 | 0.049 | 2.18 (1.02–4.83) | 0.048 |
| DRB1*14:05 | 0.029 | 0.021 | 0.043 | 2.10 (0.98–4.60) | 0.057 |
| DRB1*04:03 | 0.025 | 0.032 | 0.014 | 0.38 (0.12–0.98) | 0.061 |
| DRB1*15:02 | 0.095 | 0.107 | 0.073 | 0.64 (0.39–1.04) | 0.079 |
| DRB1*14:03 | 0.012 | 0.016 | 0.005 | 0.29 (0.044–1.17) | 0.12 |
| DRB1*01:01 | 0.065 | 0.073 | 0.052 | 0.65 (0.36–1.16) | 0.16 |
| DRB1*04:05 | 0.12 | 0.134 | 0.098 | 0.74 (0.47–1.13) | 0.17 |
| DRB1*13:02 | 0.064 | 0.058 | 0.073 | 1.31 (0.75–2.23) | 0.33 |
| DRB1*11:01 | 0.026 | 0.024 | 0.030 | 1.34 (0.56–3.14) | 0.50 |
| DRB1*12:01 | 0.058 | 0.054 | 0.065 | 1.22 (0.68–2.16) | 0.51 |
| DRB1*04:06 | 0.023 | 0.025 | 0.019 | 0.73 (0.26–1.83) | 0.51 |
| DRB1*08:03 | 0.083 | 0.080 | 0.087 | 1.17 (0.72–1.91) | 0.52 |
| DRB1*04:01 | 0.011 | 0.009 | 0.014 | 1.39 (0.39–4.44) | 0.59 |
| DRB1*14:54 | 0.040 | 0.038 | 0.043 | 1.15 (0.60–2.20) | 0.66 |
| DRB1*15:01 | 0.090 | 0.088 | 0.092 | 1.08 (0.67–1.74) | 0.75 |
Abbreviations: CI, confidence interval; OR, odds ratio.
P < 0.05 after adjusting for multiple tests.
Table 4.
Association with HLA‐DPB1 Alleles in the Dominant Effect Model.
| HLA‐DPB1 alleles | Allele frequency | OR (95% CI) | P | ||
|---|---|---|---|---|---|
| All | Controls | Cases | |||
| DPB1*05:01 | 0.457 | 0.438 | 0.489 | 2.38 (1.52–3.82) | 2.22E‐04 1 |
| DPB1*04:02 | 0.087 | 0.101 | 0.062 | 0.58 (0.33–0.98) | 0.046 |
| DPB1*02:02 | 0.038 | 0.028 | 0.054 | 1.97 (0.96–4.08) | 0.064 |
| DPB1*13:01 | 0.018 | 0.025 | 0.0054 | 0.14 (0.0077–0.75) | 0.065 |
| DPB1*04:01 | 0.048 | 0.043 | 0.057 | 1.57 (0.82–3.01) | 0.17 |
| DPB1*09:01 | 0.086 | 0.095 | 0.071 | 0.70 (0.41–1.18) | 0.19 |
| DPB1*03:01 | 0.030 | 0.036 | 0.019 | 0.65 (0.24–1.58) | 0.36 |
| DPB1*02:01 | 0.205 | 0.202 | 0.209 | 0.99 (0.67–1.47) | 0.97 |
Abbreviations: CI, confidence interval; OR, odds ratio.
P < 0.05 after adjusting for multiple tests.
Assessment of risk alleles for MS in NMOSD
Among 110 risk SNPs outside the MHC for MS patients of North European descent, 38 SNPs were genotyped and 70 SNPs were available from imputed genotypes. Two SNPs (rs2150702 and rs201202118) were unavailable because rs2150702 is not a biallelic variant and rs2150702 was not in the 1000 genome reference panel. Only three variants (rs6677309 [CD58], rs1813375 [EOMES – CMC1], and rs694739 [PRDX5 – CCDC88B]) in 108 risk variants for MS were associated with the susceptibility of NMOSD with p‐values less than 0.05 (Table S2). MSGB scores were calculated in 1,782 HCs and 203 cases from 108 risk variants. MSGB scores were higher in NMOSD than in HCs (mean 11.73 vs 11.59, P = 0.0095) (Fig. 2B), and although statistically significant, the difference in the mean values was small and the explained variation by MSGB was low (Nagelkerke R2 = 0.0086).
Associations of SNPs and HLA alleles with the clinical features of NMOSD
Association tests for the clinical features of NMOSD revealed that rs1516512 (an intron variant) in the KCNMA1 gene was associated with EDSS scores with genome‐wide significance (P = 2.33 × 10⁻⁸) after adjusting for age of onset and disease duration (Fig. 3A,B). This SNP was not associated with susceptibility to NMOSD (P = 0.77) but correlated with transverse myelitis in an additive effect model (OR = 1.77, 95% CI: 1.15–2.79, P = 0.011) (Fig. 3C). Transverse myelitis was associated with EDSS scores after adjusting for age of onset and disease duration (P = 2.04 × 10⁻⁷) while transverse myelitis and risk alleles were independently associated with EDSS scores (P = 3.59 × 10⁻⁶ and 1.24 × 10⁻⁶, respectively) including the risk allele as a covariate in the multivariable regression model. Even when the positivity of anti‐AQP4 antibody was included as a covariate, rs1516512 was similarly associated with EDSS scores, after correction for multiple comparisons by FDR (P = 6.82 × 10⁻⁸, FDR corrected P = 0.040). No SNPs were associated (genome‐wide significance) with positivity for anti‐AQP4 antibodies, oligoclonal IgG bands, or LESCLs. There were no HLA‐DRB1 or ‐DPB1 alleles associated with clinical features after correcting for multiple testing. In terms of the 46 SNPs around the AQP4 gene, one variant (rs162003) was nominally associated with EDSS (P = 0.0065), but the association was not confirmed after correcting for multiple testing.
Figure 3.
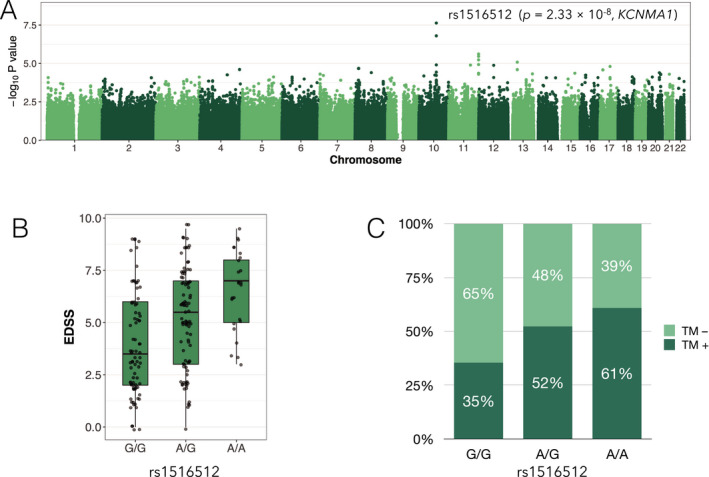
Associations of a variant in KCNMA1 with disability and spinal cord damage of NMOSD. (A) Manhattan plot of association signals with rank‐normalized EDSS scores adjusted for age of onset and disease duration. A peak association (rs1516512) was located in KCNMA1 of chromosome 10. (B) Box‐whisker plot of raw EDSS scores in each rs1516512 allele carrier. (C) Frequency of transverse myelitis in each rs1516512 allele carrier. TM, transverse myelitis.
Immunohistopathological findings of KCNMA1 in the spinal cord of NMOSD
In a control spinal cord tissue, KCNMA1 was diffusely expressed in the gray matter (Fig. 4A) showing neuropil staining adjacent to neurons (insert in Fig. 4A). Immunoreactivity for KCNMA1 showed a mesh‐like pattern and was present at the glia limitans and perivascular foot processes in the white matter (Fig. 4B,C), which suggests astrocytic distribution. The specimen of spinal cord of NMOSD included lesions massively infiltrated with CD68+ macrophages (Fig. 4D–F) and KCNMA1 immunoreactivity was assessed in the active lesions. In NMOSD cases, immunoreactivity for KCNMA1 was diminished in active lesions in accord with the extent of decreased AQP4 and MOG immunoreactivities (Fig. 4G–O). In the NMOSD‐3 case, AQP4 and KCNMA1 were preferentially lost in the isolated spinal white matter perivascular lesions, which showed minimal vacuolation without overt demyelination (Fig. 4P–R). Loss of AQP4 occurred to a greater extent than KCNMA1 in most lesions (Fig. 4S,U). Even in AQP4‐lost lesions, demyelination and tissue vacuolation were not observed by immunostaining for MOG in the KCNMA1‐preserved areas (Fig. 4T).
Figure 4.
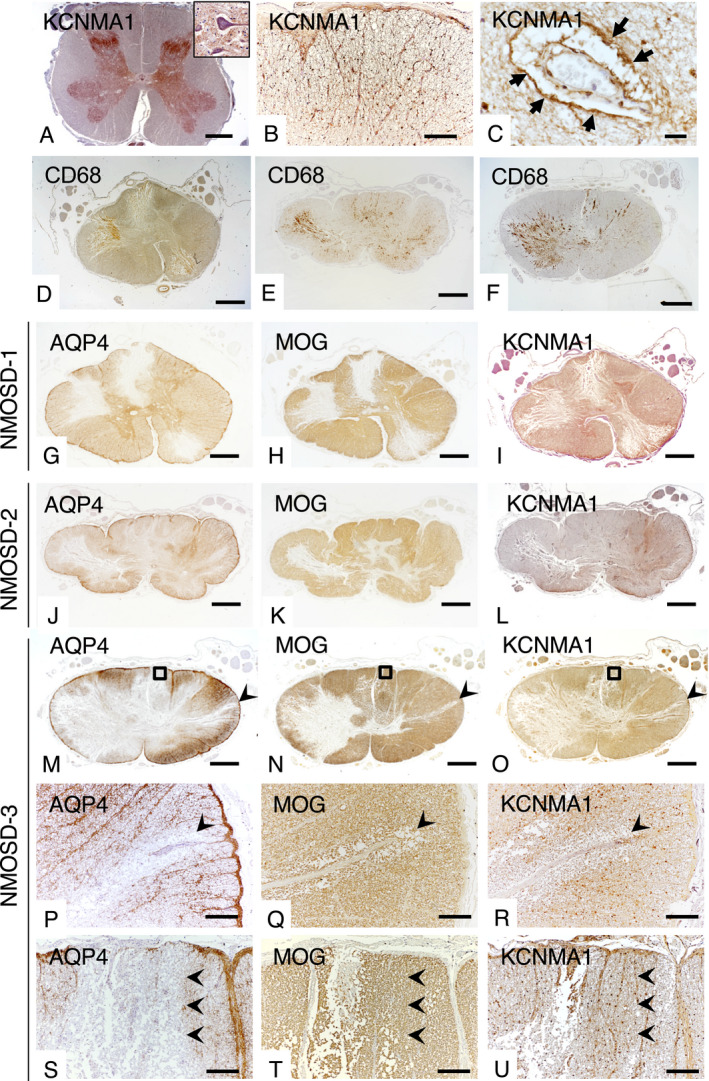
Expression pattern of KCNMA1 in spinal cords of a control (A–C) and NMOSD patients (D–U). (A) KCNMA1 is diffusely expressed in the gray matter showing neuropil staining (insert). (B) KCNMA1 has a mesh‐like appearance in the white matter, (B, C) and is densely expressed in the glia limitans (B) and perivascular foot processes (C, arrows). (D–F) Active lesions in NMOSD cases. Immunostaining for CD68 (brown color) shows massive infiltration of macrophages in extensive spinal cord lesions in NMOSD‐1 (D), NMOSD‐2 (E), and NMOSD‐3 (F) cases. (G–U) Immunoreactivity for KCNMA1 in active lesions is diminished similar to the loss of AQP4 and MOG in the spinal cord at the 12th thoracic spinal segment from an NMOSD‐1 case (G–I), at the 3rd thoracic spinal cord segment from an NMOSD‐2 case (J–L) and at the 8th thoracic spinal segment from an NMOSD‐3 case (M–U). Immunoreactivity for KCNMA1 is diminished in astrocytes of active lesions (I, L, O, R). (P–R) Higher magnification view of arrowhead in M–O. Expressions of AQP4 and KCNMA1 are markedly diminished in the white matter perivascular region (P and R, arrowheads). Minimal vacuolation of the spinal cord tissue without obvious demyelination around the affected vessel (Q, arrowhead). (S–U) Higher magnification of the rectangle in M–O. Immunoreactivity for AQP4 is diminished more extensively than for KCNMA1 (S and U, arrowheads). Immunostaining for MOG reveals no demyelination and/or vacuolation of spinal cord tissue in the KCNMA1‐preserved area (T, U, arrowheads). Scale bars = 2 mm (A, D–O), 200 µm (B, P–U) and 20 µm (C).
Discussion
Several studies reported associations of some class II HLA alleles with NMOSD susceptibility in various races: HLA‐DRB1*16:02 and HLA‐DPB1*05:01 as risk factors and DRB1*09:01 as a protective factor in an East Asian population, 14 , 15 , 16 and HLA‐DRB1*03 and HLA‐RB1*01:01 as risk factors in those of North European descent. 17 , 19 In the present study, the previously reported four‐digit HLA risk or protective alleles for NMOSD in East Asian populations were all confirmed, while DRB1*08:02 was newly added as a risk allele. Because HLA‐DRB1*03:01 is a rare allele in the Japanese population (allele frequency, 0.0015), 36 the association was not replicated using this sample size. Furthermore, HLA‐DRB1*09:01 and DRB1*08:02 are rare in European populations, which makes it difficult to determine an association with NMOSD. In our Japanese cohort, HLA‐DRB1*16:02 and HLA‐DRB1*08:02 were associated with NMOSD in the additive effect model, while HLA‐DPB1*05:01 was associated with NMOSD in the dominant effect model, which suggests that the contribution to NMOSD susceptibility differs between HLA‐DRB1 risk alleles and HLA‐DPB1*05:01. Indeed, no HLA‐DRB1 alleles correlated with HLA‐DPB1*05:01 with an r2> 0.5; thus, the association of DPB1*05:01 with NMOSD should be independent of the effect of HLA‐DRB1.
Genome‐wide SNP association tests indicated the most significant association with NMOSD susceptibility was observed in rs28383224 of the MHC region in those of European ancestry. 19 Although this SNP was not genotyped in our samples, the correlation between rs28383224 and the top associated SNP for Japanese NMOSD, rs1964995, was not robust in European and East Asian populations in the 1000 Genome dataset (r2 = 0.394 and 0.0085 respectively). 37 Each top associated SNP might affect susceptibility in Japanese and European populations differently. Because the top SNP (rs1964995) in the Japanese population did not correlate with any HLA‐DRB1 or HLA‐DPB1 alleles with r2> 0.5, the major effect of rs1964995 on susceptibility may be attributable to other class II HLA alleles or non‐HLA genes in the MHC region. 38 Fine mapping of this region should be investigated in the future. Additionally, an SNP (rs1150757) near complement component 4 (C4), which might produce a structural variation of C4, was associated with NMOSD independent from the top SNP in the MHC region in those of European ancestry. 19 rs1150757 was not genotyped in the Japanese sample, but the proxy SNP in European populations (rs3130288, r2 = 0.986) was monoallelic and the risk allele was not present in the Japanese samples. This suggests that structural variations of C4 do not influence susceptibility to NMOSD, at least in the Japanese population. Using a less stringent p‐value threshold for screening, 29 variants were identified outside the MHC. The associations, however, were not replicated in people of North European descent. Neither the Japanese nor European cohorts for GWAS appeared to be sufficient to detect variants with relatively minor effect sizes and differences in ethnicity might explain discordance of the associated regions. More cases are necessary to confirm the robustly associated variants outside the MHC for each ethnic group.
Although MSGB scores were significantly higher in NMOSD than in HCs, the difference in the mean values between the two groups was small and the correlation coefficient (Nagelkerke R2) was low, which suggests that immunological pathways involved in MS and NMOSD are largely distinct. This suggests that the phenotype variance is poorly explained by MSGB. Among 108 risk SNPs for MS outside the MHC in those of North European descent, only three were replicated in our NMOSD cohort. SNP rs6677309 in CD58, which changes immunological activity via the expression of a receptor for a costimulatory molecule, 39 had relatively high effect sizes even for NMOSD. However, few risk genes are shared between MS and NMOSD, which suggests that these diseases have distinct pathomechanisms. 31 , 40
No SNPs in the MHC regions were associated with any clinical features, which suggests that MHC region genes affect only susceptibility but not clinical manifestations. Regarding genotype‐phenotype correlations, the most interesting finding in the present study was the genome‐wide significant association between an SNP (rs1516512) in KCNMA1 and disability of NMOSD patients. Because the risk allele (A) was negatively associated with the expression of KCNMA1 in cultured fibroblasts (P = 8.8 × 10⁻⁶), 41 the decreased expression of KCNMA1 contributes to greater disability. The SNP in KCNMA1 was correlated with transverse myelitis in an additive effect model, while transverse myelitis and the risk allele were independently associated with EDSS scores by a multivariable regression model. These results suggest that the risk allele in KCNMA1 at least partially influences EDSS scores via transverse myelitis. Because the SNP correlated with EDSS scores was not associated with susceptibility, KCNMA1 is likely to be involved in lesion expansion and CNS dysfunction following inflammatory insults, but not the induction of the immunological attack on the CNS.
KCNMA1 encodes the α subunit of large conductance Ca2+‐ and voltage‐activated K+ channels, also known as BK channels. Mutations in KCNMA1 cause paroxysmal nonkinesigenic dyskinesia, developmental delay, and cortical atrophy. 42 , 43 BK channels are activated following the elevation of endfoot Ca2+ concentrations to augment K+ flow‐out into the perivascular space, which leads to the dilatation of vessels in brain parenchyma and pia mater. 44 , 45 Consistent with previous reports in rats, 44 , 46 our immunohistological study of human spinal cord revealed that KCNMA1 is present mainly in the foot processes of astrocytes similar to AQP4. Therefore, KCNMA1 immunoreactivity was markedly diminished in active lesions of NMOSD, but myelin appeared to not be disrupted in KCNMA1‐preserved regions. Our combined neuropathological and neuroimaging studies demonstrated that the spinal cord circulation has a critical role in lesion extension in NMOSD 33 and we proposed that isolated perivascular lesions in the spinal cord are the earliest lesions to develop in the gray and white matter boundary at the periphery of vessels penetrating from the spinal cord circumferential circulation. 33 In such ischemic states, BK channels help to restrain glutamate release and reduce infarct volume independent from cerebral blood flow. 47 , 48 Decreased restorative expression of KCNMA1 following inflammatory destruction may induce further tissue damage by increasing excitotoxicity due to glutamate. Alternatively, because potassium concentrations and water volume in the myelin sheath are maintained by the astrocytic draining system via gap junctions between oligodendrocytes and astrocytes, 49 disruption of BK channel functions that efflux large volumes of potassium ions into the perivascular space may worsen demyelination. The present study suggests that the restoration of BK channels might be a novel therapeutic target to improve severe spinal cord damage in NMOSD. To elucidate the roles of KCNMA1 in the destruction of spinal cord tissues, future in vivo studies using KCNMA1 knock‐out mice or drugs that modulate the KCNMA1 function are required.
The variant associated with the disability of NMOSD was different from the risk of susceptibility. For example, in MS, some HLA alleles and the MHC regions are associated with susceptibility but not disability. 10 , 13 Genetic loci associated with disability in MS have not been confirmed, although some candidate loci are involved in glutamate‐induced cell‐death or remyelination independent from loci associated with susceptibility. 22
Our study had some limitations. First, etiological backgrounds among patients with NMOSD could be heterogeneous because anti‐AQP4 antibody‐seronegative patients, who might be anti‐MOG antibody‐positive, were included in our cohort. However, the SNP associated with susceptibility (rs1964995) and disability (rs1516512) was associated with the phenotypes independent of the presence of anti‐AQP4 antibody in the present study, which suggests that these associations represent a genetic influence on NMOSD irrespective of the presence of autoantibodies. Second, the sex ratio was different between NMOD patients and controls because of the extreme female preponderance in NMOSD. 2 Instead of collecting controls at the same ratio, we included sex as a covariate in the logistic regression analysis to adjust for differences in the female ratio between cases and controls. Thus, we think this difference in sex ratio did not distort the present findings. Third, because of the rarity of the disease, the number of enrolled NMOSD patients was small compared with similar GWAS studies in MS. The absence of loci associated with NMOSD susceptibility outside the MHC may be attributable to the small sample size. Our study results should be regarded as preliminary until confirmed by future larger scale studies. Nevertheless, our study of a homogeneous Japanese population might provide important insights into the genetic background of NMOSD.
This study, the first to investigate GWAS in Japanese NMOSD patients, revealed the following: (i) the SNP, rs1964995, mapped between HLA‐DRA and HLA‐DRB5 in the MHC region is the only genetic locus associated with NMOSD susceptibility with genome‐wide significance; and (ii) few risk genes are shared between MS and NMOSD but include CD58, EOMES, and PRDX5; and (iii) KCNMA1, which is expressed mainly on astrocyte endfeet, is a genetic risk factor for disability and transverse myelitis.
Author Contributions
T.M., N.I., S.S., and J.K. had full access to all data in the study and they take responsibility for the integrity of the data and the accuracy of the data analysis. J.K. contributed to the study conception and design, obtained funding, and provided supervision. T.M. and N.I. contributed to the statistical analysis. T.M., K.M., and J.K. contributed to the drafting of the manuscript. All authors contributed to the acquisition, analysis, and interpretation of data, and critical revision of the manuscript for important intellectual content.
Conflicts of Interest
Dr. Matsushita received speech honoraria payments from Biogen Japan, Takeda Pharmaceutical Company. Dr. Isobe received grant support from Mitsubishi Tanabe Pharma, Osoegawa Neurology Clinic, Bayer Yakuhin Ltd., and the Japan Blood Products Organization. Dr. Nakamura received grant support from Mitsubishi Tanabe Pharma, Bayer Yakuhin Ltd. and the Japan Blood Products Organization. Dr. Kira received grants and personal fees from Biogen Japan, Bayer Healthcare, Novartis Pharma, Mitsubishi Tanabe Pharma, Eisai, Sanofi, Nobelpharma, Otsuka Pharmaceutical, Chugai Pharmaceutical Company, and Teijin Pharma. No other disclosures were reported.
Supporting information
Table S1. Replication of Nominal Risk Alleles for Japanese NMOSD in those of North European Descent with NMOSD. Chr, chromosome, NA, Not applicable, NMOSD, neuromyelitis optica spectrum disorders, OR, odds ratio, RA, risk allele.
Table S2. Replication of Risk Alleles for MS in those of North European Descent with NMOSD. Chr, chromosome, MAF, minor allele frequency, NA, not applicable, NMOSD, neuromyelitis optica spectrum disorders, OR, odds ratio, RA, risk allele.
Acknowledgments
The authors would like to thank Dr. Satoshi O. Suzuki and Professor Toru Iwaki (Department of Neuropathology, Neurological Institute, Graduate School of Medical Sciences, Kyushu University) for advice and support for the histopathological investigations. We thank Professor Jorge Oksenberg for advice and support for the genetic analyses. We thank Edanz Group (www.edanzediting.com/ac) for editing a draft of this manuscript. This study was funded by “Strategic Young Researcher Overseas Visits Program for Accelerating Brain Circulation” from the Japan Society for the Promotion of Science (JSPS) (G2320), grants from JSPS KAKENHI (Grant Nos. 17K16124, 19H01045, 19H05562), the “Practical Research Project for Rare/Intractable Diseases” from the Japan Agency for Medical Research and Development, AMED, Japan (JP16ek0109039, JP19ek0109308h0002), and a Health and Labor Sciences Research Grant on Intractable Diseases (H29‐Nanchitou (Nan)‐Ippan‐043) from the Ministry of Health, Labor and Welfare, Japan.
Funding Statement
This work was funded by Japan Agency for Medical Research and Development grants JP16ek0109039 and JP19ek0109308h0002; Ministry of Health, Labour and Welfare grant H29‐Nanchitou (Nan)‐Ippan‐043; Japan Society for the Promotion of Science grants 17K16124, 19H01045, 19H05562, and G2320.
References
- 1. Wingerchuk DM, Banwell B, Bennett JL, et al. International consensus diagnostic criteria for neuromyelitis optica spectrum disorders. Neurology 2015;85(2):177–189. DOI: 10.1212/WNL.0000000000001729 [DOI] [PMC free article] [PubMed] [Google Scholar]
- 2. Lennon VA, Wingerchuk DM, Kryzer TJ, et al. A serum autoantibody marker of neuromyelitis optica: distinction from multiple sclerosis. Lancet 2004;364(9451):2106–2112. DOI: 10.1016/S0140-6736(04)17551-X [DOI] [PubMed] [Google Scholar]
- 3. Lennon VA, Kryzer TJ, Pittock SJ, et al. IgG marker of optic‐spinal multiple sclerosis binds to the aquaporin‐4 water channel. J Exp Med 2005;202(4):473–477. DOI: 10.1084/jem.20050304 [DOI] [PMC free article] [PubMed] [Google Scholar]
- 4. Sato DK, Callegaro D, Lana‐Peixoto MA, et al. Distinction between MOG antibody‐positive and AQP4 antibody‐positive NMO spectrum disorders. Neurology 2014;82(6):474–481. DOI: 10.1212/WNL.0000000000000101 [DOI] [PMC free article] [PubMed] [Google Scholar]
- 5. Kitley J, Waters P, Woodhall M, et al. Neuromyelitis optica spectrum disorders with aquaporin‐4 and myelin‐oligodendrocyte glycoprotein antibodies. JAMA Neurol. 2014;71(3):276 Available from: http://eutils.ncbi.nlm.nih.gov/entrez/eutils/elink.fcgi?dbfrom=pubmed&id=24425068&retmode=ref&cmd=prlinks [DOI] [PubMed] [Google Scholar]
- 6. Roemer SF, Parisi JE, Lennon VA, et al. Pattern‐specific loss of aquaporin‐4 immunoreactivity distinguishes neuromyelitis optica from multiple sclerosis. Brain 2007;130(5):1194–1205. DOI: 10.1093/brain/awl371 [DOI] [PubMed] [Google Scholar]
- 7. Papp V, Illes Z, Magyari M, et al. Nationwide prevalence and incidence study of neuromyelitis optica spectrum disorder in Denmark. Neurology 2018;91(24):e2265–e2275. DOI: 10.1212/WNL.0000000000006645 [DOI] [PMC free article] [PubMed] [Google Scholar]
- 8. Flanagan EP, Cabre P, Weinshenker BG, et al. Epidemiology of aquaporin‐4 autoimmunity and neuromyelitis optica spectrum. Ann Neurol 2016;79(5):775–783. DOI: 10.1002/ana.24617 [DOI] [PMC free article] [PubMed] [Google Scholar]
- 9. International Multiple Sclerosis Genetics Consortium , Hafler DA, Compston A, et al. Risk alleles for multiple sclerosis identified by a genomewide study. N Engl J Med 2007;357(9):851–862. DOI: 10.1056/NEJMoa073493 [DOI] [PubMed] [Google Scholar]
- 10. International Multiple Sclerosis Genetics Consortium, Wellcome Trust Case Control Consortium 2 (WTCCC2) , Sawcer S, et al. Genetic risk and a primary role for cell‐mediated immune mechanisms in multiple sclerosis. Nature 2011;476(7359):214–219.Available from: http://eutils.ncbi.nlm.nih.gov/entrez/eutils/elink.fcgi?dbfrom=pubmed&id=21833088&retmode=ref&cmd=prlinks [DOI] [PMC free article] [PubMed] [Google Scholar]
- 11. International Multiple Sclerosis Genetics Consortium (IMSGC) , Beecham AH, Patsopoulos NA, et al. Analysis of immune‐related loci identifies 48 new susceptibility variants for multiple sclerosis. Nat Genet 2013;45(11):1353–1360. DOI: 10.1038/ng.2770 [DOI] [PMC free article] [PubMed] [Google Scholar]
- 12. Gourraud P‐A, McElroy JP, Caillier SJ, et al. Aggregation of multiple sclerosis genetic risk variants in multiple and single case families. Ann Neurol 2011;69(1):65–74. Available from http://eutils.ncbi.nlm.nih.gov/entrez/eutils/elink.fcgi?dbfrom=pubmed&id=21280076&retmode=ref&cmd=prlinks [DOI] [PMC free article] [PubMed] [Google Scholar]
- 13. Isobe N, Keshavan A, Gourraud P‐A, et al. Association of HLA genetic risk burden with disease phenotypes in multiple sclerosis. JAMA Neurol 2016;73(7):795–802. Available from http://eutils.ncbi.nlm.nih.gov/entrez/eutils/elink.fcgi?dbfrom=pubmed&id=27244296&retmode=ref&cmd=prlinks [DOI] [PMC free article] [PubMed] [Google Scholar]
- 14. Matsushita T, Matsuoka T, Isobe N, et al. Association of the HLA‐DPB1*0501 allele with anti‐aquaporin‐4 antibody positivity in Japanese patients with idiopathic central nervous system demyelinating disorders. Tissue Antigens 2009;73(2):171–176. DOI: 10.1111/j.1399-0039.2008.01172.x [DOI] [PubMed] [Google Scholar]
- 15. Yoshimura S, Isobe N, Matsushita T, et al. Distinct genetic and infectious profiles in Japanese neuromyelitis optica patients according to anti‐aquaporin 4 antibody status. J Neurol Neurosurg Psychiatry 2013;84(1):29–34. DOI: 10.1136/jnnp-2012-302925 [DOI] [PubMed] [Google Scholar]
- 16. Wang H, Dai Y, Qiu W, et al. HLA‐DPB1*0501 is associated with susceptibility to anti‐aquaporin‐4 antibodies positive neuromyelitis optica in Southern Han Chinese. J Neuroimmunol 2011;233(1–2):181–184. Available from http://linkinghub.elsevier.com/retrieve/pii/S0165572810005114. [DOI] [PubMed] [Google Scholar]
- 17. Zéphir H, Fajardy I, Outteryck O, et al. Is neuromyelitis optica associated with human leukocyte antigen? Mult Scler 2009;15(5):571–579. DOI: 10.1177/1352458508102085 [DOI] [PubMed] [Google Scholar]
- 18. Kim HJ, Park H‐Y, Kim E, et al. Common CYP7A1 promoter polymorphism associated with risk of neuromyelitis optica. Neurobiol Dis 2010;37(2):349–355. Available from http://linkinghub.elsevier.com/retrieve/pii/S096999610900299X [DOI] [PubMed] [Google Scholar]
- 19. Estrada K, Bronson P, Sun C, et al. A whole‐genome sequence study identifies genetic risk factors for neuromyelitis optica. Nat Commun 2018;9(1):1–23. [DOI] [PMC free article] [PubMed] [Google Scholar]
- 20. Wingerchuk DM, Lennon VA, Lucchinetti CF, et al. The spectrum of neuromyelitis optica. Lancet Neurol 2007;6(9):805–815. Available from http://linkinghub.elsevier.com/retrieve/pii/S1474442207702168 [DOI] [PubMed] [Google Scholar]
- 21. Matsuoka T, Matsushita T, Kawano Y, et al. Heterogeneity of aquaporin‐4 autoimmunity and spinal cord lesions in multiple sclerosis in Japanese. Brain 2007;130(5):1206–1223. DOI: 10.1093/brain/awm027 [DOI] [PubMed] [Google Scholar]
- 22. Jackson KC, Sun K, Barbour C, et al. Genetic model of MS severity predicts future accumulation of disability. Ann Hum Genet 2020;84(1):1–10. DOI: 10.1111/ahg.12342 [DOI] [PMC free article] [PubMed] [Google Scholar]
- 23. Wingerchuk DM, Lennon VA, Pittock SJ, et al. Revised diagnostic criteria for neuromyelitis optica. Neurology 2006;66(10):1485–1489. DOI: 10.1212/01.wnl.0000216139.44259.74 [DOI] [PubMed] [Google Scholar]
- 24. Polman CH, Reingold SC, Banwell B, et al. Diagnostic criteria for multiple sclerosis: 2010 revisions to the McDonald criteria. Ann Neurol 2011;69(2):292–302. DOI: 10.1002/ana.22366 [DOI] [PMC free article] [PubMed] [Google Scholar]
- 25. Transverse Myelitis Consortium Working Group . Proposed diagnostic criteria and nosology of acute transverse myelitis. Neurology 2002;59(4):499–505. DOI: 10.1212/WNL.59.4.499 [DOI] [PubMed] [Google Scholar]
- 26. Kurtzke JF. Rating neurologic impairment in multiple sclerosis: an expanded disability status scale (EDSS). Neurology 1983;33(11):1444 Available from http://www.ncbi.nlm.nih.gov/sites/entrez?Db=pubmed&Cmd=Retrieve&list_uids=6685237&dopt=abstractplus [DOI] [PubMed] [Google Scholar]
- 27. Chang CC, Chow CC, Tellier LCAM, et al. Second‐generation PLINK: Rising to the challenge of larger and richer datasets. Gigascience 2015;4(1):1–16. [DOI] [PMC free article] [PubMed] [Google Scholar]
- 28. Zheng X, Levine D, Shen J, et al. A high‐performance computing toolset for relatedness and principal component analysis of SNP data. Bioinformatics 2012;28(24):3326–3328. DOI: 10.1093/bioinformatics/bts606. [DOI] [PMC free article] [PubMed] [Google Scholar]
- 29. Howie B, Marchini J, Stephens M. Genotype imputation with thousands of genomes. G3 Genes, Genomes, Genet 2011;1(6):457–470.DOI: 10.1534/g3.111.001198 [DOI] [PMC free article] [PubMed] [Google Scholar]
- 30. Iman RL, Conover WJ. The use of the rank transform in regression. Technometrics 1979;21(4):499–509. [Google Scholar]
- 31. Matsuoka T, Suzuki SO, Suenaga T, et al. Reappraisal of aquaporin‐4 astrocytopathy in asian neuromyelitis optica and multiple sclerosis patients. Brain Pathol 2011;21(5):516–532. [DOI] [PMC free article] [PubMed] [Google Scholar]
- 32. Masaki K, Suzuki SO, Matsushita T, et al. Connexin 43 astrocytopathy linked to rapidly progressive multiple sclerosis and neuromyelitis optica. PLoS One 2013;8(8):e72919 DOI: 10.1371/journal.pone.0072919 [DOI] [PMC free article] [PubMed] [Google Scholar]
- 33. Hayashida S, Masaki K, Yonekawa T, et al. Early and extensive spinal white matter involvement in neuromyelitis optica. Brain Pathol 2017;27(3):249–265. Available from http://eutils.ncbi.nlm.nih.gov/entrez/eutils/elink.fcgi?dbfrom=pubmed&id=27082714&retmode=ref&cmd=prlinks [DOI] [PMC free article] [PubMed] [Google Scholar]
- 34. Lassmann H, Raine C, Antel J, Prineas J. Immunopathology of multiple sclerosis: report on an international meeting held at the Institute of Neurology of the University of Vienna. J Neuroimmunol 1998;86(2):213–217. Available from https://linkinghub.elsevier.com/retrieve/pii/S0165572898000319 [DOI] [PubMed] [Google Scholar]
- 35. Lucchinetti CF. Multiple sclerosis pathology during early and late disease phases: pathogenic and clinical relevance In: Immune Regulation and Immunotherapy in Autoimmune Disease. Boston, MA: Springer; 2007, p. 214–264. Available from: http://link.springer.com/10.1007/978‐0‐387‐36003‐4_12 [Google Scholar]
- 36. Ikeda N, Kojima H, Nishikawa M, et al. Determination of HLA‐A, ‐C, ‐B, ‐DRB1 allele and haplotype frequency in Japanese population based on family study. Tissue Antigens 2015;85(4):252–259. DOI: 10.1111/tan.12536 [DOI] [PMC free article] [PubMed] [Google Scholar]
- 37. Auton A, Abecasis GR, Altshuler DM, et al. A global reference for human genetic variation. Nature 2015;526(7571):68–74. [DOI] [PMC free article] [PubMed] [Google Scholar]
- 38. Ogawa K, Okuno T, Hosomichi K, et al. Next‐generation sequencing identifies contribution of both class I and II HLA genes on susceptibility of multiple sclerosis in Japanese. J Neuroinflammation 2019;16(1):1–9. [DOI] [PMC free article] [PubMed] [Google Scholar]
- 39. de Jager PL, Baecher‐Allan C, Maier LM, et al. The role of the CD58 locus in multiple sclerosis. Proc Natl Acad Sci USA. 2009;106(13):5264–5269. DOI: 10.1073/pnas.0813310106 [DOI] [PMC free article] [PubMed] [Google Scholar]
- 40. Misu T, Fujihara K, Kakita A, et al. Loss of aquaporin 4 in lesions of neuromyelitis optica: distinction from multiple sclerosis. Brain 2007;130(5):1224–1234. DOI: 10.1093/brain/awm047 [DOI] [PubMed] [Google Scholar]
- 41. The Genotype‐Tissue Expression (GTEx) Project. https://www.gtexportal.org/home/snp/rs1516512.
- 42. Du W, Bautista JF, Yang H, et al. Calcium‐sensitive potassium channelopathy in human epilepsy and paroxysmal movement disorder. Nat Genet 2005;37(7):733–738. [DOI] [PubMed] [Google Scholar]
- 43. Tabarki B, AlMajhad N, AlHashem A, et al. Homozygous KCNMA1 mutation as a cause of cerebellar atrophy, developmental delay and seizures. Hum Genet 2016;135(11):1295–1298. DOI: 10.1007/s00439-016-1726-y [DOI] [PubMed] [Google Scholar]
- 44. Filosa JA, Bonev AD, Straub SV, et al. Local potassium signaling couples neuronal activity to vasodilation in the brain. Nat Neurosci 2006;9(11):1397–1403. [DOI] [PubMed] [Google Scholar]
- 45. Paisansathan C, Xu H, Vetri F, et al. Interactions between adenosine and K + channel‐related pathways in the coupling of somatosensory activation and pial arteriolar dilation. Am J Physiol Circ Physiol 2010;299(6):H2009–H2017. DOI: 10.1152/ajpheart.00702.2010 [DOI] [PMC free article] [PubMed] [Google Scholar]
- 46. Price DL, Ludwig JW, Mi H, et al. Distribution of rSlo Ca2+‐activated K+ channels in rat astrocyte perivascular endfeet. Brain Res. 2002;956(2):183–193. Available from https://linkinghub.elsevier.com/retrieve/pii/S0006899302032663 [DOI] [PubMed] [Google Scholar]
- 47. Katsuki H, Shinohara A, Fujimoto S, et al. Tetraethylammonium exacerbates ischemic neuronal injury in rat cerebrocortical slice cultures. Eur. J. Pharmacol. 2005;508(1–3):85–91. Available from https://linkinghub.elsevier.com/retrieve/pii/S0014299904013706 [DOI] [PubMed] [Google Scholar]
- 48. Liao Y, Kristiansen A‐M, Oksvold CP, et al. Neuronal Ca2+‐Activated K+ Channels Limit Brain Infarction and Promote Survival. PLoS One 2010;5(12):e15601 DOI: 10.1371/journal.pone.0015601 [DOI] [PMC free article] [PubMed] [Google Scholar]
- 49. Kamasawa N, Sik A, Morita M, et al. Connexin‐47 and connexin‐32 in gap junctions of oligodendrocyte somata, myelin sheaths, paranodal loops and Schmidt‐Lanterman incisures: Implications for ionic homeostasis and potassium siphoning. Neuroscience 2005;136(1):65–86. [DOI] [PMC free article] [PubMed] [Google Scholar]
Associated Data
This section collects any data citations, data availability statements, or supplementary materials included in this article.
Supplementary Materials
Table S1. Replication of Nominal Risk Alleles for Japanese NMOSD in those of North European Descent with NMOSD. Chr, chromosome, NA, Not applicable, NMOSD, neuromyelitis optica spectrum disorders, OR, odds ratio, RA, risk allele.
Table S2. Replication of Risk Alleles for MS in those of North European Descent with NMOSD. Chr, chromosome, MAF, minor allele frequency, NA, not applicable, NMOSD, neuromyelitis optica spectrum disorders, OR, odds ratio, RA, risk allele.