

Supplemental Digital Content is available in the text.
Keywords: Fatigue, Hearing impairment, Listening effort, Pupillometry, Self-report, Speech
Abstract
Objective:
People with hearing impairment are likely to experience higher levels of fatigue because of effortful listening in daily communication. This hearing-related fatigue might not only constrain their work performance but also result in withdrawal from major social roles. Therefore, it is important to understand the relationships between fatigue, listening effort, and hearing impairment by examining the evidence from both subjective and objective measurements. The aim of the present study was to investigate these relationships by assessing subjectively measured daily-life fatigue (self-report questionnaires) and objectively measured listening effort (pupillometry) in both normally hearing and hearing-impaired participants.
Design:
Twenty-seven normally hearing and 19 age-matched participants with hearing impairment were included in this study. Two self-report fatigue questionnaires Need For Recovery and Checklist Individual Strength were given to the participants before the test session to evaluate the subjectively measured daily fatigue. Participants were asked to perform a speech reception threshold test with single-talker masker targeting a 50% correct response criterion. The pupil diameter was recorded during the speech processing, and we used peak pupil dilation (PPD) as the main outcome measure of the pupillometry.
Results:
No correlation was found between subjectively measured fatigue and hearing acuity, nor was a group difference found between the normally hearing and the hearing-impaired participants on the fatigue scores. A significant negative correlation was found between self-reported fatigue and PPD. A similar correlation was also found between Speech Intelligibility Index required for 50% correct and PPD. Multiple regression analysis showed that factors representing “hearing acuity” and “self-reported fatigue” had equal and independent associations with the PPD during the speech in noise test. Less fatigue and better hearing acuity were associated with a larger pupil dilation.
Conclusions:
To the best of our knowledge, this is the first study to investigate the relationship between a subjective measure of daily-life fatigue and an objective measure of pupil dilation, as an indicator of listening effort. These findings help to provide an empirical link between pupil responses, as observed in the laboratory, and daily-life fatigue.
INTRODUCTION
There is mounting evidence showing that for listeners with hearing impairment (HI), listening is more effortful than for normally hearing (NH) listeners (Dwyer et al. 2014). Associations between HI and increased levels of physical or mental stress are also frequently reported (Hasson et al. 2009; Nachtegaal et al. 2009). Repeated exposure to stress on a daily basis may lead to health issues and mood change, including fatigue (DeLongis et al. 1988). It is, therefore, suggested that people with HI might experience higher levels of fatigue as compared with NH peers because of relatively high levels of listening effort in daily communication caused by their hearing problems (Edwards 2007; McGarrigle et al. 2014; Hornsby et al. 2016). The experience of daily-life fatigue among HI adults might not only constrain their work performance but also result in withdrawal from major social roles (Kramer et al. 2006; Nachtegaal et al. 2009). Research examining the relationships between HI, listening effort, and fatigue is limited (Hornsby 2013; McGarrigle et al. 2014; Hornsby et al. 2016; Alhanbali et al. 2017), although a growing body of research focuses on testing listening effort objectively in laboratory settings (Ohlenforst et al. 2017a). Therefore, it is important to examine the association between daily-life fatigue and objectively measured listening effort. As such, the present study aims to provide insight into the associations between HI, listening effort, and daily-life fatigue, as well as the underlying mechanisms of potential interactions between them.
Listening Effort and Pupil Dilation
In an attempt to come to a consensus on what is known about the topic of listening effort, what terms to use, and to set priorities for further research, an Eriksholm Workshop was organized on “Hearing impairment and cognitive energy” (Pichora-Fuller & Kramer 2016). The workshop laid the groundwork for listening effort–related research by providing definitions and a theoretical framework. The workshop’s consensus definition of listening effort was “The deliberate allocation of mental resources to overcome obstacles in goal pursuit when carrying out a task that involves listening” (Pichora-Fuller et al. 2016, p.10s). Adapted from Kahneman’s capacity model of attention (Kahneman 1973), a new Framework for Understanding Effortful Listening (FUEL) was proposed. The detailed description of the FUEL framework is available in Pichora-Fuller et al. (2016). In short, the FUEL proposes that listening effort is modulated independently by task demands, capacity, and motivation/arousal. Listening effort can be measured subjectively and objectively. Most subjective assessments of listening effort have employed self-report questionnaires (Gatehouse & Noble 2004; Dawes et al. 2014). On the other hand, various approaches have been adopted in attempts to measure listening effort objectively, including the application of dual-task paradigms (Anderson Gosselin & Gagné 2011; Hornsby 2013; Wu et al. 2016) and the measurement of skin conductance responses (Mackersie & Calderon-Moultrie 2016). The task-evoked pupil dilation response is associated with both the sympathetic and parasympathetic nervous systems. Its measurement (“pupillometry”) has a long history of application as a measure of cognitive processing load (Kahneman 1973; Beatty 1982; Steinhauer et al. 2004). Within the field of hearing-related research, pupillometry has been used successfully as an index of effortful listening during speech recognition (Kramer et al. 1997; Zekveld et al. 2011; Koelewijn et al. 2014a, b). Pupil dilation has most often been measured while participants perform speech reception threshold (SRT) tests, usually conducted in a background of noise (Zekveld et al. 2010, 2011; Koelewijn et al. 2014a, b; Kramer et al. 2016; Wendt et al. 2016). Multiple parameters of the dilation response can be derived from a pupillometry measurement. The peak pupil dilation (PPD) is one of the parameters that has proven to be an effective index of changes in cognitive processing load (Zekveld et al. 2010, 2011; Koelewijn et al. 2014b; Kramer et al. 2016). To date, pupil dilation responses have been found to be sensitive to speech intelligibility level (Zekveld et al. 2010, 2011; Zekveld & Kramer 2014), type of masking noise (Koelewijn et al. 2014b), syntactic complexity (Piquado et al. 2010; Wendt et al. 2016), and divided attention (Koelewijn et al. 2014a). Research indicates that the relationship between PPD and intelligibility level (when ranging from 0% to 100% correct) has an inverted U shape, with the largest PPD usually being observed for sentence intelligibility levels around 50% correct (Zekveld & Kramer 2014; Ohlenforst et al. 2017b). Ohlenforst and colleagues observed an inverted U-shaped curve in both NH and HI listeners across a wide range of signal-to-noise ratios (SNRs). One may intuitively assume that listeners with HI would experience more effort than NH listeners when intelligibility levels are similar for both groups. Consequently, we should then expect HI listeners to show a larger PPD than NH listeners. Interestingly, two previous studies have found that in challenging listening conditions, the PPD was significantly smaller in HI participants compared with age-matched NH control groups (Zekveld et al. 2011; Kramer et al. 2016). One of the potential explanations for this apparent contradiction between hypothesized and observed effects of HI involves interactions with fatigue effects.
According to the FUEL framework, the influence of fatigue on listening effort is mainly confined to the motivation dimension, such that a fatigued individual may likely be less motivated to apply effort to the task. So far, only a few studies have attempted to explore the relationships between daily-life/task-evoked fatigue and listening effort. Participants in the study of Hornsby (2013) performed a dual-task paradigm over time, and both listening effort and subjective rating of fatigue were assessed in aided and unaided conditions. Listening effort was indexed by visual reaction times during a word recognition and recall task; subjective rating of the current level of fatigue was obtained by asking participants the following question: “How mentally/physically drained are you right now?”. The results did not indicate any associations between subjective ratings of fatigue and objectively measured (visual reaction time) listening effort. Note that Hornsby assessed transitory or task-evoked fatigue. The association between listening effort and daily-life or long-term levels of fatigue is currently still unknown. It seems plausible to expect that fatigue as experienced in daily-life situations may be associated with the motivation or the energy available to exert high levels of listening effort in any listening condition, including laboratory settings. To test this assumption, it is worthwhile to assess how the pupil response observed in laboratory tests relates to an individual’s experience of perceived fatigue in daily-life and their need to recover from fatigue on a daily basis. Insight into the nature of this relationship may inform to what extent interindividual differences in pupil dilation relate to listening effort and fatigue in daily-life settings.
The baseline pupil diameter (BPD, measured before stimulus presentation) is another pupil size parameter which is related to task engagement (Aston-Jones & Cohen 2005). Although no group effect (NH versus HI) on BPD has so far been found during the SRT test (Zekveld et al. 2011; Kramer et al. 2016), some studies have observed decreasing BPD with increasing time-on-task fatigue (Zekveld et al. 2010; Hopstaken et al. 2015a). Therefore, it is worthwhile to include measurements of BPD in the array of data to be collected.
Daily-Life Fatigue
Most people have experienced feelings of fatigue in their life. Research indicates that almost half of the adult population has complaints of fatigue (Pawlikowska et al. 1994). Anecdotal reports and qualitative studies suggest that adults with HI are more likely than NH adults to experience fatigue and lack of energy on a daily basis (Hétu et al. 1988; Kramer et al. 2006; Nachtegaal et al. 2009; Hornsby 2013). Long-term fatigue may emerge if an individual frequently experiences tiredness without adequate recovery, and this long-term fatigue may have negative effect on their quality of life and working performance. For example, Kramer et al (2006) reported that adults with HI were more likely to report sick leave because of fatigue or burnout.
The most intuitive way to assess daily-life fatigue is through self-report questionnaires (Hétu et al. 1988; Kramer et al. 2006; Nachtegaal et al. 2009; Hornsby et al. 2016). For instance, The Profile Of Mood States is a 65-item questionnaire that measures six mood states, including fatigue and vigor (Lorr et al. 1971). In a recent study by Hornsby and Kipp (2016) this questionnaire was administered to 149 adults seeking help for their hearing difficulties and compared the results to normative data. They did not find significant differences in mean fatigue ratings between their experimental group and normative data. However, significant between-group differences in vigor ratings were found, and the prevalences of both severe fatigue problems and severe vigor deficits were higher in the adults with hearing problems. The Fatigue Assessment Scale is another scale addressing both physical and mental fatigue (Michielsen et al. 2004). It is a unidimensional instrument with 10 items. Alhanbali et al. (2017) applied this instrument in both HI (including hearing aid, cochlear implant users, and people with single-sided deafness) and NH groups and reported increased levels of fatigue in the HI groups. However, like Hornsby and Kipp (2016), they found no significant correlation between severity of hearing loss and the Fatigue Assessment Scale within the group of hearing aid users. Other questionnaires focus on the effect of fatigue on daily activities or during work. An example is the Checklist Individual Strength (CIS). It is a multidimensional questionnaire intended to measure chronic fatigue (Vercoulen et al. 1994). It has been widely used in clinical settings in patient groups suffering chronic disease (Repping-Wuts et al. 2007; Rietberg et al. 2011). Similarly, Need For Recovery (NFR) is an 11-item scale measuring work-related fatigue (van Veldhoven & Broersen 2003). The concept of NFR after work reflects the ability to cope and recover from fatigue and distress at work. This factor acts as a predictor of long-term health complaints (Sluiter et al. 2003). Previous studies that used the NFR scale showed that people with HI have increased NFR after work compared with the NH peers (Nachtegaal et al. 2009). In addition, poorer outcomes on a speech-in-noise screening measure have been shown to be associated with higher NFR (Nachtegaal et al. 2009). The lack of consistency in the association between subjective ratings of daily-life fatigue and HI indicates that more research is needed in this area. In the present study, we used both CIS and NFR questionnaires to evaluate the daily-life fatigue experienced by NH and HI listeners.
To summarize, previous research has separately examined associations between listening effort and HI (see Ohlenforst et al. 2017a) and between self-reported daily-life fatigue and HI (Nachtegaal et al. 2009; Hornsby 2013; Hornsby & Kipp 2016; Hornsby et al. 2016). We may reasonably expect associations between all three factors, but no studies so far have addressed all of these factors together. Hence, the aims of the present study were (1) to investigate the relationship between HI and self-reported fatigue, (2) to examine the relationship between self-reported fatigue and objectively measured listening effort as indexed by the task-evoked pupil dilation response during speech recognition in noise, and (3) to estimate the separate contributions of hearing acuity and self-reported fatigue to the pupil dilation during a speech-in-noise task. Given these goals and the findings of previous research surveyed above, the hypotheses tested in the present study are summarized as follows:
- H1A: As a group, HI listeners report higher levels of daily-life fatigue than NH listeners.
- H1B: Within a group including both HI and NH listeners, poorer hearing thresholds are associated with higher levels of self-reported daily-life fatigue.
- H2: Higher levels of self-reported daily-life fatigue are associated with smaller PPDs during speech recognition in noise,
- H3: Hearing acuity and self-reported daily-life fatigue contribute separately to the PPD during speech recognition in noise.
METHODS
Participants
Participants were recruited from the VU University Medical Center, local community centers, and hearing aid dispensers in Amsterdam. In total, 19 (13 females) HI participants and 27 (17 females) NH participants were included in this study. The HI participants were recruited first, followed by age-matched NH individuals. We allowed a ±5 years age difference between the two groups. The mean age of the NH participants was 46.3 years (SD = 12.4), while the mean age for HI participants was 47.2 years (SD = 10.9). All participants were native Dutch speakers. Candidates with a history of neurological, psychiatric, or eye diseases that might alter the pupil response were excluded. The audiometric inclusion criterion for the NH participants was a pure-tone average (PTA) ≤20 dB HL across 250, 500, 1000, 2000, and 4000 Hz. For the HI group, the PTA had to be between 35 and 65 dB HL. Also the hearing loss had to be sensorineural (air-bone gap <10 dB between 500 and 4000 Hz) and symmetrical (the difference between left and right ears had to be <20 dB HL at one frequency or 15 dB HL at two frequencies or 10 dB HL at three frequencies across 250, 500, 1000, 2000, and 4000 Hz). The mean PTA for the NH group was 8.8 dB HL (SD = 4.6 dB HL), and it was 42.1 dB HL (SD = 9.3 dB HL) for the HI group. Participants provided informed consent for the study. The study was approved by the VU University Medical Center Ethical Committee.
Self-Report Daily-Life Fatigue Questionnaires
The questionnaires included in this study were the NFR scale (van Veldhoven & Broersen 2003) and CIS (Vercoulen et al. 1994). Both questionnaires were originally designed and validated in Dutch.
The NFR scale is an 11-item scale assessing the effects of fatigue caused by work and the NFR afterwards. It is a subscale from the Questionnaire on the Experience and Evaluation of Work, which is focused on the experience and assessment of work (van Veldhoven & Broersen 2003; de Croon et al. 2006). Examples of items included in the scale are as follows: “In general, it takes me over an hour to feel fully recovered after work,” or “At the end of the day I really feel worn out”. Possible responses are “yes” or “no”. The total NFR score is the number of “yes” responses divided by the total number of items, presented as a percentage (i.e., range 0–100). The higher the score, the greater the NFR felt by the respondent.
The multidimensional CIS questionnaire was designed to evaluate chronic fatigue and proved to be an effective questionnaire to measure fatigue in the working population (Beurskens et al. 2000). The CIS includes four dimensions: the dimension Subjective Fatigue is covered by eight items like “I feel tired” and the dimension Reduction in Motivation includes four items like “I feel no desire to do anything”. The dimension Reduction in Activity has three items, like “I don’t do much during the day”, and Reduction in Concentration, as the final dimension, has five items, for example, “My thoughts easily wander”. Each item is evaluated on a seven-point scale indexing the extent to which the particular statement applies to the participant. We used the total score of the 20 items in this study (i.e., range 20–140). Higher scores indicate a higher degree of fatigue, more concentration problems, reduced motivation, and less activity.
Speech Reception Threshold Test
For the SRT test, one set of 25 female-talker sentences was selected from the Versfeld daily Dutch sentences (Versfeld et al. 2000) and used as the target speech. The noise signal was a stream of single sentences of a male talker from the same sentence database, and the long-term averaged spectrum of the interfering talker was matched to the target speech signal. For each sentence, noise onset was 2 sec before the speech signal and continued until 3 sec after the speech offset. An adaptive procedure was used to estimate the SNR required for 50% sentence intelligibility, applying a simple one-up-one-down procedure, with SNR adjusted in 2-dB steps (Plomp & Mimpen 1979). The level of the noise signal was calibrated to 65 dB SPL for both left and right ears, and the speech signal was varied. The SNR was initially set to −10 dB. Participants were asked to repeat the target sentence after noise offset. The subsequent sentence was presented after the experimenter scored, whether or not the sentence was correctly reproduced, and a sentence was only scored as correct if the participant reproduced the sentence completely without any errors. The first target sentence was repeatedly presented with increasing SNRs in 4-dB steps until the participant gave a correct response for that sentence. This provided the starting SNR for the remaining adaptive procedure that continued until all 25 sentences were presented. Each of these remaining sentences were presented only once, and a step size of 2-dB SNR was used in the remaining adaptive procedure. The SRT was determined as the mean SNR of sentences 5 to 25. HI participants were tested without their hearing aids. However, the speech and noise signals were amplified in accordance with their pure-tone thresholds and the National Acoustic Laboratories’ linear fitting procedure, revised version (NAL-R; Byrne & Dillon 1986) rule. The NAL-R gain was applied to each ear separately.
Pupillometry
Pupil diameters of both left and right eyes (only data from the left eye were used in the analysis) were recorded by SMI RED 500 (SensoMotoric Instruments, Berlin, Germany) eye tracking system, with a sampling rate of 60 Hz and a spatial resolution of 0.03°. Pupil recording continued throughout the whole test session, but only the pupil data between noise onset (2 sec before speech onset) and noise offset (3 sec after speech offset) of each sentence was retained for later processing. The experimenter observed the quality of the collected pupil data during testing. In some cases, participants started to blink more often or lower their eyelid after a certain time of testing. The experimenter intervened when necessary to remind the participants to refrain from allowing their eyelids to close or blinking continuously, if possible.
Procedure
Participants were asked to visit the VU University Medical Center twice as part of a larger study, and the data collected during the second visit are presented in this article. A set of six questionnaires including the CIS and NFR was given to the participants during their first visit, to be completed at home and returned at the second visit.
Participants were asked not to wear eye makeup, and corrective glasses were removed during the pupillometry measurements. Participants were also instructed not to drink coffee before testing, even though recent evidence suggests that the pupil dilation response is not highly sensitive to caffeine consumption (Bardak et al. 2016). The test session took place in a sound-treated room, where auditory stimuli were presented diotically over headphones (Sennheiser, HD 280). The room illumination was controlled by an array of LEDs and had an approximate light intensity level of 360 lx. Participants were seated in a comfortable chair with the distance between the midpoint of their eyes and the center of the computer screen adjusted to approximately 55 cm. A small white dot appeared at the center of the black screen (luminance < 0.1 lx) as the eye fixation mark. We asked the participants to relax for 5 minutes before the SRT test, to rest their eyes and get used to the room illumination.
Pupil Data Processing
In accordance with the SRT test procedure in which the responses to the first four (out of 25) sentences were discarded, the pupil data from the first four sentences were discarded as well. Pupil diameters more than 3 standard deviations smaller than the mean diameter during each sentence, together with zero diameter values, were characterized as blinks. Trials were rejected if the data contained more than 20% of blinks. This resulted in the rejection of 16 out of 966 (1.6%) trials. Linear interpolations were applied to the blink periods of the remaining traces. Then a five-point moving average filter was applied to smooth the de-blinked pupil traces. For each adaptive SRT test track, the smoothed traces (maximum 21, minimum 16 traces) were time-aligned relative to the sentence onset and then averaged. Pupil parameters were derived from the averaged trace, including the BPD and the PPD amplitude. The BPD was determined as the average pupil size in the 1-sec period of noise-alone presentation immediately preceding the sentence onset. The PPD is defined as the maximum pupil dilation between sentence onset and noise offset, relative to the BPD. Readers may refer to Zekveld et al. (2010) for a more detailed description of this procedure.
Speech Intelligibility Index
We calculated the Speech Intelligibility Index (SII) corresponding to the signal and noise levels at each participant’s SRT. This is henceforth termed SII@SRT. SII@SRT provides extra information about speech understanding by quantifying the proportion of speech information that is both audible and usable for a listener (Hornsby 2004). The calculation was performed according to the ANSI S3.5-1997 standard. The equivalent noise spectrum level, the equivalent speech spectrum level (corresponding to average SNR), and each individuals’ hearing thresholds were used as the input variables to calculate the SII@SRT.
Statistical Analyses
We first examined the descriptive statistics of the two questionnaires (NFR and CIS), SRT, SII@SRT scores, and pupil parameters (BPD and PPD). One-way analyses of variance (ANOVA) were performed on the NFR and CIS scores, with hearing status (NH versus HI) as the categorical factor to test hypothesis H1A. Then we calculated the Pearson correlation coefficients between age, hearing acuity (PTA, SII@SRT), fatigue (NFR, CIS), and pupil parameters (BPD, PPD) to test hypothesis H1B and H2. Finally, to investigate hypothesis H3, a factor analysis and regression analyses were performed to break down the contributions of PTA, SII@SRT, NFR, and CIS scores to explaining the PPD.
We must note that an incident occurred in the middle of the data collection period, whereby the noise level was shifted from 65 to 54 dB SPL. This raised the starting SNR from −10 to +1 dB SNR. In total, this incident influenced the data of 19 NH participants and 8 HI participants. We investigated the potential effect of this shift in noise level and concluded that it did not affect our laboratory outcomes (SRT, PPD, and SII@SRT). The detailed description of this investigation can be found in the appendix, Supplemental Digital Content 1, http://links.lww.com/EANDH/A387.
RESULTS
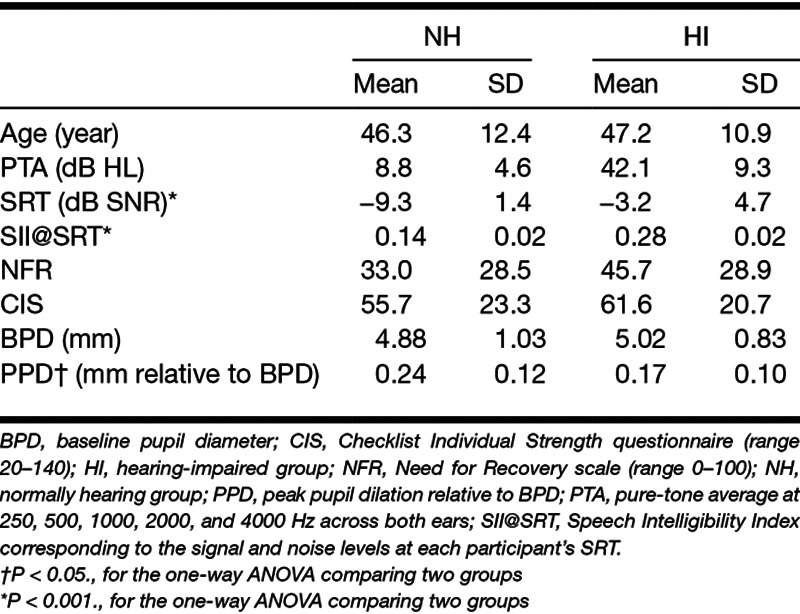
Table 1 shows the descriptive statistics of age, PTA, the SRT for 50% correct performance, the questionnaire results, the pupil parameters, and the SII, all grouped by hearing status (NH versus HI).
TABLE 1.
Descriptive statistics for age, PTA, SRT, SII@SRT, questionnaires, and pupil parameters
Behavioral Data
A one-way ANOVA showed a main effect of hearing status (F(1, 44) = 41.46, P < 0.001) on the SRTs, indicating that NH participants had a significantly lower (better) SRT than the HI participants.
Questionnaires
Both NFR and CIS scores followed normal distributions according to the frequency histograms and Q-Q plots (observed values versus theoretical quantile of normal distribution fitting) of the scores. When comparing the NH and HI groups using a one-way ANOVA, there was no significant difference in NFR score (F(1, 44) = 2.18, P = 0.15) or CIS score (F(1, 44) = 0.78, P = 0.38) between the groups, although there was a nonsignificant tendency among the HI participants to have higher self-reported fatigue in comparison with the NH participants. A multivariate analysis of variance (MANOVA) analysis combining the scores on the two questionnaires also failed to find a significant group effect (F(2, 43) = 1.07, P = 0.35).
Pupil Parameters
No significant group effect (NH versus HI) was observed when performing a one-way ANOVA on the BPD (F(1, 44) = 0.25, P = 0.62). The one-way ANOVA of the PPD showed a significant group effect, indicating that the PPD was significantly larger in the NH group than in the HI group (F(1, 44) = 4.34, P < 0.05). Figure 1 illustrates the averaged pupil dilation response relative to the BPD during the SRT test.
Figure 1.
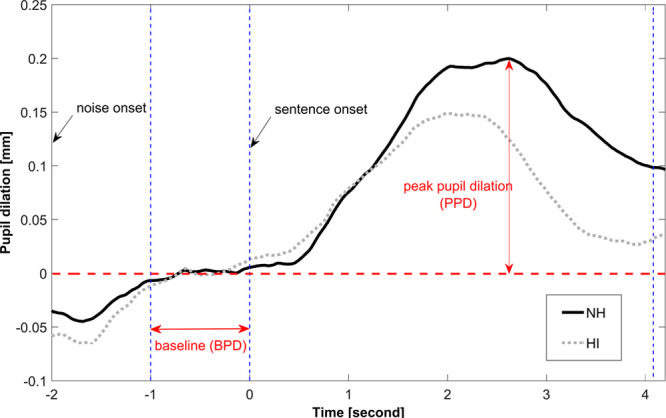
The averaged pupil dilation response relative to the baseline pupil diameter during the speech reception threshold (SRT) test. Sentence perception performance was 50% correct. HI, hearing impaired; NH, normally hearing.
Speech Intelligibility Index
The mean SII@SRT score for the NH participants was 0.14 (SD = 0.02), and it was 0.28 (SD = 0.02) for the HI group. The SII@SRT of the HI group was significantly higher than that of the NH group (F(1, 44) = 28.97, P < 0.001), indicating that audibility of the speech signal had to be higher for the HI participants for a performance of 50% correct during the SRT task.
Correlation Between Age, Hearing Acuity, Questionnaires, and Pupil Parameters
Table 2 shows the Pearson correlation coefficients between hearing acuity, the fatigue questionnaires, and the pupil parameters (BPD and PPD) for the total sample (NH + HI). The significance of each correlation coefficient was evaluated using a Bonferroni-adjusted alpha level of 0.0071 (0.05/7). There was a significant relationship between NFR and PPD (r(44) = −0.39, P < 0.0071) such that higher NFR was associated with a smaller PPD. Figure 2 shows the scatterplot of the association between NFR and PPD. The correlation between CIS and PPD was not significant (r(44) = −0.35, P = 0.018), although there was a moderate positive association between NFR and CIS (r(44) = 0.57, P < 0.001).
TABLE 2.
Pearson correlation coefficients between PTA, scores from SII@SRT, NFR, CIS, BPD, and PPD during the SRT test
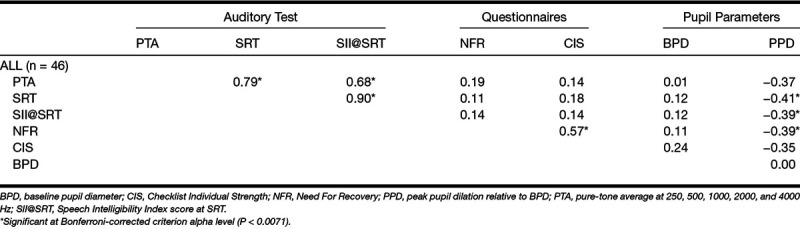
Figure 2.
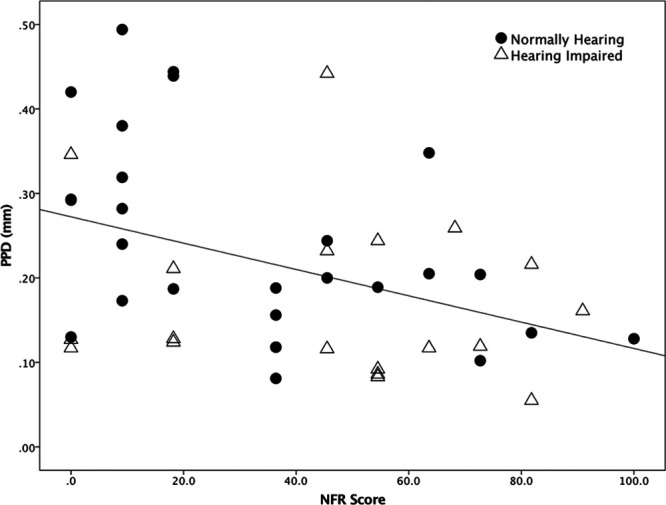
Scatterplot of peak pupil dilation (PPD) against Need For Recovery (NFR) score. The solid circle represent normally hearing (NH) participants. The solid triangles represent the hearing-impaired (HI) participants.
Moreover, we found that there were significant associations between SII@SRT and PPD (r(44) = −0.39, P < 0. 0071), SRT and PPD (r(44) = −0.41, P < 0.0071), and a marginally nonsignificant correlation between PTA and PPD (r(44) = −0.37, P = 0.013), such that larger PPD was associated with lower SII@SRT, lower (better) SRT, and (possibly) lower PTA. We failed to find any correlation between the BPD and any of the parameters mentioned above.
Multiple Regression
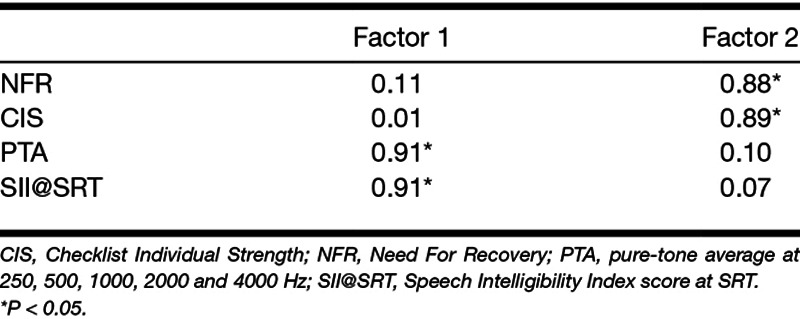
To further investigate how fatigue and hearing acuity contributed to the PPD (see H3 in the Introduction), we performed a multiple regression analysis on the data acquired from all participants (NH + HI). Beforehand, we sought the opportunity to reduce the number of variables that would be included in the multiple regression. From our correlation analysis, we found that SII@SRT and PTA were highly correlated to each other, as were NFR and CIS. Thus, we ran a factor analysis on the data of these four variables for all the participants to examine the underlying latent factor structure. The correlation matrix of the four variables was taken as the input of the factor analysis, so that the variables were standardized before the factor analysis.
Factor 1, which was mainly composed of PTA and SII@SRT values, had an eigenvalue of 1.94 and accounted for 48.4% of the variance. The second factor, which was the combination of NFR and CIS scores, had an eigenvalue of 1.31 and accounted for 32.8% of the variance. According to the results presented in Table 3, the varimax-rotated loadings of PTA and SII@SRT to Factor 1 were both 0.91, suggesting that PTA and SII@SRT were similarly strongly associated with the factor. We interpreted Factor 1 as reflecting Hearing acuity. The varimax-rotated loadings of NFR and CIS on factor 2 were 0.88 and 0.89, respectively, indicating similar associations for these two questionnaires with Factor 2. Thus, factor 2 could be interpreted as the Fatigue factor: the lower the value, the less fatigue was experienced by the participants.
TABLE 3.
Rotated factor loadings (Varimax normalized) for each of the four variables along with their groupings within the two emergent factors.
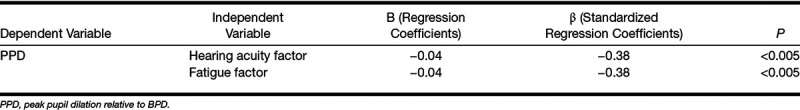
Next, we performed a multiple regression analysis with the hearing acuity and fatigue factors as predictors and PPD as dependent variable (Table 4). The results indicated that the two predictors explained 26% of the variance in PPD (R2 = 0.29, adjusted R2 = 0.26, F(2, 43) = 8.91, P < 0.001). Hearing acuity and fatigue factors contributed equally and independently to PPD (β = −0.38, P < 0.005).
TABLE 4.
Multiple regression result with PPD (R2 = 0.29, adjusted R2 = 0.26, P < 0.001) as the dependent variable and the factors hearing acuity and fatigue as the independent variables
DISCUSSION
In the present study, we acquired self-reported ratings of daily-life fatigue (NFR and CIS), measures of hearing acuity (PTA and SII@SRT), and the pupil dilation response (BPD and PPD) during an SRT test targeting 50% performance level in both NH and HI participants. The first aim of the study was to examine the difference in self-reported daily-life fatigue between NH and HI participants, as well as the relationship between fatigue and hearing acuity. The second purpose of the present study was to investigate the relationship between self-reported daily-life fatigue and objectively measured listening effort (as indexed by PPD). The third aim was to further investigate the latter relationship by examining the individual associations of self-reported daily-life fatigue and hearing acuity with the PPD. The results showed that individuals with higher levels of self-reported daily-life fatigue have smaller PPD. Hearing acuity and self-reported fatigue are independently associated with the PPD, such that poorer hearing acuity and higher levels of fatigue are associated with smaller pupil dilations.
Self-Reported Fatigue and Hearing Impairment
The results revealed no significant differences in NFR and CIS scores between the NH and HI groups, although there was a nonsignificant tendency of the HI listeners to have higher (worse) NFR and CIS scores than the NH listeners. Thus, H1A was not supported. Similarly, we did not find any associations between self-reported fatigue (NFR, CIS) and hearing acuity indices (PTA, SRT, SII@SRT). Hence, H1B was not supported either. The lack of association between fatigue and hearing acuity is not in line with the previous findings of Nachtegaal et al. (2009), but does accord with Hornsby and Kipp (2016). Hornsby and Kipp (2016) concluded that the absence of this relationship in their data was probably because of the individual variance in other abilities such as speech processing ability, which might also affect subjective ratings of fatigue. Other factors such as personal traits and anxiety may act as better predictors of self-reported fatigue than hearing acuity. For instance, Jiang et al. (2003) found that self-reported fatigue was strongly associated with trait anxiety and harm avoidance (derived from a psychobiological model of personality). The nature of the current data set did not allow us to test this type of explanation. To the best of our knowledge, the CIS questionnaire has not been used to evaluate differences in fatigue between NH and HI groups before. The close correlation between CIS and NFR may indicate that they were tapping into the same dimension of fatigue.
Self-Reported Fatigue and Pupil Dilation Response During Listening Task
As far as we know, this is the first study to examine the correlation between subjectively assessed daily-life fatigue and objectively measured PPD during speech perception. We found a moderate negative correlation between the NFR score and PPD during the SRT test targeting 50% performance (higher levels of fatigue were associated with smaller PPDs), supporting H2. According to the hitherto dominant interpretation of larger PPD as reflecting greater cognitive processing effort (Zekveld et al. 2010; Koelewijn et al. 2014a), our result seems to indicate that a more fatigued individual will expend less—not more—resources to achieve the same intelligibility level. These results can be reconciled if the modulation of motivation by fatigue, as posited in the FUEL framework (Pichora-Fuller et al. 2016), is considered. Using this interpretation, fatigued individuals may be less motivated to perform well in the SRT test and will exert less effort to perform the task, resulting in a reduction of the PPD (Zekveld & Kramer 2014; Ohlenforst et al. 2017a).
However, we failed to observe any significant correlation between fatigue and task performance, as indicated by the SRT score. The relatively strong associations observed between SRT and PTA/SII@SRT suggest that the SRT is predominantly reflecting hearing acuity in the present data set. It is not implausible to think that motivation might also be associated with the task performance. As such, an independent assessment of motivation might be helpful in future studies.
Previous studies have observed a decline in the BPD after a certain testing time and have ascribed this to the onset and progression of task-related fatigue (Zekveld et al. 2010; Hopstaken et al. 2015a). The present study showed no relationship between self-reported daily-life fatigue and BPD (averaged across 21 sentences). Given that the average testing time in the present study was around half an hour, which is relatively short compared to experiments designed to induce task-related fatigue, we do not expect our BPD data to be strongly influenced by task-related fatigue effects. The contrast between these two types of results tends to reinforce the idea that daily-life fatigue and task-related fatigue are qualitatively different phenomena.
The Contributions of Self-Reported Fatigue and Hearing Acuity to Pupil Dilation Response
In the present study, we found that HI participants had a smaller PPD than NH participants when performing an SRT task targeting 50% correct. This result is in line with previous research (Zekveld et al. 2010; Kramer et al. 2016; Ohlenforst et al. 2017b). To gain a better understanding of this result, we further examined the relationship between hearing acuity, self-reported fatigue, and PPD. Alongside the significant correlation between self-reported fatigue and PPD, we also found that poorer hearing as reflected by the PTA and SII@SRT was associated with smaller PPD. Taken together, both fatigue and hearing acuity were related to smaller PPDs, while there was no direct association between fatigue and hearing acuity. Therefore, the current findings might indicate independent associations of hearing acuity and self-reported fatigue with PPD. The results from the factor analysis and multiple regression analysis further confirmed these independent associations. We found that both fatigue (CIS + NFR) and the hearing acuity factor (PTA + SII@SRT) showed significant, and almost equal, negative associations with the PPD during listening, and the two factors accounted for 26% of the variance in PPD. Less fatigue and better auditory sensitivity were associated with larger PPDs during the SRT test. The associations we found do not establish causality, but the most plausible direction of causality would seem to be that daily-life fatigue and auditory acuity are precursors of PPD, rather than vice versa. Meanwhile, an as-yet unidentified common cause behind all three cannot be excluded.
The reason why the SRT was not included in the multiple regression analysis was that the SII@SRT provides more information about hearing acuity than the SRT in itself. We observed a moderate correlation coefficient between SRT and PTA in this study, which typically means that the provided audibility was insufficient, although the loss of hearing sensitivity was partly compensated for by the application of gain according to the NAL-R prescription. Humes (2007) has shown that the gain prescribed by NAL-R above 4 kHz does not fully compensate for the loss of audibility. If audibility had been fully compensated, we would expect to observe a weaker correlation between SRT and PTA. The SII calculation takes audibility into account, whereas the SRT does not directly. Therefore, we used the SII in the analysis.
Probably, the most important finding of the present study is the demonstration of significant associations between the PPD and both self-reported daily-life fatigue and hearing acuity, without a significant association between fatigue and hearing acuity. Given the important role of cognition in speech recognition tasks, it is possible that the ability to distinguish the target talker from the competing talker plays a role in the association between hearing acuity and PPD. For instance, Petersen et al. (2017) found that individuals with worse hearing showed a weaker neural tracking when differentiating an attended talker from a competing one, while Kuchinsky et al. (2014) found that training of speech perception in older adults with hearing loss could result in an increased pupil dilation during a word recognition in noise task. Thus, it is possible that the larger pupil dilation we observed in the NH group actually reflects a more salient perception of the target speaker compared to the HI group.
Meanwhile, the independent contribution of fatigue to the PPD may stem from the autonomic nervous system, which controls the pupil dilation response. Recent findings from Hopstaken et al (2015a) suggest a possible link between mental fatigue and task disengagement associated with the locus coeruleus norepinephrine (LC-NE) system. The LC-NE system is known to be related to task engagement and sympathetic arousal (Aston-Jones & Cohen 2005). Aston-Jones and Cohen (2005, p.431) proposed that “descending regulation of LC suggests a mechanism for volitional control of waking in the face of fatigue.” Hopstaken et al. (2015b) observed that increasing task-related mental fatigue coincided with a diminished pupil dilation response, which suggested the possible involvement of the LC-NE system during task disengagement caused by mental fatigue. Speculatively, the present findings may indicate that daily-life fatigue may also affect the pupil dilation response through the LC-NE system. Importantly, this appears not to be strongly dependent on hearing acuity. The data collected in the present study do not provide further elucidation on these potential explanations.
Limitations
There are several limitations of the present study that need to be mentioned. First, we measured objective listening effort and subjective daily-fatigue in the present study. We might have gained more insight into the associations between listening effort and fatigue if we had also included both subjective measurement of listening effort (self-rating of perceived listening effort) and objective measurement of fatigue (task-induced fatigue). Second, the present study tested SRT only at 50% performance level. Inclusion of more intelligibility levels (84%, 100%) would certainly be helpful to gain more insight into how the pupil dilation response related to fatigue. Third, the NH and HI groups by themselves were too small to establish reliable correlational findings within each group, so correlation analyses are only valid for the total NH + HI sample. Finally, for the SII calculation, we used the long-term root mean square level of the noise signal, that is, assumed a steady noise, whereas the actual noise signal was a single talker. The SII@SRT estimates might have been improved if we had used a time-varying SII approach as proposed by Rhebergen and Versfeld (2005).
CONCLUSION
The most important and novel finding of this study is the demonstration of significant associations between the PPD and both self-reported daily-life fatigue and hearing acuity, without a significant association between fatigue and hearing acuity. Daily-life fatigue may, thus, be one of the factors explaining interindividual differences in PPD such as are often observed in studies using PPD as an index of listening effort. The detailed interactions between listening effort, fatigue, and hearing loss remain to be clarified.
ACKNOWLEDGMENTS
This article presents independent research funded by the European Commission (grant FP7-LISTEN607373). Co-author G.N. was supported by grant U135097131 from the UK Medical Research Council and by a grant from the Chief Scientist Office.
Supplementary Material
Footnotes
The authors have no conflicts of interest to disclose.
Supplemental digital content is available for this article. Direct URL citations appear in the printed text and are provided in the HTML and text of this article on the journal’s Web site (www.ear-hearing.com).
REFERENCES
- Alhanbali S., Dawes P., Lloyd S., et al. Self-reported listening-related effort and fatigue in hearing-impaired adults. Ear Hear, 2017). 38, e39–e48.. [DOI] [PubMed] [Google Scholar]
- Anderson Gosselin P., Gagné J. P.Older adults expend more listening effort than young adults recognizing speech in noise. J Speech Lang Hear Res, 2011). 54, 944–958.. [DOI] [PubMed] [Google Scholar]
- Aston-Jones G., Cohen J. D.Adaptive gain and the role of the locus coeruleus-norepinephrine system in optimal performance. J Comp Neurol, 2005). 493, 99–110.. [DOI] [PubMed] [Google Scholar]
- Bardak H., Gunay M., Mumcu U., et al. Effect of single administration of coffee on pupil size and ocular wavefront aberration measurements in healthy subjects. Biomed Res Int, 2016). 2016, 9578308. [DOI] [PMC free article] [PubMed] [Google Scholar]
- Beatty J.Task-evoked pupillary responses, processing load, and the structure of processing resources. Psychol Bull, 1982). 91, 276–292.. [PubMed] [Google Scholar]
- Beurskens A. J., Bültmann U., Kant I., et al. Fatigue among working people: validity of a questionnaire measure. Occup Environ Med, 2000). 57, 353–357.. [DOI] [PMC free article] [PubMed] [Google Scholar]
- Byrne D., Dillon H.The National Acoustic Laboratories’ (NAL) new procedure for selecting the gain and frequency response of a hearing aid. Ear Hear, 1986). 7, 257–265.. [DOI] [PubMed] [Google Scholar]
- Dawes P., Munro K. J., Kalluri S., et al. Acclimatization to hearing aids. Ear Hear, 2014). 35, 203–212.. [DOI] [PubMed] [Google Scholar]
- de Croon E. M., Sluiter J. K., Frings-Dresen M. H.Psychometric properties of the Need for Recovery after work scale: test-retest reliability and sensitivity to detect change. Occup Environ Med, 2006). 63, 202–206.. [DOI] [PMC free article] [PubMed] [Google Scholar]
- DeLongis A., Folkman S., Lazarus R. S.The impact of daily stress on health and mood: psychological and social resources as mediators. J Pers Soc Psychol, 1988). 54, 486–495.. [DOI] [PubMed] [Google Scholar]
- Dwyer N. Y., Firszt J. B., Reeder R. M.Effects of unilateral input and mode of hearing in the better ear: self-reported performance using the speech, spatial and qualities of hearing scale. Ear Hear, 2014). 35, 126–136.. [DOI] [PMC free article] [PubMed] [Google Scholar]
- Edwards B.The future of hearing aid technology. Trends Amplif, 2007). 11, 31–45.. [DOI] [PMC free article] [PubMed] [Google Scholar]
- Gatehouse S., Noble W.The Speech, Spatial and Qualities of Hearing Scale (SSQ). Int J Audiol, 2004). 43, 85–99.. [DOI] [PMC free article] [PubMed] [Google Scholar]
- Hasson D., Theorell T., Liljeholm-Johansson Y., et al. Psychosocial and physiological correlates of self-reported hearing problems in male and female musicians in symphony orchestras. Int J Psychophysiol, 2009). 74, 93–100.. [DOI] [PubMed] [Google Scholar]
- Hétu R., Riverin L., Lalande N., et al. Qualitative analysis of the handicap associated with occupational hearing loss. Br J Audiol, 1988). 22, 251–264.. [DOI] [PubMed] [Google Scholar]
- Hopstaken J. F., van der Linden D., Bakker A. B., et al. A multifaceted investigation of the link between mental fatigue and task disengagement. Psychophysiology, 2015a). 52, 305–315.. [DOI] [PubMed] [Google Scholar]
- Hopstaken J. F., van der Linden D., Bakker A. B., et al. The window of my eyes: task disengagement and mental fatigue covary with pupil dynamics. Biol Psychol, 2015b). 110, 100–106.. [DOI] [PubMed] [Google Scholar]
- Hornsby B. W.The Speech Intelligibility Index: what is it and what’s it good for? Hear J, 2004). 57, 10–17.. [Google Scholar]
- Hornsby B. W.The effects of hearing aid use on listening effort and mental fatigue associated with sustained speech processing demands. Ear Hear, 2013). 34, 523–534.. [DOI] [PubMed] [Google Scholar]
- Hornsby B. W., Kipp A. M.Subjective ratings of fatigue and vigor in adults with hearing loss are driven by perceived hearing difficulties not degree of hearing loss. Ear Hear, 2016). 37, e1–10.. [DOI] [PMC free article] [PubMed] [Google Scholar]
- Hornsby B. W., Naylor G., Bess F. H.A taxonomy of fatigue concepts and their relation to hearing loss. Ear Hear, 2016). 37(suppl 1), 136S–144S.. [DOI] [PMC free article] [PubMed] [Google Scholar]
- Humes L. E.The contributions of audibility and cognitive factors to the benefit provided by amplified speech to older adults. J Am Acad Audiol, 2007). 18, 590–603.. [DOI] [PubMed] [Google Scholar]
- Jiang N., Sato T., Hara T., et al. Correlations between trait anxiety, personality and fatigue: study based on the Temperament and Character Inventory. J Psychosom Res, 2003). 55, 493–500.. [DOI] [PubMed] [Google Scholar]
- Kahneman D.Attention and Effort. 1973). Englewood Cliffs, NJ: Prentice-Hall. [Google Scholar]
- Koelewijn T., Shinn-Cunningham B. G., Zekveld A. A., et al. The pupil response is sensitive to divided attention during speech processing. Hear Res, 2014a). 312, 114–120.. [DOI] [PMC free article] [PubMed] [Google Scholar]
- Koelewijn T., Zekveld A. A., Festen J. M., et al. The influence of informational masking on speech perception and pupil response in adults with hearing impairment. J Acoust Soc Am, 2014b). 135, 1596–1606.. [DOI] [PubMed] [Google Scholar]
- Kramer S. E., Kapteyn T. S., Festen J. M., et al. Assessing aspects of auditory handicap by means of pupil dilatation. Audiology, 1997). 36, 155–164.. [DOI] [PubMed] [Google Scholar]
- Kramer S. E., Kapteyn T. S., Houtgast T.Occupational performance: comparing normally-hearing and hearing-impaired employees using the Amsterdam Checklist for Hearing and Work. Int J Audiol, 2006). 45, 503–512.. [DOI] [PubMed] [Google Scholar]
- Kramer S. E., Teunissen C. E., Zekveld A. A.Cortisol, chromogranin A, and pupillary responses evoked by speech recognition tasks in normally hearing and hard-of-hearing listeners: a pilot study. Ear Hear, 2016). 37(suppl 1), 126S–135S.. [DOI] [PubMed] [Google Scholar]
- Kuchinsky S. E., Ahlstrom J. B., Cute S. L., et al. Speech-perception training for older adults with hearing loss impacts word recognition and effort. Psychophysiology, 2014). 51, 1046–1057.. [DOI] [PMC free article] [PubMed] [Google Scholar]
- Lorr M., McNair D., Droppleman L.Manual: Profile of Mood States. 1971). San Diego, CA: Educational and Industrial Testing Service. [Google Scholar]
- Mackersie C. L., Calderon-Moultrie N.Autonomic nervous system reactivity during speech repetition tasks: heart rate variability and skin conductance. Ear Hear, 2016). 37(suppl 1), 118S–125S.. [DOI] [PubMed] [Google Scholar]
- McGarrigle R., Munro K. J., Dawes P., et al. Listening effort and fatigue: what exactly are we measuring? A British Society of Audiology Cognition in Hearing Special Interest Group ‘white paper’. Int J Audiol, 2014). 53, 433–440.. [DOI] [PubMed] [Google Scholar]
- Michielsen H. J., De Vries J., Van Heck G. L., et al. Examination of the dimensionality of fatigue: the construction of the Fatigue Assessment Scale (FAS). Eur J Psychol Assess, 2004). 20, 39. [Google Scholar]
- Nachtegaal J., Kuik D. J., Anema J. R., et al. Hearing status, need for recovery after work, and psychosocial work characteristics: results from an internet-based national survey on hearing. Int J Audiol, 2009). 48, 684–691.. [DOI] [PubMed] [Google Scholar]
- Ohlenforst B., Zekveld A. A., Jansma E. P., et al. Effects of hearing impairment and hearing aid amplification on listening effort: a systematic review. Ear Hear, 2017a). 38, 267–281.. [DOI] [PMC free article] [PubMed] [Google Scholar]
- Ohlenforst B., Zekveld A. A., Lunner T., et al. Impact of stimulus-related factors and hearing impairment on listening effort as indicated by pupil dilation. Hear Res, 2017b). 351, 68–79.. [DOI] [PubMed] [Google Scholar]
- Pawlikowska T., Chalder T., Hirsch S. R., et al. Population based study of fatigue and psychological distress. BMJ, 1994). 308, 763–766.. [DOI] [PMC free article] [PubMed] [Google Scholar]
- Petersen E. B., Wöstmann M., Obleser J., et al. Neural tracking of attended versus ignored speech is differentially affected by hearing loss. J Neurophysiol, 2017). 117, 18–27.. [DOI] [PMC free article] [PubMed] [Google Scholar]
- Pichora-Fuller M. K., Kramer S. E.Eriksholm workshop on hearing impairment and cognitive energy. Ear Hear, 2016). 37, 1S–4S.. [DOI] [PubMed] [Google Scholar]
- Pichora-Fuller M. K., Kramer S. E., Eckert M. A., et al. Hearing impairment and cognitive energy: the Framework for Understanding Effortful Listening (FUEL). Ear Hear, 2016). 37(suppl 1), 5s–27s.. [DOI] [PubMed] [Google Scholar]
- Piquado T., Isaacowitz D., Wingfield A.Pupillometry as a measure of cognitive effort in younger and older adults. Psychophysiology, 2010). 47, 560–569.. [DOI] [PMC free article] [PubMed] [Google Scholar]
- Plomp R., Mimpen A. M.Improving the reliability of testing the speech reception threshold for sentences. Audiology, 1979). 18, 43–52.. [DOI] [PubMed] [Google Scholar]
- Repping-Wuts H., Fransen J., van Achterberg T., et al. Persistent severe fatigue in patients with rheumatoid arthritis. J Clin Nurs, 2007). 16(11C), 377–383.. [DOI] [PubMed] [Google Scholar]
- Rhebergen K. S., Versfeld N. J.A Speech Intelligibility Index-based approach to predict the speech reception threshold for sentences in fluctuating noise for normal-hearing listeners. J Acoust Soc Am, 2005). 117(4 pt 1), 2181–2192.. [DOI] [PubMed] [Google Scholar]
- Rietberg M. B., van Wegen E. E., Uitdehaag B. M., et al. The association between perceived fatigue and actual level of physical activity in multiple sclerosis. Mult Scler, 2011). 17, 1231–1237.. [DOI] [PubMed] [Google Scholar]
- Sluiter J. K., de Croon E. M., Meijman T. F., et al. Need for recovery from work related fatigue and its role in the development and prediction of subjective health complaints. Occup Environ Med, 2003). 60(suppl 1), i62–i70.. [DOI] [PMC free article] [PubMed] [Google Scholar]
- Steinhauer S. R., Siegle G. J., Condray R., et al. Sympathetic and parasympathetic innervation of pupillary dilation during sustained processing. Int J Psychophysiol, 2004). 52, 77–86.. [DOI] [PubMed] [Google Scholar]
- van Veldhoven M., Broersen S.Measurement quality and validity of the “need for recovery scale”. Occup Environ Med, 2003). 60(suppl 1), i3–i9.. [DOI] [PMC free article] [PubMed] [Google Scholar]
- Vercoulen J. H., Swanink C. M., Fennis J. F., et al. Dimensional assessment of chronic fatigue syndrome. J Psychosom Res, 1994). 38, 383–392.. [DOI] [PubMed] [Google Scholar]
- Versfeld N. J., Daalder L., Festen J. M., et al. Method for the selection of sentence materials for efficient measurement of the speech reception threshold. J Acoust Soc Am, 2000). 107, 1671–1684.. [DOI] [PubMed] [Google Scholar]
- Wendt D., Dau T., Hjortkjær J.Impact of background noise and sentence complexity on processing demands during sentence comprehension. Front Psychol, 2016). 7, 345. [DOI] [PMC free article] [PubMed] [Google Scholar]
- Wu Y. H., Stangl E., Zhang X., et al. Psychometric functions of dual-task paradigms for measuring listening effort. Ear Hear, 2016). 37, 660–670.. [DOI] [PMC free article] [PubMed] [Google Scholar]
- Zekveld A. A., Kramer S. E.Cognitive processing load across a wide range of listening conditions: insights from pupillometry. Psychophysiology, 2014). 51, 277–284.. [DOI] [PubMed] [Google Scholar]
- Zekveld A. A., Kramer S. E., Festen J. M.Pupil response as an indication of effortful listening: the influence of sentence intelligibility. Ear Hear, 2010). 31, 480–490.. [DOI] [PubMed] [Google Scholar]
- Zekveld A. A., Kramer S. E., Festen J. M.Cognitive load during speech perception in noise: the influence of age, hearing loss, and cognition on the pupil response. Ear Hear, 2011). 32, 498–510.. [DOI] [PubMed] [Google Scholar]