Objective:
The reliability of the electrically evoked compound action potential (eCAP) threshold depends on its precision and accuracy. The precision of the eCAP threshold reflects its variability, while the accuracy of the threshold shows how close it is to the actual value. The objective of this study was to determine the test/retest variability of the eCAP threshold in Advanced Bionics cochlear implant users, which has never been reported before. We hypothesized that the test/retest variability is dependent on the presence of random noise in the recorded eCAP waveforms. If this holds true, the recorded error should be reduced by approximately the square-root of the number of averages. As secondary objectives, we assessed the effects of the slope of the amplitude growth function (AGF), cochlear location, and eCAP threshold on eCAP threshold precision. We hypothesized that steeper slopes should result in better precision of the linearly extrapolated eCAP threshold. As other studies have shown that apical regions have steeper slopes and larger eCAPs, we recorded eCAPs in three different cochlear locations. The difference of the precision between two commonly applied stimulus-artifact reduction paradigms on eCAP threshold precision was compared, namely averaging of alternating stimulus polarities (AP averaging) and forward masking (FM). FM requires the addition of more waveforms than AP averaging, and hence we expected FM to have lower precision than AP.
Design:
This was an unmasked, descriptive, and observational study with a cross-over (repeated measures) design that included 13 subjects. We recorded eCAPs on three electrode contacts: in the base, middle, and apex of the cochlea at 10 stimulus intensities. Per stimulus level, 256 eCAP waveforms were recorded. eCAP thresholds were determined by constructing AGFs and linear extrapolation to zero-amplitude. The precision of the eCAP threshold was calculated as the SD using a Monte Carlo simulation, as a function of the number of waveform averages.
Results:
The SD of the eCAP threshold was reduced by approximately the square root of two when the number of averages in the eCAP waveforms was doubled. The precision was significantly better when the slope of the AGF was steeper and was more favorable in the cochlear base than in the apex. Precision was better when AP averaging was used. Absolute eCAP threshold did not significantly affect precision. At the default number of 32 waveform averages in the Advanced Bionics system, we report a median SD of the eCAP threshold of 2 to 3 μA, with a range of 1 to 11 μA across the cochlea. Previous studies have shown that the total error, based on the 95% confidence bounds of the linear extrapolation, can be as high as −260 to +120 μA.
Conclusions:
The median variability in the eCAP threshold proved to be small compared with the total variability introduced by the linear extrapolation method. Yet there was substantial intersubject variability. Therefore, we recommend monitoring the SD during eCAP recording to facilitate informed decisions when to terminate waveform collection. From a precision perspective, AP averaging is preferable over FM as it has better precision, while fewer recordings are needed, making it the more time-efficient method of the two.
Keywords: Accuracy, Amplitude growth function, Cochlear implant, Electrically evoked compound action potential, Precision
INTRODUCTION
State-of-the-art cochlear implants (CI) systems have a telemetry function to record the electrically evoked compound action potential (eCAP) of the auditory nerve. In the Advanced Bionics fitting software (SoundWave) this is referred to as neural response imaging (Frijns et al. 2002; Hughes 2010). eCAP amplitudes increase when higher stimulus levels are applied. This relationship can be visualized in an amplitude growth function (AGF), where the eCAP amplitude is plotted as function of stimulus level. From the AGF, the eCAP threshold can be estimated, which is defined as the minimum amount of current that evokes a measurable eCAP response. A commonly applied measure of the eCAP threshold current is the linearly extrapolated current level where the eCAP response has zero amplitude (Hughes 2010; Glassman et al. 2013; Biesheuvel et al. 2018).
The reliability of the eCAP threshold depends on its precision and accuracy (Fig. 1). Precision is defined as the closeness or variability of measurements of the same quantity as obtained with repeated measures. Accuracy reflects the nearness of a measurement to the actual value of a quantity (Zar 1999). eCAP thresholds have received quite some attention in terms of their accuracy, that is, whether they faithfully reflect psychophysically determined thresholds. Assessment of the accuracy of the eCAP threshold is important when it is considered as an objective measure for fitting purposes (e.g., Brown et al. 2000; Hughes et al. 2000; Franck et al. 2001; Thai-Van et al. 2004; Botros & Psarros 2010; Joly et al. 2017; Biesheuvel et al. 2018). The precision of eCAP thresholds has been less well-documented. Precision may, however, be as important as eCAP accuracy because eCAP thresholds with large test/retest variabilities may have limited value for fitting purposes. Despite the fact that the eCAP threshold is a widely used measure, its test/retest variability has never been reported in the peer-reviewed literature for any CI system. A conference article was published on this topic where the Med-El system was used (Hey & Begall, Reference Note 1, article in German). We do not discuss its contents here, as the number of subjects is not mentioned in the article, and the data are not supported by statistical analyses.
Fig. 1.
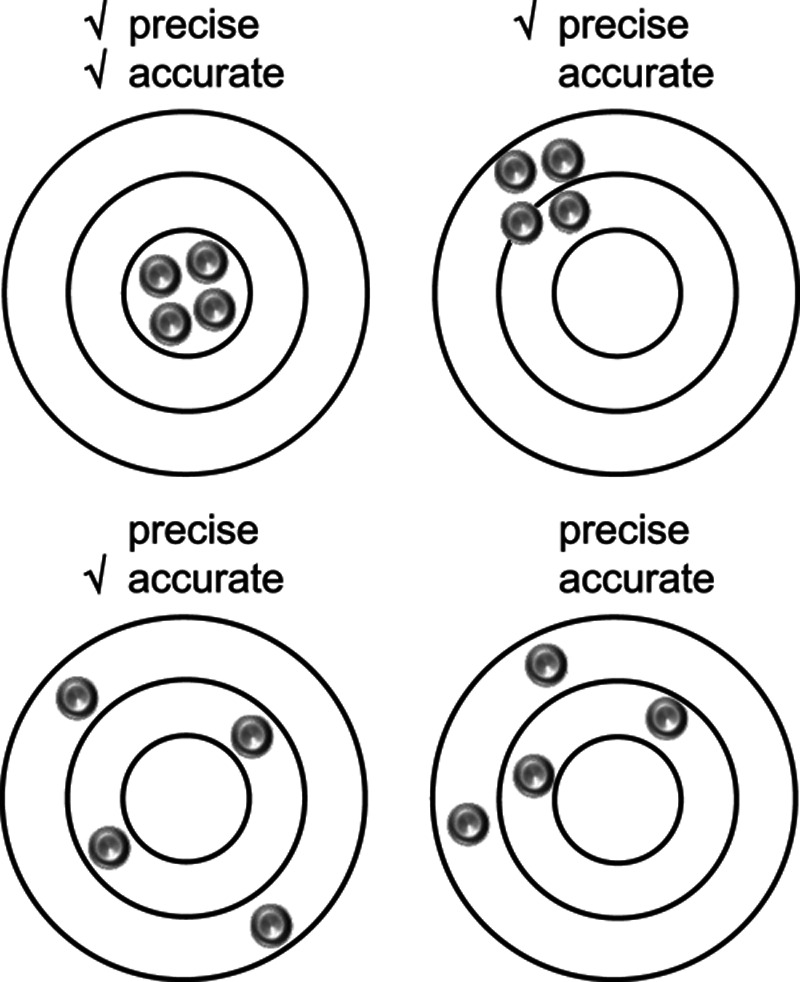
Graphical representation of the meaning of precision and accuracy in measured data. In this study, we determined the precision of the electrically evoked compound action potential threshold in Advanced Bionics cochlear implant users.
One factor that determines the precision of eCAP measurements is the background noise in the recording. Background noise is superimposed on the eCAP signal and affects eCAP amplitude measures (Hey & Müller-Deile 2015). It is believed to be introduced mainly by the implant electronics, as eCAPs are relatively immune to physiological contaminants from neural and muscular activity (Miller et al. 2008; Undurraga et al. 2012). Therefore, noise levels will be dependent on the system under investigation. Reported noise floors in the Advanced Bionics device are in the order of 20 μV peak-to-peak amplitude (Jeon et al. 2010; Glassman & Hughes 2013).
An important parameter in this regard is the number of waveform averages. Averaging of multiple eCAP waveforms to reduce background noise is referred to as ensemble averaging. By default, the SoundWave system from Advanced Bionics records 32 waveforms. Because background noise in eCAP recordings in Advanced Bionics devices has been shown to be stationary and normally distributed (Undurraga et al. 2012), the maximal theoretical noise reduction factor is √n, with n being the number of waveform averages. For example, a doubling of the number of averages reduces the background noise in the eCAP waveform with a factor of √2 = 1.4 (Undurraga et al. 2012; Hey & Müller-Deile 2015). The effect of averaging on the eCAP threshold has never been investigated. Our expectation was to find an effect of averaging on the threshold comparable to that on the background noise, namely equal to √n. However, as multiple eCAP amplitudes are used in an AGF, the averaging may yield a cumulative benefit larger than √n.
Moreover, background noise in the eCAP waveform is dependent on the artifact reduction paradigm (Fig. 2). By default, SoundWave deploys an averaging of alternating stimulus polarities (AP averaging). Another widely used artifact reduction method is forward masking (FM), which is based on the refractory characteristics of the auditory nerve (Miller et al. 2000). FM has been shown to result in more accurate eCAP waveforms, in part because the responses to stimuli of different polarities may yield eCAPs with different latencies and/or amplitudes, thereby affecting the averaged eCAP waveform (Miller et al. 2000; Klop et al. 2004; Baudhuin et al. 2016). FM does not have this disadvantage, as waveforms can be generated with stimuli of identical polarity. FM has the disadvantage that it needs more recordings as AP averaging, namely: masker (M), probe (P), a masker + probe double pulse (M + P), and in our case also a ‘signature’ (S) recording that registers the switching artifact introduced by the implant electronics (Lai & Dillier 2000; Hughes 2013). The FM response can be obtained by eCAP = M + P − [M + P] − S (Fig. 2). Therefore, the FM increases the noise by √4, as it adds and subtracts four traces. Because the AP method averages two responses, the resulting eCAP has √2 less noise than the two input traces. The net effect is hence a 2.8 higher noise level for FM.
Fig. 2.
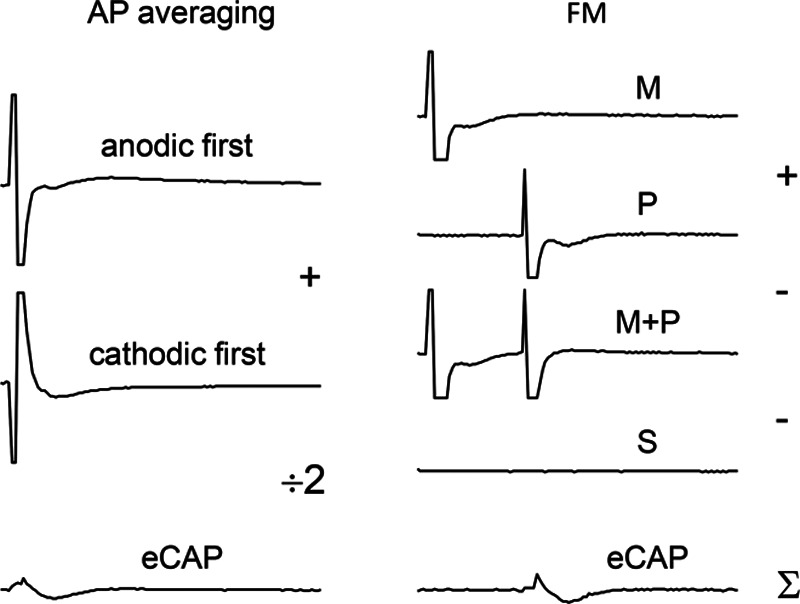
Sample traces illustrating AP averaging (left) and FM (right). Because AP averaging uses an average of 2 traces, background noise is reduced with √2, whereas FM increases noise by a factor of √4 due to the addition/subtraction of 4 traces. AP, alternating polarity; FM, forward masking; M, masker; P, probe; M + P, masker-probe double-pulse; S, signature trace including the switching artifact (too small to be observable on the scale used).
There are also physiological determinants of eCAP threshold variability; the cochlear base has been reported to feature steeper AGF and larger eCAPs, which reportedly leads to lower variability of extrapolated thresholds (Abbas & Miller 2004; Brill et al. 2009; Van de Heyning et al. 2016; Biesheuvel et al. 2018).
This study complements a recent study by Biesheuvel et al. (2018), who report 95% confidence bounds of the linearly extrapolated eCAP threshold of −260 to +120 μA (−110 to +50 CU). This variability is considerable, given that eCAP thresholds are in the same order of magnitude. The reported regression confidence bounds by Biesheuvel et al. take into account any random variability, notably the background noise of the eCAP waveforms and nonlinearities in the AGF.
In the present study, we isolated the contribution of the background noise in the eCAP threshold. To this end, the test/retest variability of the eCAP threshold was determined using a Monte Carlo (MC) simulation by repeatedly fitting a linear regression line through the same set of stimulus levels in the AGF. The only factor affecting the precision was the random background noise. This test/retest variability of the eCAP threshold has not been documented before. We expected that waveform averaging reduces the SD of the eCAP threshold by √n. AC was expected to yield a 2.8 times lower SD than FM. The SD was hypothesized to be most favorable in the apex and to have a negative correlation with AGF slope. Larger nominal eCAP thresholds were expected to increase the SD.
METHODS
Demographics
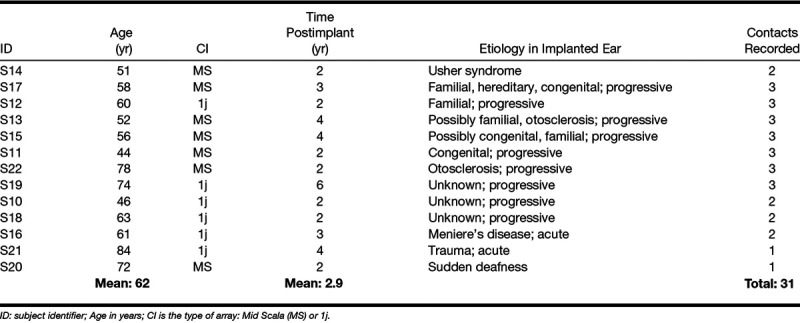
Thirteen Subjects implanted with a HiRes90K implant participated in this study. Postoperative x ray scans available in 12 subjects revealed that the implants were fully inserted. From one subject no x ray was available, but the surgical report confirmed also a full insertion in this subject. Seven subjects were implanted with a HiFocus Mid-Scala (HFMS), and the other six with a HiFocus 1j lateral wall array (Advanced Bionics, Valencia, CA). These arrays feature 16 electrodes. The HFMS is a precurved array designed for a mid-scalar positioning. Its full-insertion length is 18 mm and its diameter varies from approximately 0.5 mm at the most apical contact to approximately 0.7 mm at the most basal contact. The contacts have a surface of 0.43 by 0.39 mm and are spaced 0.9 mm apart. The 1j electrode array is less curved than the HFMS for a more outer wall positioning. It has a slightly longer insertion depth of 20 mm and it is slimmer, with a diameter of 0.4 mm at the apical contact to 0.8 mm at the basal contact. The contacts are a little larger, with a surface area of 0.5 by 0.4 mm, and their spacing is slightly larger, namely 1.1 mm (Van der Jagt et al. 2016). Subjects were randomly selected from CI recipients in our hospital. The two selection criteria included were as follows: (1) at least one-year experience with their CI and (2) a consonent-vowel-consonant (CVC) phoneme score above 75% (note this is different from a CVC word score; only the poorest of listeners were excluded in this study). Speech perception performance was a criterion as the experiments outlined here were part of a larger study. In those other substudies, speech perception was more relevant than in the present study. Written informed consent was obtained from each subject. This study was approved by the Institutional Review Board of the Leiden University Medical Center and adhered to the tenets of the Declaration of Helsinki (Carlson et al. 2004). The demographics are shown in Table 1.
TABLE 1.
Subject demographics
Electrophysiology and Signal Processing
eCAPs were recorded using the Bionic Ear Data Collection System (BEDCS) research software (Advanced Bionics, Valencia, CA). eCAPs were evoked with monopolar, biphasic pulses with a phase duration of 32 µsec. The recording contact was located two electrodes apical from the stimulating contact and sampled at 56 kHz. To reduce the stimulus artifact, eCAPs were recorded to alternating stimulus polarities and averaged. AP averaging is the standard artifact reduction method applied in the Advanced Bionics system. We additionally tested a FM paradigm (Miller et al. 2000) using anodic-first pulses and a masker-to-probe interval of 500 µsec (Hughes 2013). The recording time window was 3 msec with a gain of 300 (the default in the Advanced bionics system). A total of 256 eCAP traces were recorded per current level, and stored as 32 ‘bins’ of 8-waveform subaverages (Fig. 3). This subaveraging strategy was used to save time, as the BEDCS software saved every bin individually, which was the rate-limiting step in the measurement. We low-pass filtered the raw waveforms in the subaveraged bins before the MC simulation to explicitly determine the benefits of waveform averaging on the eCAP threshold. A zero-phase shift, 4th-order Butterworth filter with a cut-off frequency of 8.4 kHz was used for this purpose. The resulting filtered waveforms in the subaveraged bins were used for further analysis.
Fig. 3.
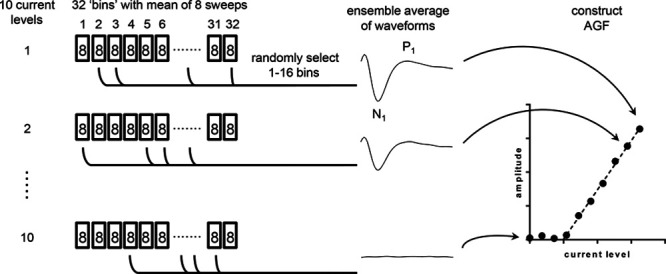
Overview of the Monte Carlo simulation: 256 eCAPs were recorded for each of the 10 current levels (including 0 μA) and stored as 32 bins of waveforms consisting of eight averages each; 1000 AGFs were constructed by randomly sampling 1 (8 averages) to 16 bins (128 averages) and determining the eCAP threshold by linear extrapolation. Precision of the eCAP threshold was expressed as the SD within the collection of thresholds. AGF, amplitude growth function; eCAP, evoked compound action potential.
eCAPs were recorded in a dynamic range from 0 μA to the maximum acceptable loudness (MAL) level. The MAL corresponded to level 8 on the loudness scale used by Potts et al. (2007). The dynamic range was divided in 10 linearly spaced current levels, starting at 0 μA as a measure of the background noise. eCAPs were recorded from three different electrode positions along the array: electrode contact 3 (apical), 9 (middle), and 15 (basal). When the compliance limit or the MAL of an adjacent electrode was more favorable, the AGF was measured on that electrode instead. Due to time limitations, only two electrodes were recorded in two subjects. In addition, due to compliance limitations, not all electrode locations could be tested in six subjects. As a result, from four subjects only two electrodes were recorded, and from two subjects only one contact was measured. From a 14th study subject no useful AGFs were obtained, and this person was therefore excluded from the study. This subject is not included in Table 1.
Signal Processing and Data Analysis
eCAP amplitudes were calculated as the difference between the first negative peak (N1) and first positive peak (P1) of the waveform (Fig. 4A). N1 was determined within a recording window of 0 to 450 µsec after stimulation, and P1 between 0 and 900 µsec. eCAP thresholds were determined by constructing AGFs using the 10 available current levels, followed by linear regression and extrapolation to zero-amplitude using a standard method of least squares (Fig. 4C, D). To this end, an experienced audiologist visually assessed the AGF, based on averaged waveforms using all 256 available waveforms. The audiologist marked which data points were to be excluded from the AGF, that is, amplitudes that were visually below the noise floor (Fig. 4D), or amplitudes that were clearly outside the linear part of the AGF (occurred rarely and not shown). When less than three points remained after this evaluation, the AGF was excluded from analysis. The best-estimate eCAP threshold was determined using eCAP amplitudes derived from the average of the full complement of 256 waveforms (that is, 32 bins, as shown in Fig. 4B, D).
Fig. 4.
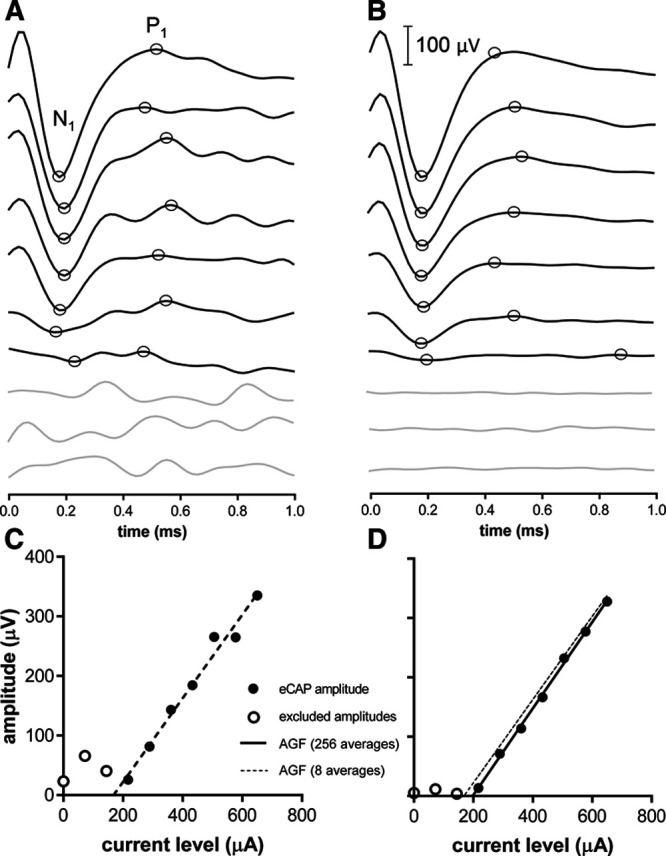
Sample AGFs with eight averages and 256 averages obtained using FM. More waveform averages result in decreased the noise floors, lower eCAP peak amplitudes, and thus higher extrapolated eCAP thresholds. AGF, amplitude growth function; eCAP, evoked compound action potential; FM, forward masking.
Background noise was defined by the SD of a trace obtained at a stimulus level of 0 μA, as if a regular eCAP recording was performed, including the artifact reduction paradigm. From this trace the leading and trailing five samples were discarded to eliminate any switching artifact. A linear fit was subtracted from the trace to reduce signal drift.
The variability in the eCAP threshold was determined using a MC approach by constructing probability distributions in a MATLAB R2016b programming environment (Natick, MA, USA) through randomized subsampling of the data (Fig. 3). To this end, eCAP waveforms were averaged using 8 (1 bin) up to 128 (16 bins) out of the 256 available recordings (32 bins). Figure 4A, B shows eCAPs as a function of current level at 8 averages (1 bin) and 256 averages (32 bins), respectively. The algorithm was controlled such that each of the 1000 regression analyses used a unique dataset by omitting duplicates. The precision of the eCAP threshold was expressed as the SD of the collection of 1000 threshold estimates (schematically shown in Fig. 5).
Fig. 5.
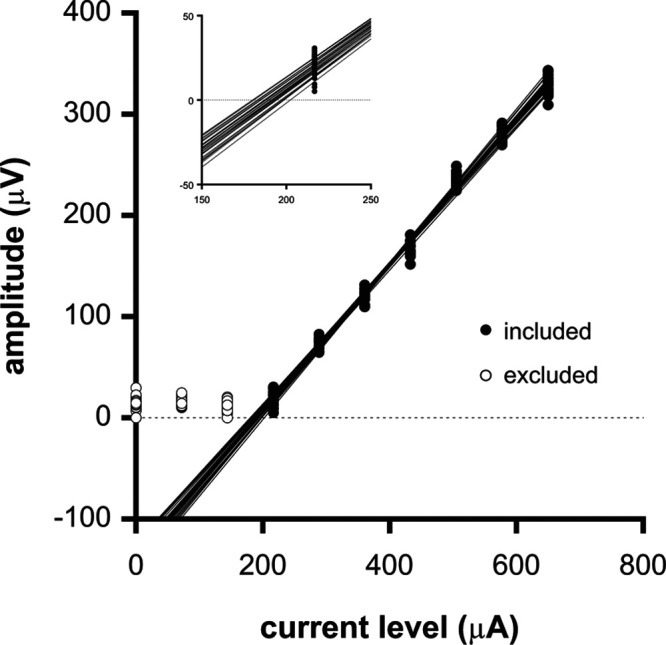
Sample data of a Monte Carlo simulation to determine the eCAP threshold variability when 1 bin (i.e., the average of 8 eCAP waveforms) was used per stimulus level to generate the AGF. AGFs were generated by randomly sampling a single bin (of the available 32) per current level. The first recording at 0 μA represents the noise floor. This recording as well as the subsequent two lowest current levels were excluded through visual inspection by an experienced audiologist and not taken into account in the regression analyses. Inset: fragment of the data shown in (A) on a larger scale showing the extrapolated eCAP thresholds to zero eCAP amplitude. For clarity, only a sample subset of 32 AGFs are shown. In reality, 1000 AGFs were generated to obtain 1000 threshold estimates. AGF, amplitude growth function; eCAP, evoked compound action potential.
Statistics
A linear mixed model (LMM) was constructed in SPSS 23 for Windows (IBM Corp. Armonk, NY), where SD was entered as the dependent variable and the artifact reduction paradigm as a fixed and main effect factor. The number of averages (8, 16, 32, 64, 128), artifact reduction paradigm, electrode number, slope of the AGF (at 256 averages), absolute eCAP threshold (at 256 averages), and the background noise were entered as fixed main effect covariates. Subject ID was included as a random-effects factor. For both the fixed effects and the random effect, an intercept was included in the model. Graphs were generated in GraphPad Prism 7.04 for Windows (GraphPad Software, La Jolla, California, USA).
RESULTS
After visual inspection of each AGF, and discarding those waveforms with amplitudes outside the linear region of the AGF, we obtained useful AGFs in a total of 31 electrodes. AGFs contained three intensity levels (n = 5 electrodes), 4 levels (n = 9), 5 levels (n = 6), 6 levels (n = 10), or 7 levels (n = 1). For the remaining 12 electrodes, <3 intensity levels were left and these AGFs were discarded. The remaining AGFs were used to calculate the variability of the eCAP threshold by running MC simulations. The resulting SDs at 8, 16, 32, 64, and 128 waveform averages were used as the dependent variable in the LMM. The number of averages was entered as the 2log value (3, 4, 5, 6, or 7). The LMM revealed that SD was significantly dependent on the artifact reduction paradigm, the number of waveform averages, electrode number, slope of the AGF, and the background noise level, but not significantly on the absolute eCAP threshold. The LMM is shown in Table 2 and can be captured in the following linear formula:
TABLE 2.
Linear mixed model
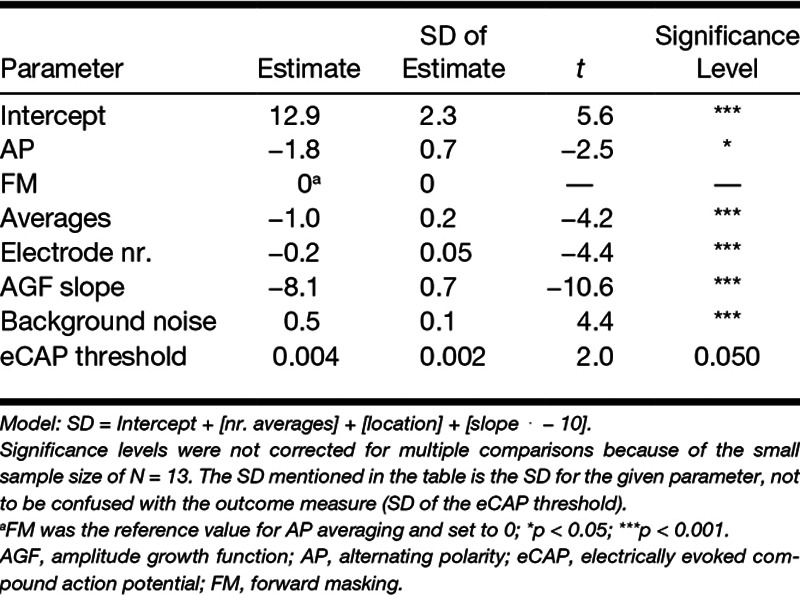
with b being the intercept, P the artifact reduction paradigm, n the log number of averages, el the electrode number, a the AGF slope, N the background noise, and thr the eCAP threshold. Suppose an eCAP threshold is found with AP averaging using 32 averages per waveform on electrode 9, the AGF has a slope of 0.6 μV/μA with a threshold of 400 μA, and the background noise level is 2.5 μV. The model then predicts an SD of 5.8 μA, following
In Figure 6, the SD of the eCAP threshold (obtained with AP averaging) is plotted as a function of the number of waveform averages in three cochlear locations. The SD decreased with increasing number of waveform averages, and varied slightly between cochlear locations. The median SD ranged from 3 to 6 μA at 8 averages (dependent on location) to 0.6 to 1.1 μA at 128 averages. The average improvement in SD when doubling the number of eCAP waveforms, as determined across all subjects and electrode locations, was 1.52. Representative sample data in numerical format are shown in Table 2.
Fig. 6.
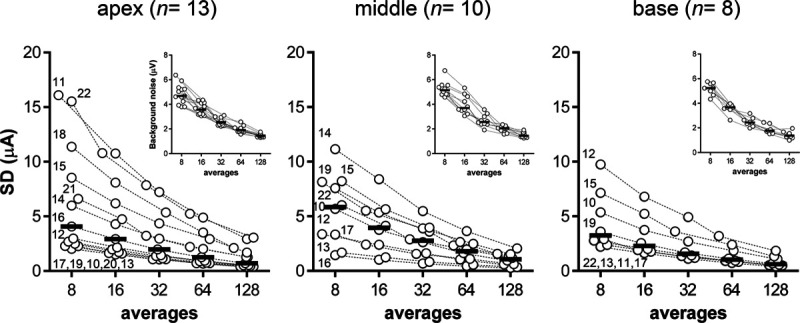
The precision (SD) of the eCAP threshold as a function of the number of waveform averages in three cochlear locations. Insets: background noise expressed as the SD in eCAP traces without electrical stimulation. eCAP, evoked compound action potential.
The insets in Figure 6 show the background noise levels measured at a stimulus level of 0 μA when using AP averaging. Ensemble averaging improved background noise levels from a median of 5 μV at 8 averages to 1 μV at 128 averages. Doubling the number of waveform averages reduced background noise levels with a factor 1.38 (averaged across all 13 subjects and 31 electrodes), close to the theoretical limit of improvement of √2 = 1.41.
In Figure 7, an overview of the SD of the eCAP threshold is provided for a subset of conditions to illustrate the effects of the other parameters that were investigated. The artifact reduction paradigm had a significant effect, as shown for a subset of data in Figure 7A (31 electrodes at 32 waveform averages). FM in this subset of data had a larger eCAP threshold variability (5.9 μA) than AP averaging (2.7 μA). In the full data set, the FM had an SD that was, on average, a factor of 2.33 times higher than AP averaging. The absolute eCAP thresholds determined at 256 waveform averages did not significantly differ between both paradigms (paired, 2-tailed t-test, t30 = 1.13, p = 0.267).
Fig. 7.
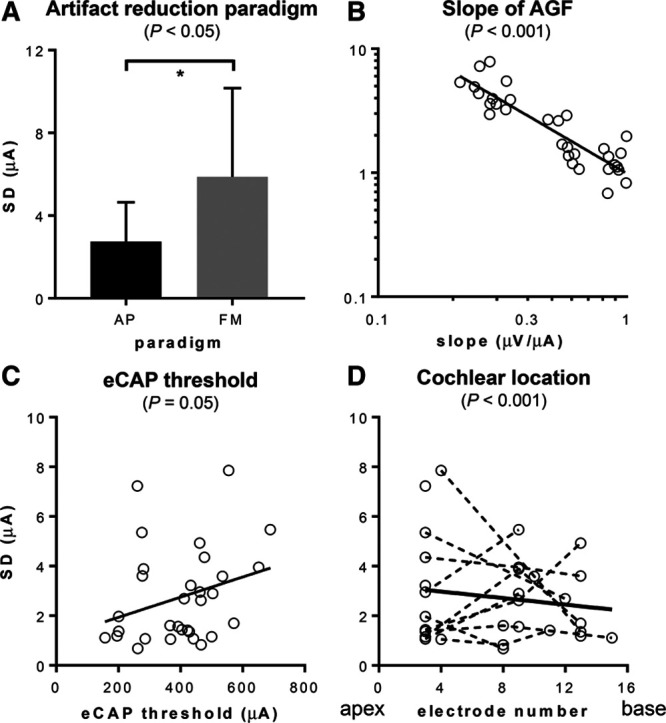
SD of the eCAP threshold in subsets of data (i.e., 32 averages and AP averaging). A, SD was significantly smaller with averaging of alternate polarities (AP) than forward masking (FM). B, SD was significantly negatively correlated with slope of the AGF. C, SDs showed a tendency to increase at higher thresholds (p = 0.05). D, SDs significantly decreased toward the base in this study. However, there was substantial intersubject variability. AGF, amplitude growth function; eCAP, evoked compound action potential.
In Figure 7B, the SD is plotted against the slope of the AGF on a double logarithmic scale. The data represent 31 electrode contacts across three cochlear locations, using 32 averages obtained with AP averaging. Linear regression in this subset of data showed a negative correlation between the SD and slope (r2 = 0.8), which was highly significant in the LMM (p < 0.001, Table 2). When correlating AGF slope (dependent variable) with electrode number as the covariate (and artifact reduction paradigm as additional main factor to increase the number of repeated measures) in a separate LMM, no significant relation was found (data not shown). In other words, we could not find a relation between slope and cochlear location in this subset of data. In this same data subset, the SD showed a weak-positive correlation with the eCAP threshold (Fig. 7C, r2 = 0.08), which approached significance in the LMM (p = 0.050, Table 2).
Figure 7D shows the SD as a function of electrode number at 32 averages obtained using AP averaging. A weak-negative correlation between SD and electrode number was found across 13 subjects in this subset of data (r2 = 0.02, thick line in Fig. 7D). Nonetheless, the LMM showed a highly significant negative correlation between the SD of the eCAP threshold and electrode number (p < 0.001, Table 2). The LMM was statistically more powerful than the linear regression shown in Figure 7D, because all the data were available in the LMM (5 averages, FM, AP averaging, etc.). The LMM effectively accounts for the remaining parameters, importantly, the slope and absolute eCAP threshold, thereby robustly isolating any effect of electrode number. Hence, in this relatively small study population, we show better precision of the eCAP threshold in the basal part of the cochlea using a LMM.
We initially included the impedance of the electrodes into the LMM as a fixed main covariate (data not shown). This proved to be an insignificant factor in the LMM (t = −0.9, p = 0.365). Therefore, we subsequently removed the impedance factor from the final model presented in Table 2.
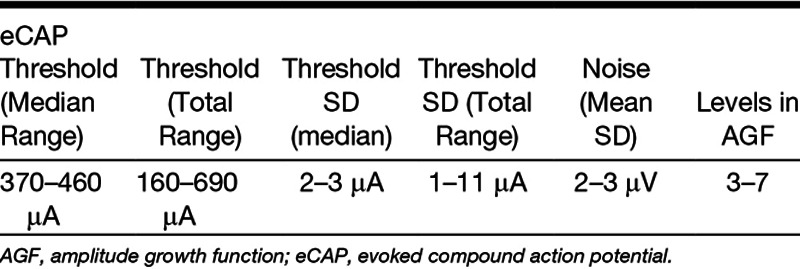
In Table 3, an overview is provided of estimated key parameters from the LMM analysis. Averages and medians (N = 13) are provided as ranges across all three cochlear locations and between 13 subjects, three cochlear locations and a total of 31 electrodes. eCAP thresholds were determined at 256 waveform averages. SDs of eCAP thresholds and background noise were determined at 32 averages. The number of stimulus levels in the AGF was determined by an experienced audiologist by excluding those points that were outside the linear area at 256 averages.
TABLE 3.
Representative data obtained using AP averaging
DISCUSSION
In this study, we have determined the variability (precision) of the eCAP threshold caused by background noise using a MC approach to simulate test/retest recordings in 13 Advanced Bionics CI users. Background noise in eCAP recordings in Advanced Bionics devices is reportedly stationary and normally distributed. Therefore, ensemble averaging theoretically reduces the noise in the eCAP with a factor of √n (Undurraga et al. 2012), where n is the number of waveform averages. Lower noise levels reduce the threshold variability caused by extrapolation of the AGF to zero (Fig. 8).
Fig. 8.
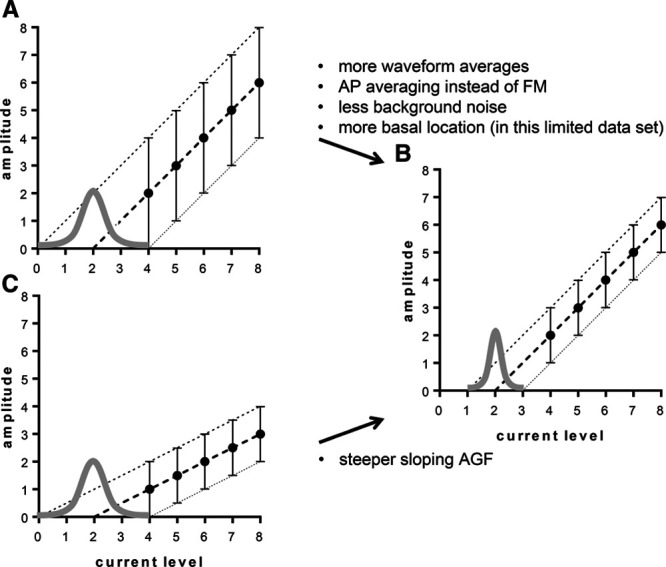
Graphical representations of the effects of the number of waveform averages (A, B), slope of the AGF (B, C), and number of current levels in the AGF (D, E) on the width (i.e., precision) of the (normal) distribution of the eCAP threshold. Error bars represent the range of eCAP amplitudes in the collection of 1000 random samples. Cochlear location also significantly affected S, which can be explained by different slopes of the AGF along the cochlea (B, C). AGF, amplitude growth function; eCAP, evoked compound action potential.
We have shown that doubling the number of waveforms reduces SD of the eCAP threshold by a factor of 1.52. This value is close to the factor at which the eCAP background noise was reduced (1.38) and close to the theoretical limit of the reduction in random noise after ensemble averaging (√2 = 1.41). In line with these findings, AP averaging resulted in 2.3 times lower SDs than FM, which approximates the theoretically √4 ⋅ √2 = 2.8 times better SDs with AP averaging over FM (see Introduction and Fig. 2).
At AB’s default of 32 averages, we found a median SD of 2 to 3 μA (Table 3). Biesheuvel et al. (2018) report 95% confidence intervals of the linearly extrapolated eCAP threshold of approximately −110 μA to +50 clinical units (dependent on cochlear location), equaling −260 to +120 μA. Using the data obtained in the base, our equivalent 95% confidence bounds are approximately ±3 μA, when using 95% confidence interval = ± t ⋅ (SD/√n), with SD = 3 μA, t = 2.53 at α = 0.05 and n − 1 = 6. The reported confidence bounds in Biesheuvel et al.’s study were asymmetric, because they represented the 95% confidence interval of the linearly extrapolated thresholds of the regression line of the AGF. The difference in the precision reported here and their results approaches two orders of a magnitude, and can be explained by differences in the outcome measure used to estimate the precision. While Biesheuvel et al. reported the 95% confidence bounds of the linearly extrapolated eCAP threshold regression fit, we have determined the test/retest variability. The confidence bands of a fitted curve not only take into account the random variability (i.e., the background noise) but also errors introduced by nonlinearities in the AGF and the uncertainty introduced by extrapolation of the curve. While the recorded part of AGF may appear to be linear, the underlying response curve is in fact a sigmoid (Abbas & Miller 2004; McKay & Smale 2017). In this study, nonlinearities will not have affected the SD, because the MC is unaffected by such systematic errors. In other words, our data solely provide an estimate of the precision of the eCAP threshold based on the test/retest variability, reflecting random errors invoked by background noise only. We conclude that the test/retest variability as reported here constitutes only a small fraction of the total variability present in an extrapolated eCAP threshold.
As the median SD of approximately 3 μA we report here at the default of 32 averages is relatively small, it may well be possible to decrease the number of averages without affecting the precision of the threshold in the median subject substantially. In a few isolated instances, there was a high variability in the eCAP threshold found over 15 μA (Fig. 6A). In clinical practice, it will be these cases that will benefit from an increased number of averages, especially when a reliable threshold is needed, for example, for fitting purposes, or when implant functionality is tracked over time using eCAPs. To implement this in clinical practice, the SD of the eCAP threshold needs to be monitored during recording to choose whether to include more waveforms. This process can be automated by recording and storing for example 8 waveforms per stimulus level (instead of the default of 32 in SoundWave) and subsequently use a MC simulation to determine the SD of the threshold. To save time and processing power, a low number of regressions could be done (e.g., 10 instead of 1000 as applied here). Then the number of additional averages needed, if any, can simply be calculated using the SD ⋅ √n factor as applied here, to reach a certain target SD (e.g., the median SD of 3 μA as reported here). This procedure can save time in case the precision is sufficient with <32 averages, and it can improve the threshold estimates in those subjects with high variability in their AGFs.
The LMM showed that the SD of the eCAP threshold decreases toward the base, and that the SD decreases when the slope of the AGF is steeper. Steeper sloping AGFs yield more robust estimates of extrapolated thresholds. By contrast, shallow slopes exacerbate any variation in the data points (Fig. 8). AGFs have been shown to be steeper in the apex than in the base (Brill et al. 2009; Van de Heyning et al. 2016; Biesheuvel et al. 2018) and therefore the eCAP threshold precision could be expected to be more favorable (lower SDs) in the apex than in the base. However, we report significant better precision toward the base. It is questionable whether this outcome will hold up in the population of CI users at large. The LMM had a relatively high statistical power, as it combined all the data (five averages, three electrodes, and two artifact reduction paradigms). Yet despite the many observations made per subject, the subject population was relatively small, which may have led to inflated Type I errors. We therefore cannot exclude that the better precision we found in the base was a false positive and not representative of the population of CI users at large. However, a p < 0.001 does make the observation quite convincing. Note that the weak correlation as apparent from Figure 7D can be explained by the fact that the figure only shows the relation between SD and electrode number, while the LMM corrects for the other factors and covariates in the model, notably the steepness of the AGF. It has been reported by others that eCAP amplitudes are larger in the apex than in the base (Brill et al. 2009; Biesheuvel et al. 2018). Given that background noise levels are not dependent on cochlear location in Advanced Bionics devices (Undurraga et al. 2012), apical eCAPs will expectedly have better signal-to-noise ratios and hence the eCAP thresholds will have lower SDs. As mentioned, we did not find better precision in the apex, and there was a trend toward SDs being larger when the eCAP threshold was higher. These unexpected findings may likewise be explained by the relatively small subject population. By contrast, our results on ensemble averaging and the effect of AP averaging versus FM on precision are sufficiently robust, as these effects are arithmetic in nature and did not differ much between subjects.
The assessment of the accuracy of the eCAP threshold was outside the scope of this article. Nonetheless, we wish to note that increasing the number of eCAP waveform averages also affects the accuracy, by shifting the AGF curve downwards (Fig. 4D). This is caused by the fact that the eCAP amplitude is typically assessed by taking the minimum (N1) and maximum (P1) of the eCAP waveform. Any added random noise increases the eCAP amplitude and hence noise systematically raises the AGF and thus lowers the threshold.
Limitations of this study include the relatively small sample size of 13 subjects. Because of this, we did not correct the p values in the LMM output for multiple comparisons posthoc testing (Table 2). A conservative Bonferroni correction would yield α = 0.05/(7 − 1) = 0.008. Hence, except for the artifact reduction paradigm, all the significant variables would still be significant after correction, as their p values were <0.001. With a total of 31 electrodes tested, we deem it a representative sample that allowed for sufficient statistical power to investigate the effects of ensemble averaging on the precision of the eCAP threshold. The number of electrodes yielding an AGF with at least three intensity levels in the linear part of the AGF with above-threshold eCAP waveforms was limited (31 out of 39). This was caused in part by the method of recording, where the 10 intensity levels were automatically selected by dividing the dynamic range (0 μA to MAL) in nine linear steps. Restricting the dynamic range, for example from visual eCAP threshold to MAL, would have yielded additional AGFs, and hence additional electrodes and more uniform AGFs. The fact that we selected subjects with relatively good speech understanding may have influenced the results, as speech understanding has been linked to steeper slopes of the AGF, which in turn may produce smaller SDs (Brown et al. 1999; Kim et al. 2010).
Our data pertain to Advanced Bionics devices only, as other CI devices from other manufacturers have different noise floors and use different (default) settings for eCAP threshold measurements. For instance, the system gain may be different and the digital filter may have different cut-off frequencies, both of which affect the signal-to-noise ratio and hence the precision of the eCAP threshold. Further, they may deploy methods other than linear regression to zero-amplitude to estimate the eCAP threshold, notably the method of the last visible waveform. Since the clinical fitting software of Advanced Bionics (SoundWave) deploys a linear extrapolation to zero amplitude, this seemed the most appropriate method of analyzing the precision of the eCAP threshold in this population of CI users. It is an accepted method for threshold determination, provided that data points outside the linear part of the AGF are excluded (Hughes 2010; Biesheuvel et al. 2018). This has been the first study that assessed the test/retest variability in Advanced Bionics implants. Because the precision is such an important determinant of the reliability of the eCAP threshold, it will be of interest to assess the precision in other devices from other manufacturers as well.
CONCLUSION
We have shown that test/retest variability in the eCAP threshold is negligible compared with the total variability introduced by linearly extrapolating the AGF. At the default number of averages (32), the median SD was approximately 2 to 3 μA when AP averaging was used to reduce the stimulus artifact. Some individuals, however, may have substantially higher eCAP threshold variability (over 15 μA in our data set), and in these cases the threshold precision does benefit substantially from additional averaging. In many subjects, however, eight averages may in fact be more than sufficient in terms of the test/retest variability. Automated SD analyses applied on-the-fly can support informed decisions whether to continue with sampling more eCAP traces, which can save time in low-noise recordings, and improve precision in case of noisy signals. From a precision perspective, AP averaging is preferable over FM as it has better precision, while fewer recordings are needed, making it the more time-efficient method of the two.
ACKNOWLEDGMENTS
The authors thank the subjects for their time and dedication.
Footnotes
This study was supported by the Dutch Technology Foundation STW and Advanced Bionics, LLC, Valencia (CA).
H. C. S. analyzed the data and wrote the draft and revised the article. J. D. B developed software, analyzed the data, and critically revised the first draft. J. J. d. V. was responsible for the ethical approval, designing the experiments, and collecting data. M. S. B. collected and analyzed the data. J. J. B. designed experiments, assisted in data analysis, critically revised the first drafts and revised the article. J. H. M. F. designed experiments, critically revised the first drafts, and revised the article.
The authors have no conflicts of interest to disclose.
REFERENCES
- Abbas J. P., Miller C. A. Zeng F.-G., Fay R. R. Biophysics and physiology. In Cochlear Implants: Auditory Prostheses and Electric Hearing. 2004). New York: Springer-Verlag. [Google Scholar]
- Baudhuin J. L., Hughes M. L., Goehring J. L. A comparison of alternating polarity and forward masking artifact-reduction methods to resolve the electrically evoked compound action potential. Ear Hear, (2016). 37, e247–e255. [DOI] [PMC free article] [PubMed] [Google Scholar]
- Biesheuvel J. D., Briaire J. J., Frijns J. H. M. The precision of eCAP thresholds derived from amplitude growth functions. Ear Hear, (2018). 39, 701–711. [DOI] [PubMed] [Google Scholar]
- Botros A., Psarros C. Neural response telemetry reconsidered: I. The relevance of ECAP threshold profiles and scaled profiles to cochlear implant fitting. Ear Hear, (2010). 31, 367–379. [DOI] [PubMed] [Google Scholar]
- Brill S., Müller J., Hagen R., et al. Site of cochlear stimulation and its effect on electrically evoked compound action potentials using the MED-EL standard electrode array. Biomed Eng Online, (2009). 8, 40. [DOI] [PMC free article] [PubMed] [Google Scholar]
- Brown C. J., Abbas P. J., Hughes M. L., et al. Cross-electrode differences in EAP growth and recovery functions measured using the Nucleus NRT software: Correlation with speech performance. 1999). In Conference on Implantable Auditory Prostheses Ailoma, CA. [Google Scholar]
- Brown C. J., Hughes M. L., Luk B., et al. The relationship between EAP and EABR thresholds and levels used to program the nucleus 24 speech processor: Data from adults. Ear Hear, (2000). 21, 151–163. [DOI] [PubMed] [Google Scholar]
- Carlson R. V., Boyd K. M., Webb D. J. The revision of the declaration of helsinki: Past, present and future. Br J Clin Pharmacol, (2004). 57, 695–713. [DOI] [PMC free article] [PubMed] [Google Scholar]
- Franck K. H., Norton S. J. Estimation of psychophysical levels using the electrically evoked compound action potential measured with the neural response telemetry capabilities of Cochlear Corporation’s CI24M device. Ear Hear, (2001). 22, 289–299. [DOI] [PubMed] [Google Scholar]
- Frijns J. H., Briaire J. J., de Laat J. A., et al. Initial evaluation of the Clarion CII cochlear implant: Speech perception and neural response imaging. Ear Hear, (2002). 23, 184–197. [DOI] [PubMed] [Google Scholar]
- Glassman E. K., Hughes M. L. Determining electrically evoked compound action potential thresholds: A comparison of computer versus human analysis methods. Ear Hear, (2013). 34, 96–109. [DOI] [PMC free article] [PubMed] [Google Scholar]
- Hey M., Müller-Deile J. Accuracy of measurement in electrically evoked compound action potentials. J Neurosci Methods, (2015). 239, 214–222. [DOI] [PubMed] [Google Scholar]
- Hughes L. M. Fundamentals of Clinical ECAP Measures in Cochlear Implants: Part 1: Use of the ECAP in Speech Processor Programming (2nd Ed.). Audiology Online [2010). serial online]. Retrieved February 9, 2018. [Google Scholar]
- Hughes L. M. Zwolan T., Wolfe J. Electrically evoked compound action potential. In Objective Measures in Cochlear Implants (pp. 2013). San Diego: Plural Publishing, Inc; 101–121). [Google Scholar]
- Hughes L. M., Brown J. C., Abbas J. P., et al. Comparison of EAP thresholds with MAP levels in the Nucleus 24 Cochlear Implant: Data from children. Ear and hearing, (2000). 21, 164–174. [DOI] [PubMed] [Google Scholar]
- Jeon E. K., Brown C. J., Etler C. P., et al. Comparison of electrically evoked compound action potential thresholds and loudness estimates for the stimuli used to program the Advanced Bionics cochlear implant. J Am Acad Audiol, (2010). 21, 16–27. [DOI] [PMC free article] [PubMed] [Google Scholar]
- Joly C. A., Péan V., Hermann R., et al. Using electrically-evoked compound action potentials to estimate perceptive levels in experienced adult cochlear implant users. Otol Neurotol, (2017). 38, 1278–1289. [DOI] [PubMed] [Google Scholar]
- Kim J. R., Abbas P. J., Brown C. J., et al. The relationship between electrically evoked compound action potential and speech perception: A study in cochlear implant users with short electrode array. Otol Neurotol, (2010). 31, 1041–1048. [DOI] [PMC free article] [PubMed] [Google Scholar]
- Klop W. M., Hartlooper A., Briare J. J., et al. A new method for dealing with the stimulus artefact in electrically evoked compound action potential measurements. Acta Otolaryngol, (2004). 124, 137–143. [DOI] [PubMed] [Google Scholar]
- Lai W. K., Dillier N. A simple two-component model of the electrically evoked compound action potential in the human cochlea. Audiol Neurootol, (2000). 5, 333–345. [DOI] [PubMed] [Google Scholar]
- McKay C. M., Smale N. The relation between ECAP measurements and the effect of rate on behavioral thresholds in cochlear implant users. Hear Res, (2017). 346, 62–70. [DOI] [PubMed] [Google Scholar]
- Miller C. A., Abbas P. J., Brown C. J. An improved method of reducing stimulus artifact in the electrically evoked whole-nerve potential. Ear Hear, (2000). 21, 280–290. [DOI] [PubMed] [Google Scholar]
- Miller C. A., Brown C. J., Abbas P. J., et al. The clinical application of potentials evoked from the peripheral auditory system. Hear Res, (2008). 242, 184–197. [DOI] [PubMed] [Google Scholar]
- Potts L. G., Skinner M. W., Litovsky R. A., et al. Recognition and localization of speech by adult cochlear implant recipients wearing a digital hearing aid in the nonimplanted ear (bimodal hearing). J Am Acad Audiol, (2009). 20, 353–373. [DOI] [PMC free article] [PubMed] [Google Scholar]
- Thai-Van H., Truy E., Charasse B., et al. Modeling the relationship between psychophysical perception and electrically evoked compound action potential threshold in young cochlear implant recipients: Clinical implications for implant fitting. Clin Neurophysiol, (2004). 115, 2811–2824. [DOI] [PubMed] [Google Scholar]
- Undurraga J. A., Carlyon R. P., Wouters J., et al. Evaluating the noise in electrically evoked compound action potential measurements in cochlear implants. IEEE Trans Biomed Eng, (2012). 59, 1912–1923. [DOI] [PubMed] [Google Scholar]
- Van de Heyning P., Arauz S. L., Atlas M., et al. Electrically evoked compound action potentials are different depending on the site of cochlear stimulation. Cochlear Implants International, (2016). 17, 251–262. [DOI] [PubMed] [Google Scholar]
- Van der Jagt M. A., Briaire J. J., Verbist B. M., et al. Comparison of the HiFocus Mid-Scala and HiFocus 1J Electrode Array: Angular insertion depths and speech perception outcomes. Audiol Neurootol, (2016). 21, 316–325. [DOI] [PubMed] [Google Scholar]
- Zar J. H. Biostatistical Analysis (1999). 4th Ed). New Jersey: Prentice-Hall, Inc. [Google Scholar]
REFERENCE NOTES
- Hey M., Begall K. Fehlerbetrachtungen bei ECAP-Messungen. Jahrestagung der Deutschen Gesellschaft für Audiologie 2009).


