Abstract
PURPOSE
Lymphovascular invasion (LVI) and perineural invasion (PNI) are associated with poor prognosis in gastric cancers. In this work, we aimed to investigate the potential role of computed tomography (CT) texture analysis in predicting LVI and PNI in patients with tubular gastric adenocarcinoma (GAC) using a machine learning (ML) approach.
METHODS
Sixty-eight patients who underwent total gastrectomy with curative (R0) resection and D2-lymphadenectomy were included in this retrospective study. Texture features were extracted from the portal venous phase CT images. Dimension reduction was first done with a reproducibility analysis by two radiologists. Then, a feature selection algorithm was used to further reduce the high-dimensionality of the radiomic data. Training and test splits were created with 100 random samplings. ML-based classifications were done using adaptive boosting, k-nearest neighbors, Naive Bayes, neural network, random forest, stochastic gradient descent, support vector machine, and decision tree. Predictive performance of the ML algorithms was mainly evaluated using the mean area under the curve (AUC) metric.
RESULTS
Among 271 texture features, 150 features had excellent reproducibility, which were included in the further feature selection process. Dimension reduction steps yielded five texture features for LVI and five for PNI. Considering all eight ML algorithms, mean AUC and accuracy ranges for predicting LVI were 0.777–0.894 and 76%–81.5%, respectively. For predicting PNI, mean AUC and accuracy ranges were 0.482–0.754 and 54%–68.2%, respectively. The best performances for predicting LVI and PNI were achieved with the random forest and Naive Bayes algorithms, respectively.
CONCLUSION
ML-based CT texture analysis has a potential for predicting LVI and PNI of the tubular GACs. Overall, the method was more successful in predicting LVI than PNI.
Gastric cancer is the fifth most frequently diagnosed cancer type and the third leading cause of cancer-related death worldwide (1). In the WHO classification, the most common type of gastric cancer is tubular gastric adenocarcinoma (GAC). To ensure appropriate and timely treatment, it is of significant importance to correctly identify tumor aggressiveness as well as the cancer stage, particularly in the preoperative period.
The most important feature of malignant cells is their ability to produce metastatic deposits in remote areas. Vascular structures, lymphatic ducts, and nerves are metastatic invasion pathways for lymphovascular invasion (LVI) and perineural invasion (PNI). These pathways are well defined in the literature and have been the focus of a great deal of research in tumor biology (2–7). The presence of the LVI and PNI, separately or concurrently, has a significant impact on patient prognosis and associated with decreased survival, which may help oncologists identify the risk of distant metastasis of the primary tumor and local recurrence (3–7). Both the LVI and PNI are also independent prognostic factors for node-negative cancer patients (4). In addition, many studies suggested that LVI is associated with lymph node metastasis (8). Identification of these features may facilitate achieving higher accuracy in disease staging and, ultimately, change the strategy regarding the use of adjuvant therapy for high-risk patients (8–10).
Recently, texture analysis as a radiomic approach has been widely used for noninvasive quantitative evaluation of the wide variety of neoplasms (11). This method simply extracts high-dimensional pixel or voxel data from medical images that would go unnoticed by the naked eye, which may be associated with, for instance, aggressiveness, treatment resistance, histopathologic, genomic or proteomic characteristics of the lesions (12, 13).
Interestingly, there has been no previous work regarding the prediction of LVI and PNI in GAC using computed tomography (CT) texture analysis along with artificial intelligence. In this work, we focused on the most common histopathologic type of GAC, that is tubular, and investigated the potential role of CT texture analysis in predicting LVI and PNI using a machine learning (ML) approach with various state-of-the-art algorithms.
Methods
Study design
The institutional review board of our hospital approved this retrospective study and waived the requirement for informed consent (Approval no: 1976). A total of 468 patients who underwent gastrectomy for GAC were collected from our archive, covering the period between January 2014 and April 2019.
Our inclusion criteria were as follows: (i), histologically confirmed tubular GAC and mixed GAC with ≥80% tubular component; (ii), surgically proven Siewert type II and III esophagogastric junction or gastric cancers; (iii), patients who underwent total gastrectomy with curative (R0) resection and D2-lymphadenectomy; and (iv), patients who had undergone preoperative contrast-enhanced CT (obtained during portal phase with 60 seconds of delay) in our hospital. The exclusion criteria were as follows: (i), patients who preoperatively received adjuvant or neoadjuvant chemotherapy due to clinical stage, locally advanced or metastatic disease; (ii) patients with poor tumor visualization due to early-stage or positive oral contrast medium; (iii) patients with no preoperative gastroscopy or operation in our hospital; and (iv) patients with previous distal gastrectomy in preoperative period. After applying the inclusion and exclusion criteria, 68 patients were included in this study.
All of the imaging data used in this work had also been used in another study. The other study included 114 patients with locally advanced gastric carcinoma and dealt with the texture analysis for prediction of clinical T and N stage and tumor grade before neoadjuvant treatment.
CT technique
CT was performed using two different scanners as follows: (i), a 64-detector CT scanner (Aquilion, Canon Medical Systems Corporation) and (ii), a 128-detector CT scanner (Ingenuity, Philips). Our contrast-enhanced CT acquisition parameters for patients with gastric cancer are as follows: (i), tube voltage, 120 kVp; (ii), tube current, 100–500 mAs; (iii), slice thickness, 2–3 mm; (iv), pitch, 0.797–1.5; (v), field of view, 50×50 cm2; (vi), rotation time, 0.50–0.75 s; (vii), matrix, 512×512; and (viii), reconstruction interval, 0.4 mm and 0.5 mm for 128-detector and 64-detector CT scanners, respectively; and (ix), delay, 60 s after aortic enhancement of 100 HU.
Optimal distension of the stomach was achieved using endoluminal contrast agents (500–1000 mL of water or a mixture of 500–1000 mL of water and oral contrast immediately before the CT scan). Following a non-contrast scan, all patients received a non-ionic intravenous contrast medium according to their weight (Iopromide, 1 mL/kg) with a power injector.
Preprocessing of CT images
All contrast-enhanced CT images were reconstructed to achieve the same slice thickness of 2.5 mm on the CT workstation. Pixel spaces were rescaled and equalized to an in-plane resolution of 1×1 mm2. All CT images were normalized by the ±3σ technique (14). To minimize the effects of differences between the devices, image normalization and gray-level discretization were performed to achieve 64 discrete levels (14,15).
Technical study pipeline
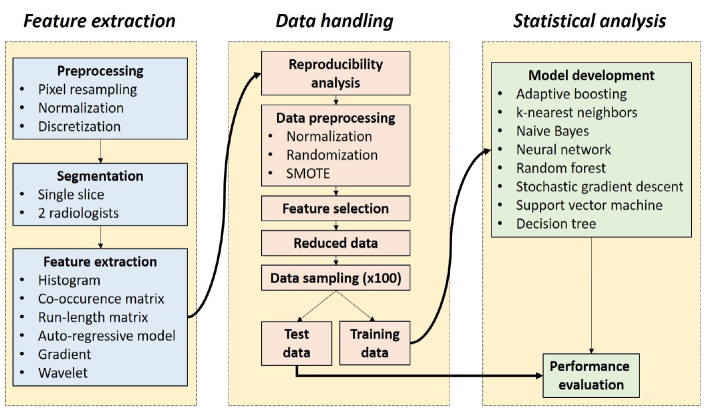
Our technical study pipeline included three key steps as follows: (i), feature extraction; (ii), radiomic data handling; and (iii), statistical analysis. The technical study pipeline is presented in Fig. 1.
Figure 1.
Technical study pipeline. SMOTE, synthetic minority oversampling technique.
Feature extraction
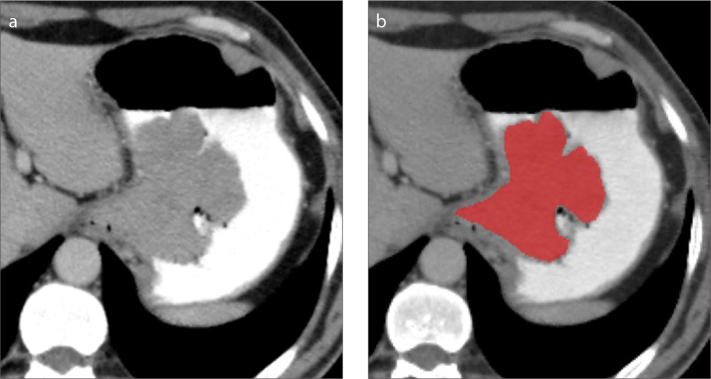
Texture feature extraction was performed with MaZda software program (version 4.6, P. M. Szczypiński, Institute of Electronics, Technical University of Lodz) (15). Portal venous phase CT images were used for feature extraction. Manual segmentation was done using a single axial image including the highest diameter of the gastric tumor (Fig. 2). Then, the contour of the region of interest was shrunk approximately one erosion to avoid the possible inclusion of perigastric and intragastric areas.
Figure 2. a, b.
Segmentation technique. Using a single axial slice of the portal venous phase CT (a), tumor segmentation (b) is done manually along the whole and the largest outer margin of gastric adenocarcinoma. The contour of the segmentation was shrunk to avoid the possible inclusion of perigastric and intragastric areas.
In total, 271 texture features were extracted per tumor. MaZda software program uses three feature calculation approaches (statistical, model-based, and transformation-based), creating a set of variables as follows: (i), 9 histogram-based features; (ii), 5 gradient features; (iii), 20 run-length matrix (RLM) features; (iv), 220 gray-level co-occurrence matrix (GLCM) features; (v), 5 autoregressive model features; and (vi), 12 Haar wavelet features (15–18). These features are described on the website of the software in detail (http://www.eletel.p.lodz.pl/programy/maZda/index.php).
Data handling
Feature values were normalized to achieve a common scale between 0 and 1. Before randomized data sampling, the order of the data set was randomized with 100% shuffling based on the metadata related to patient identifiers.
Dimension reduction was done with two consecutive approaches as follows: reproducibility analysis and algorithm-based feature selection.
For the reproducibility analysis, two radiologists with 12 and 8 years of experience in abdominal imaging independently segmented 20 randomly selected tumors. Segmentations were performed on the same image slice determined by the radiologist with 12 years of experience. Both radiologists were blinded to the pathology results. Intraclass correlation coefficients (ICCs) were calculated for each texture feature using SPSS version 20.0 (IBM Corp). The ICC values were calculated considering the two-way model, single rating, and absolute agreement. Only the features with ICC≥0.8 indicating excellent reproducibility were included in the following dimension reduction step.
Usually, only a limited number of features carry relevant information needed for textural discrimination. Many methods are available, allowing the selection of these features. In the present study, the features were selected using the fast correlation-based filter algorithm (19). This filter is an entropy-based algorithm and identifies relevant features as well as redundancy among relevant features without pairwise correlation analysis. In this method, feature selection is independent of the ML algorithm.
Because our data had an imbalance between classes for both targets, we also used the synthetic minority oversampling technique (SMOTE), which creates synthetic instances that are not exact replications (20). Hence, the method increases the representation of the minority group, while preserving the structure of the actual data. The SMOTE was utilized with the help of Waikato Environment for Knowledge Analysis software program (version 3.8.2; The University of Waikato, Hamilton, New Zealand).
The radiomic data were randomly sampled to create training and unseen test data set splits with fixed proportions of 66% and 33%, respectively. This procedure was automatically performed 100 times. Training data sets were used in creating ML model development. On the other hand, the test data sets, which were unseen by ML algorithms, were used for validation of the models.
Reference standard
The reference standards for the classifications were the presence and absence of the LVI and PNI in tubular GACs. Surgical resection was performed according to the Japanese Gastric Cancer Association guidelines (21). All surgical specimens were evaluated by two dedicated pathologists with 5 and 15 years of experience in the field. Histopathological tumor type was evaluated according to 2010 WHO classification (22). The LVI and PNI were assessed based on the eighth edition of the American Joint Committee on Cancer (AJCC).
Statistical analysis
ML-based classifications were performed using Orange data mining software (version 3.21). Eight ML algorithms were used as follows: (i), adaptive boosting; (ii), k-nearest neighbors; (iii), Naive Bayes; (iv), artificial neural network; (v), random forest; (vi), stochastic gradient descent; (vii), support vector machine; and (viii), decision tree. Details about ML algorithm parameters are presented in Table 1. To avoid sampling bias and overly optimistic results, all ML models were created using 100 different training datasets and then tested on the remaining unseen test datasets. Predictive performance of the ML models on unseen test data sets was evaluated and compared with average area under the curve (AUC) values of 100 samplings. In addition, accuracy, sensitivity, specificity, positive predictive value, and negative predictive values were calculated from the confusion matrices for further assessment.
Table 1.
Parameter settings of machine learning algorithms used in this study
| Machine learning algorithms/Parameters | Parameter value |
|---|---|
| k-Nearest Neighbors | |
| Number of neighbors | 5 |
| Metric | Euclidean |
| Weight | Uniform |
|
| |
| Decision Tree | |
| Minimum number of instances in leaves | 2 |
| Minimum limit for split | 5 |
| Limit for maximum depth | 100 |
|
| |
| Support Vector Machine | |
| Kernel | Linear |
| Iteration limit | 100 |
|
| |
| Stochastic Gradient Descent | |
| Base classifier | Linear SVM |
| Loss function | Hinge |
| Regularization | Lasso (L1) |
|
| |
| Random Forest | |
| Number of trees | 10 |
| Minimum limit for split | 5 |
|
| |
| Neural Network | |
| Neurons in hidden layers | 100 |
| Activation | Logistic |
| Solver | Adam |
| Maximum number of iterations | 200 |
|
| |
| Naive Bayes | |
| Prior probability estimation | Relative frequency |
|
| |
| Adaptive Boosting | |
| Base estimator | Tree |
| Number of estimators | 50 |
| Classification algorithm | SAMME.R |
| Regression loss function | Linear |
SVM, support vector machine; Lasso, least absolute shrinkage and selection operator; SAMME.R, the algorithm uses the probability estimates to update the model.
Results
Sixty-eight patients were eligible for our study. Of those, 51 patients were positive for LVI and 39 were positive for PNI. Patient demographic characteristics are shown in Table 2.
Table 2.
Baseline characteristics of 68 study patients
| Characteristics | Value |
|---|---|
| Age (years), mean±SD | 62.3±10.5 |
|
| |
| Sex, n (%) | |
| Female | 16 (23.5) |
| Male | 52 (76.5) |
|
| |
| Tumor size (cm), mean±SD | 5.6±2.9 |
|
| |
| Grade, n (%) | |
| 1 | 14 (20.6) |
| 2 | 41 (60.3) |
| 3 | 13 (19.1) |
|
| |
| Perineural invasion, n (%) | |
| Positive | 39 (57.4) |
| Negative | 29 (42.6) |
|
| |
| Lymphovascular invasion, n (%) | |
| Positive | 51 (75) |
| Negative | 17 (25) |
SD, standard deviation.
Overall, 150 of 271 texture features showed excellent reproducibility (ICC≥0.8) based on the analysis of two radiologists’ independent segmentation data. Therefore, these features were included in the following dimension reduction step.
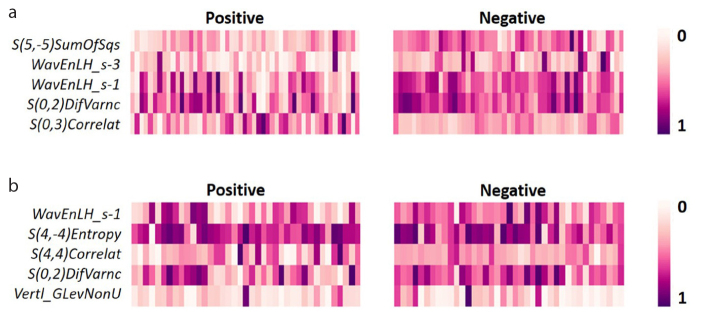
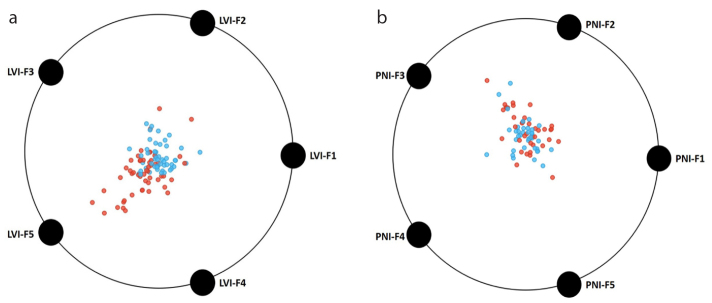
Using the fast correlation-based filter, the number of features decreased to five for both PNI and LVI, which were used in ML model development. Details about these features are given in Table 3. For LVI and PNI, two features and one feature were based on the transformed images, respectively. For both targets, the other texture features were extracted from the original images. Dominant feature class for each target was GLCM. The distribution of the normalized texture feature values with SMOTE are shown in a heat map in Fig. 3. Two-dimensional projections of the individual tumors based on selected features are given in Fig. 4.
Table 3.
Selected texture features by the fast correlation-based filter
| Feature codes | Selected features | ICC |
|---|---|---|
| LVI-F1 | S(5,−5)SumOfSqs | 0.810 |
| LVI-F2 | WavEnLH_s-3 | 0.861 |
| LVI-F3 | WavEnLH_s-1 | 0.815 |
| LVI-F4 | S(0,2)DifVarnc | 0.815 |
| LVI-F5 | S(0,3)Correlat | 0.834 |
| PNI-F1 | WavEnLH_s-1 | 0.815 |
| PNI-F2 | S(4,−4)Entropy | 0.964 |
| PNI-F3 | S(4,4)Correlat | 0.849 |
| PNI-F4 | S(0,2)DifVarnc | 0.815 |
| PNI-F5 | Vertl_GLevNonU | 0.963 |
LVI, lymphovascular invasion; PNI, perineural invasion; ICC, intraclass correlation coefficient.
Figure 3. a, b.
The heat map shows the distribution of normalized texture feature values selected for lymphovascular (a) and perineural (b) invasion status.
Figure 4. a, b.
Distribution of the selected texture features in two-dimensional space considering the classes, that is, the presence and absence of the lymphovascular (a) and perineural (b) invasion. Please refer to Table 3 for actual feature names.
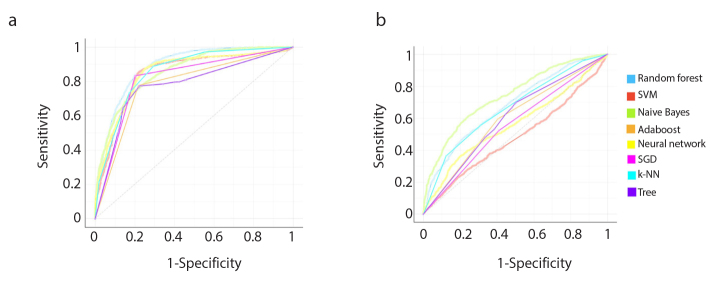
Considering all eight ML algorithms, mean AUC and accuracy ranges for predicting LVI were 0.777–0.894 and 76%–81.5%, respectively. The best performance was achieved by the random forest with mean AUC and accuracy of 0.894 and 80.9%, respectively.
With the same eight ML algorithms, mean AUC and accuracy ranges for predicting PNI were 0.482–0.754 and 54%–68.2%, respectively. The best performance was achieved by the Naive Bayes with a mean AUC of 0.754 and accuracy of 68.2%.
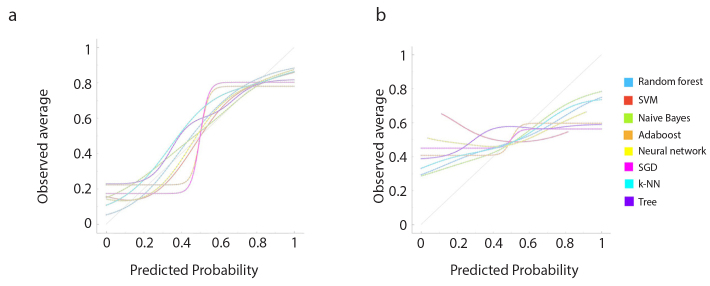
Performance of all ML classifiers for predicting LVI and PNI status are summarized in Table 4 and Table 5, respectively. Receiver operating characteristic (ROC) curves for predicting both targets are shown in Fig. 5. Calibration plots of the ML algorithms are given in Fig. 6.
Table 4.
Performance of machine learning algorithms in predicting lymphovascular invasion
| ML algorithms | AUC | Accuracy (%) | Sensitivity (%) | Specificity (%) | PPV (%) | NPV (%) | Predictions | Reference standard | |
|---|---|---|---|---|---|---|---|---|---|
|
| |||||||||
| Negative | Positive | ||||||||
| k-NN | 0.859 | 78.0 | 73.3 | 82.7 | 81.0 | 75.6 | 468 | 1283 | P |
| 82.7 | 73.3 | 75.6 | 81.0 | 1447 | 302 | N | |||
|
| |||||||||
| Decision Tree | 0.777 | 76.0 | 68.5 | 83.5 | 80.6 | 72.6 | 552 | 1199 | P |
| 83.5 | 68.5 | 72.6 | 80.6 | 1460 | 289 | N | |||
|
| |||||||||
| SVM | 0.858 | 81.5 | 83.4 | 79.5 | 80.3 | 82.7 | 291 | 1460 | P |
| 79.5 | 83.4 | 82.7 | 80.3 | 1391 | 358 | N | |||
|
| |||||||||
| SGD | 0.815 | 81.5 | 83.3 | 79.7 | 80.4 | 82.6 | 293 | 1458 | P |
| 79.7 | 83.3 | 82.6 | 80.4 | 1394 | 355 | N | |||
|
| |||||||||
| Random Forest | 0.894 | 80.9 | 80.2 | 81.6 | 81.3 | 80.4 | 347 | 1404 | P |
| 81.6 | 80.2 | 80.4 | 81.3 | 1427 | 322 | N | |||
|
| |||||||||
| Neural Network | 0.857 | 79.3 | 79.0 | 79.6 | 79.5 | 79.1 | 368 | 1383 | P |
| 79.6 | 79.0 | 79.1 | 79.5 | 1392 | 357 | N | |||
|
| |||||||||
| Naive Bayes | 0.868 | 76.8 | 73.3 | 80.3 | 78.9 | 75.0 | 468 | 1283 | P |
| 80.3 | 73.3 | 75.0 | 78.9 | 1405 | 344 | N | |||
|
| |||||||||
| Adaptive Boosting | 0.779 | 77.9 | 77.6 | 78.2 | 78.1 | 77.7 | 392 | 1359 | P |
| 78.2 | 77.6 | 77.7 | 78.1 | 1368 | 381 | N | |||
Values in the first and second rows were calculated for positive (P) and negative (N) target classes, respectively.
ML, machine learning; k-NN, k-nearest neighbors; SVM, support vector machine; SGD, stochastic gradient descent; AUC, area under the curve; PPV, positive predictive value; NPV, negative predictive value; N, negative; P, positive.
Table 5.
Performance of machine learning algorithms in predicting perineural invasion
| ML algorithms | AUC | Accuracy (%) | Sensitivity (%) | Specificity (%) | PPV (%) | NPV (%) | Predictions | Reference standard | |
|---|---|---|---|---|---|---|---|---|---|
|
| |||||||||
| Negative | Positive | ||||||||
| k-NN | 0.667 | 62.2 | 55.4 | 69.1 | 64.4 | 60.5 | 606 | 752 | P |
| 69.1 | 55.4 | 60.5 | 64.4 | 927 | 415 | N | |||
|
| |||||||||
| Decision Tree | 0.599 | 57.2 | 53.0 | 61.5 | 58.2 | 56.4 | 638 | 720 | P |
| 61.5 | 53.0 | 56.4 | 58.2 | 825 | 517 | N | |||
|
| |||||||||
| SVM | 0.482 | 54.6 | 51.2 | 58.1 | 55.3 | 54.1 | 663 | 695 | P |
| 58.1 | 51.2 | 54.1 | 55.3 | 780 | 562 | N | |||
|
| |||||||||
| SGD | 0.557 | 55.6 | 52.2 | 59.0 | 56.3 | 55.0 | 649 | 709 | P |
| 59.0 | 52.2 | 55.0 | 56.3 | 792 | 550 | N | |||
|
| |||||||||
| Random Forest | 0.687 | 61.7 | 59.6 | 63.9 | 62.6 | 61.0 | 548 | 810 | P |
| 63.9 | 59.6 | 61.0 | 62.6 | 857 | 485 | N | |||
|
| |||||||||
| Neural Network | 0.570 | 54.0 | 52.9 | 55.1 | 54.4 | 53.6 | 640 | 718 | P |
| 55.1 | 52.9 | 53.6 | 54.4 | 740 | 602 | N | |||
|
| |||||||||
| Naive Bayes | 0.754 | 68.2 | 61.6 | 74.9 | 71.3 | 65.8 | 522 | 836 | P |
| 74.9 | 61.6 | 65.8 | 71.3 | 1005 | 337 | N | |||
|
| |||||||||
| Adaptive Boosting | 0.595 | 59.5 | 59.6 | 59.4 | 59.8 | 59.2 | 549 | 809 | P |
| 59.4 | 59.6 | 59.2 | 59.8 | 797 | 545 | N | |||
Values in the first and second rows were calculated for positive (P) and negative (N) target classes, respectively.
ML, machine learning; k-NN, k-nearest neighbors; SVM, support vector machine; SGD, stochastic gradient descent; AUC, area under the curve; PPV, positive predictive value; NPV, negative predictive value; N, negative; P, positive.
Figure 5. a, b.
Receiver operating characteristic (ROC) curves of the models for predicting lymphovascular (a) and perineural (b) invasion. SVM, support vector machine; Adaboost, adaptive boosting; SGD, stochastic gradient descent; k-NN, k-nearest neighbors.
Figure 6. a, b.
Calibration plots show predicted and actual probability (observed average) of the machine learning models for predicting lymphovascular (a) and perineural (b) invasion. SVM, support vector machine; Adaboost, adaptive boosting; SGD, stochastic gradient descent; k-NN, k-nearest neighbors.
Discussion
In this work, we focused on the most common histopathologic type of GAC, that is tubular, and investigated the potential role of CT texture analysis in predicting LVI and PNI using an ML approach with various state-of-the-art algorithms. Using the best algorithms, more than four-fifths of the tubular GACs can be correctly classified in terms of LVI status. On the other hand, only more than three-fifths of the tubular GACs can be correctly classified in terms of PNI status. Overall, the method was much more successful in predicting the status of LVI than that of PNI.
The most important tumor-related prognostic factor in all human cancers is the spread of the disease in distant organs/sites. Therefore, invasion and metastasis of the tumors at the time of diagnosis are the two most important factors related to the biological behaviors of malignant tumors. The presence of LVI and PNI is of paramount importance in the management of GACs and related to higher risk and poor prognosis (5, 7, 23–27). These factors are widely used to stratify the patients to indicate the risk of local, regional, or distant recurrence, which are currently assessed only microscopically based on postoperative specimens. Therefore, predicting LVI and PNI preoperatively might contribute to the selection of patients requiring extensive surgical procedures involving paraaortic lymphadenectomy or neoadjuvant treatment planning. Nonetheless, these factors cannot be fully evaluated by conventional imaging methods preoperatively. Given that texture analysis has potential in providing preoperative information in various tumors, it may also be helpful in preoperative risk stratification and optimal selection of GAC patients, who require more extensive surgery while avoiding over-treatment (28–33).
To our knowledge, there has been no previous work regarding the ML-based CT texture analysis of GACs for predicting LVI and PNI. Nonetheless, we found two reports in the texture literature about the prediction of LVI and or PNI status in GACs (34, 35). One of these was about entropy-related parameters based on whole-volume apparent diffusion coefficient (ADC) texture analysis at 3 T MRI, which is significantly correlated with postoperative T, N, and overall stage, as well as vascular invasion status (35). In contrast to the high-dimensionality of our work, the authors only calculated entropy-related parameters. In another work, the authors performed CT texture analysis using only the first-order texture features to predict histopathologic features of GAC. The authors suggested that the method had great potential for predicting the degree of differentiation, Lauren classification, and vascular invasion status. However, they reported no significant differences between gastric carcinoma with and without neural invasion. Major differences of our work from these previous two works are as follows: (i), the use of high-dimensional texture features; (ii), an ML approach; and (iii), rather focused analysis using the most common histopathologic type, which is of utmost significance because the GACs involve very heterogeneous subtypes that might influence the texture parameters to a large extent.
This study has several limitations. First, the number of patients is relatively small and imbalanced between classes. Second, GACs shows significant heterogeneity at both architectural and cytological evaluations, often appearing as mixed tumors. This is a major problem in interpreting the architectural structure and underlying morphologic features of these tumors. Therefore, in this work, we focused on the most common histopathologic type of GACs, which is tubular GAC. Third, two-dimensional tumor segmentation was used in this study. Three-dimensional segmentation would be much more representative in terms of tumor characteristics, but clinically time-consuming. In the future, automatic or semi-automatic segmentation techniques for gastric tumor segmentation that is coupled with texture analysis software programs would be very good solutions for this kind of evaluations. Fourth, because there is no data regarding the invasion volume, it was not possible to determine or predict the amount of LVI and PNI, which might have an influence on the textural characteristics. Fifth, due to positive oral contrast, it was very hard to correctly delineate some tumors in the early-stage. On the other hand, we performed reproducibility analysis to select the ones with excellent reproducibility. Finally, we designed the study for the prediction of LVI and PNI separately. However, it would have been much more intuitive to create new target classes such as patients with both LVI and PNI or without both LVI and PNI. However, our data size was rather small for this type of multi-class classification.
In conclusion, ML-based contrast-enhanced CT texture analysis has a potential for predicting LVI with satisfactory performance. On the other hand, the method achieved a rather fair performance for the prediction of PNI. Further studies with external and independent validation are absolutely needed before this method is introduced in the clinical work-up of this disease.
Main points.
Machine learning-based CT texture analysis has a potential for predicting the tumor aggressiveness in tubular gastric adenocarcinomas.
The method was much more successful in predicting the status of lymphovascular invasion than that of perineural invasion.
Using this method, more than four-fifths of the tubular gastric adenocarcinomas can be correctly classified for lymphovascular invasion status.
Only more than three-fifths of the tubular gastric adenocarcinomas can be correctly classified in terms of perineural invasion status.
Footnotes
Conflict of interest disclosure
The authors declared no conflicts of interest.
References
- 1.Bray F, Ferlay J, Soerjomataram I, Siegel RL, Torre LA, Jemal A. Global cancer statistics 2018: GLOBOCAN estimates of incidence and mortality worldwide for 36 cancers in 185 countries. CA Cancer J Clin. 2018;68:394–424. doi: 10.3322/caac.21492. [DOI] [PubMed] [Google Scholar]
- 2.Hwang J-E, Hong J-Y, Kim JE, et al. Prognostic significance of the concomitant existence of lymphovascular and perineural invasion in locally advanced gastric cancer patients who underwent curative gastrectomy and adjuvant chemotherapy. Jpn J Clin Oncol. 2015;45:541–546. doi: 10.1093/jjco/hyv031. [DOI] [PubMed] [Google Scholar]
- 3.Nikberg M, Chabok A, Letocha H, Kindler C, Glimelius B, Smedh K. Lymphovascular and perineural invasion in stage II rectal cancer: a report from the Swedish colorectal cancer registry. Acta Oncol Stockh Swed. 2016;55:1418–1424. doi: 10.1080/0284186X.2016.1230274. [DOI] [PubMed] [Google Scholar]
- 4.Hsu C-P, Chuang C-Y, Hsu P-K, et al. Lymphovascular invasion as the major prognostic factor in node-negative esophageal cancer after primary esophagectomy. J Gastrointest Surg Off J Soc Surg Aliment Tract. 2020;24:1459–1468. doi: 10.1007/s11605-019-04310-0. [DOI] [PubMed] [Google Scholar]
- 5.Dobriţoiu M, Stepan AE, Vere CC, Simionescu CE. Evaluation of gastric carcinomas histological patterns in relation to tumors aggressiveness parameters. Curr Health Sci J. 2018;44:342–346. doi: 10.12865/CHSJ.44.04.03. [DOI] [PMC free article] [PubMed] [Google Scholar]
- 6.Lagarde SM, Phillips AW, Navidi M, Disep B, Immanuel A, Griffin SM. The presence of lymphovascular and perineural infiltration after neoadjuvant therapy and oesophagectomy identifies patients at high risk for recurrence. Br J Cancer. 2015;113:1427–1433. doi: 10.1038/bjc.2015.354. [DOI] [PMC free article] [PubMed] [Google Scholar]
- 7.Liebig C, Ayala G, Wilks JA, Berger DH, Albo D. Perineural invasion in cancer: a review of the literature. Cancer. 2009;115:3379–3391. doi: 10.1002/cncr.24396. [DOI] [PubMed] [Google Scholar]
- 8.Roma AA, Magi-Galluzzi C, Kral MA, Jin TT, Klein EA, Zhou M. Peritumoral lymphatic invasion is associated with regional lymph node metastases in prostate adenocarcinoma. Mod Pathol. 2006;19:392–398. doi: 10.1038/modpathol.3800546. [DOI] [PubMed] [Google Scholar]
- 9.Zhang S, Zhang D, Yi S, et al. The relationship of lymphatic vessel density, lymphovascular invasion, and lymph node metastasis in breast cancer: a systematic review and meta-analysis. Oncotarget. 2017;8:2863–2873. doi: 10.18632/oncotarget.13752. [DOI] [PMC free article] [PubMed] [Google Scholar]
- 10.Lin M, Ma S-P, Lin H-Z, Ji P, Xie D, Yu J-X. Intratumoral as well as peritumoral lymphatic vessel invasion correlates with lymph node metastasis and unfavourable outcome in colorectal cancer. Clin Exp Metastasis. 2010;27:123–132. doi: 10.1007/s10585-010-9309-0. [DOI] [PubMed] [Google Scholar]
- 11.Koçak B, Durmaz EŞ, Ateş E, Kılıçkesmez Ö. Radiomics with artificial intelligence: a practical guide for beginners. Diagn Interv Radiol. 2019;25:485–495. doi: 10.5152/dir.2019.19321. [DOI] [PMC free article] [PubMed] [Google Scholar]
- 12.Lambin P, Leijenaar RTH, Deist TM, et al. Radiomics: the bridge between medical imaging and personalized medicine. Nat Rev Clin Oncol. 2017;14:749–762. doi: 10.1038/nrclinonc.2017.141. [DOI] [PubMed] [Google Scholar]
- 13.Verma V, Simone CB, Krishnan S, Lin SH, Yang J, Hahn SM. The rise of radiomics and implications for oncologic management. J Natl Cancer Inst. 2017;109 doi: 10.1093/jnci/djx055. [DOI] [PubMed] [Google Scholar]
- 14.Collewet G, Strzelecki M, Mariette F. Influence of MRI acquisition protocols and image intensity normalization methods on texture classification. Magn Reson Imaging. 2004;22:81–91. doi: 10.1016/j.mri.2003.09.001. [DOI] [PubMed] [Google Scholar]
- 15.Szczypiński PM, Strzelecki M, Materka A, Klepaczko A. MaZda--a software package for image texture analysis. Comput Methods Programs Biomed. 2009;94:66–76. doi: 10.1016/j.cmpb.2008.08.005. [DOI] [PubMed] [Google Scholar]
- 16.Cohen L. Time-frequency distributions-a review. Proc IEEE. 1989;77:941–981. doi: 10.1109/5.30749. [DOI] [Google Scholar]
- 17.Bovik AC, Clark M, Geisler WS. Multichannel texture analysis using localized spatial filters. IEEE Trans Pattern Anal Mach Intell. 1990;12:55–73. doi: 10.1109/34.41384. [DOI] [Google Scholar]
- 18.Daugman JG. Complete discrete 2-D Gabor transforms by neural networks for image analysis and compression. IEEE Trans Acoust Speech Signal Process. 1988;36:1169–1179. doi: 10.1109/29.1644. [DOI] [Google Scholar]
- 19.Yu L, Liu H. Feature selection for high-dimensional data: a fast correlation-based filter solution; Proceedings of the Twentieth International Conference on Machine Learning ICML 2003; Washington DC. 2003. [Google Scholar]
- 20.Chawla NV, Bowyer KW, Hall LO, Kegelmeyer WP. SMOTE: synthetic minority over-sampling technique. J Artif Intell Res. 2002;16:321–357. doi: 10.1613/jair.953. [DOI] [Google Scholar]
- 21.Japanese Gastric Cancer Association. Japanese gastric cancer treatment guidelines 2014 (ver. 4) Gastric Cancer Off J Int Gastric Cancer Assoc Jpn Gastric Cancer Assoc. 2017;20:1–19. doi: 10.1613/jair.953. [DOI] [PMC free article] [PubMed] [Google Scholar]
- 22.Bosman FT, Carneiro F, Hruban RH, Theise ND. WHO classification of tumours of the digestive system. WHO Classif Tumours Dig Syst. Ed. 4. 2010. [Accessed on: August 15, 2019]. https://www.cabdirect.org/cabdirect/abstract/20113051318.
- 23.Park J-M, Ryu W-S, Kim J-H, et al. Prognostic factors for advanced gastric cancer: stage-stratified analysis of patients who underwent curative resection. Cancer Res Treat Off J Korean Cancer Assoc. 2006;38:13–18. doi: 10.4143/crt.2006.38.1.13. [DOI] [PMC free article] [PubMed] [Google Scholar]
- 24.Chen X-L, Pu H, Yin L-L, et al. CT volumetry for gastric adenocarcinoma: association with lymphovascular invasion and T-stages. Oncotarget. 2018;9:12432–12442. doi: 10.18632/oncotarget.23478. [DOI] [PMC free article] [PubMed] [Google Scholar]
- 25.Royston D, Jackson DG. Mechanisms of lymphatic metastasis in human colorectal adenocarcinoma. J Pathol. 2009;217:608–619. doi: 10.1002/path.2517. [DOI] [PubMed] [Google Scholar]
- 26.Cornwell LB, McMasters KM, Chagpar AB. The impact of lymphovascular invasion on lymph node status in patients with breast cancer. Am Surg. 2011;77:874–877. doi: 10.1177/000313481107700722. [DOI] [PubMed] [Google Scholar]
- 27.Chatterjee D, Katz MH, Rashid A, et al. Perineural and intraneural invasion in posttherapy pancreaticoduodenectomy specimens predicts poor prognosis in patients with pancreatic ductal adenocarcinoma. Am J Surg Pathol. 2012;36:409–417. doi: 10.1097/PAS.0b013e318240c1c0. [DOI] [PMC free article] [PubMed] [Google Scholar]
- 28.Peng J, Zhang J, Zhang Q, Xu Y, Zhou J, Liu L. A radiomics nomogram for preoperative prediction of microvascular invasion risk in hepatitis B virus-related hepatocellular carcinoma. Diagn Interv Radiol. 2018;24:121–127. doi: 10.5152/dir.2018.17467. [DOI] [PMC free article] [PubMed] [Google Scholar]
- 29.Kumar V, Gu Y, Basu S, et al. Radiomics: the process and the challenges. Magn Reson Imaging. 2012;30:1234–1248. doi: 10.1016/j.mri.2012.06.010. [DOI] [PMC free article] [PubMed] [Google Scholar]
- 30.Gillies RJ, Kinahan PE, Hricak H. Radiomics: images are more than pictures, they are data. Radiology. 2016;278:563–577. doi: 10.1148/radiol.2015151169. [DOI] [PMC free article] [PubMed] [Google Scholar]
- 31.Lambin P, Rios-Velazquez E, Leijenaar R, et al. Radiomics: extracting more information from medical images using advanced feature analysis. Eur J Cancer Oxf Engl. 2012;48:441–446. doi: 10.1016/j.ejca.2011.11.036. [DOI] [PMC free article] [PubMed] [Google Scholar]
- 32.Limkin EJ, Sun R, Dercle L, et al. Promises and challenges for the implementation of computational medical imaging (radiomics) in oncology. Ann Oncol Off J Eur Soc Med Oncol. 2017;28:1191–1206. doi: 10.1093/annonc/mdx034. [DOI] [PubMed] [Google Scholar]
- 33.Aerts HJWL, Velazquez ER, Leijenaar RTH, et al. Decoding tumour phenotype by noninvasive imaging using a quantitative radiomics approach. Nat Commun. 2014;5:4006. doi: 10.1038/ncomms5006. [DOI] [PMC free article] [PubMed] [Google Scholar]
- 34.Liu S, Liu S, Ji C, et al. Application of CT texture analysis in predicting histopathological characteristics of gastric cancers. Eur Radiol. 2017;27:4951–4959. doi: 10.1007/s00330-017-4881-1. [DOI] [PubMed] [Google Scholar]
- 35.Liu S, Zheng H, Zhang Y, et al. Whole-volume apparent diffusion coefficient-based entropy parameters for assessment of gastric cancer aggressiveness. J Magn Reson Imaging. 2018;47:168–175. doi: 10.1002/jmri.25752. [DOI] [PubMed] [Google Scholar]


