Abstract
The mechanical properties and damage behaviors of carbon/epoxy woven fabric composite under in-plane tension and compression are studied at the meso-scale level through experiment and simulation. An efficient representative volume element (RVE) modeling method with consistent mesh, high yarn volume fraction and realistic geometry is proposed. The material constitutive laws with plasticity, tension-compression asymmetry and damage evolution are established for the three components - yarn, matrix and interface, respectively. Significantly different mechanical properties and damage evolutions are observed depending on loading conditions and initial geometry characteristics. It shows a non-linear stress-strain curve with clear transition region and intensive damage in tension, while a quasi-linear behavior up to facture is observed in compression with little damage prior to final fracture. Moreover, compared to the constant Poisson’s ratio with straining in compression, a dramatic increase in Poisson’s ratio appears in tension. Simulation shows damage mechanisms including transverse damage, matrix damage and delamination, which all play critical roles in the property evolution. In particular, the rapid damage accumulation after elastic deformation destroys the strong bonds and causes the easy deformation of transverse yarns which results in the transition region and large Poisson’s ratio in tension. All the mechanical behaviors and damage evolutions are well captured and explained with the current RVE model.
Keywords: woven fabric composite, RVE, constitutive law, damage evolution
1. Introduction
Carbon fiber reinforced plastic (CFRP) composites have been widely applied in aerospace and automotive applications due to their high specific stiffness and strength values. As one of the most important application forms, woven fabric composites show advantages in several aspects over non-woven counterparts, such as balanced in-plane mechanical properties, excellent drape ability and enhanced resistance to impact damage [1][2]. However, the complex structural features including curved yarns, multitude interfaces, resin-rich areas and different stacking patterns lead to significant variations in mechanical properties and damage behaviors, which dramatically increase the difficulties of analyses and thus hinder the potential applications [3].
Recent experimental works have been widely conducted on the characterization of mechanical properties and damage evolutions of woven composites. Depending on the fabric patterns and individual component properties, different mechanical behaviors have been observed, such as quasi-linear [1][4] and nonlinear stress-strain curves [5]–[8] under on-axial tension. Meanwhile, the on-axial compression strength shows to positively depend on the curvature radius of yarn [9]. Under compression, yarns tend to fail at the crimp region with a kinking mechanism [10], which is also affected by the stacking pattern [3] and through-thickness constraints [11]. Therefore, both mechanical properties and damage development in woven fabric composites are shown to be closely related to the local geometry and loading conditions. These complex behaviors of woven composite make the experimental identification cost and time-consuming. Moreover, some properties, such as the out-of-plane properties, are difficult to be measured directly.
Finite element (FE) simulations with representative volume element (RVE) at the meso-scale have been proved to be a powerful tool in predicting woven fabric composite properties [12]. Both FE mesh models and material constitutive laws are essential for a well-established RVE model. However, the complex geometry characteristics and the high yarn volume fraction of woven fabric composite pose great challenges to FE modeling. The voxel meshing method is widely used in the RVE model generation due to its simplicity of implementation, and well suited in the elastic property prediction [13]. However, the step-like shape in the voxel mesh model will cause unrealistic stress concentration and thus damage initiation [13][14]. Therefore, smoothing algorithm on voxel mesh has been developed in order to produce a suitable contact surface with certain loss of mesh quality [15]. Generally speaking, consistent mesh model which can capture the yarn surface smoothly provides better predictions in terms of damage. However, the small geometry features in the resin pocket induce remarkable difficulties in model development and usually lead to poor mesh quality. In order to generate the RVE model with high mesh quality, it usually has to construct simplified geometries in CAD software first [16]–[25]. However, this method requires tedious manual work and can be only applied to specific geometries. Given these challenges, many researchers have been working on developing methods to generate consistent mesh RVE. Grail et al. [26] presented an automatic method with a parametrized yarn surface to generate smooth meshes for textile composite unit cell. Doitrand et al. [13][27][28] further extended this method and studied the mechanical properties under various conditions. Wintiba et al. [29] developed an integrated method with contact conditions to generate the RVE model. Rinaldi et al. [30] generated the virtual textile composite specimen with statistical data from micro-computed tomography by a Monte Carlo algorithm. Pierreux et al. [31] proposed an approach with loose-state fiber-bundles to generate 3D orthogonal woven fabric composite model with cross-section variations. Despite these recent efforts, RVE modeling with high yarn volume fraction and good mesh quality is of great interest in the field of woven composite modeling.
Regarding material constitutive models, in order to capture the damage evolution in RVE simulations, the yarn and epoxy matrix are usually modeled by continuum damage mechanics (CDM) laws with different damage modes. For simplification purposes, the yarn and matrix are commonly modeled with transverse isotropic elastic law and isotropic elastic law to damage [6][17][18][27], respectively. However, the yarn can exhibit remarkable plasticity under shear [32]–[34] and transverse compression loadings [35]–[37], which leads to a large divergence from the elastic law. Moreover, the epoxy resin also shows significant plastic deformation and tension-compression asymmetry [38][39]. Recent efforts have been made to model these material behaviors with more accurate constitutive laws. Tabiei et al. [40] used the Ramberg-Osgood equation to describe the shear nonlinearity in simulation of woven fabric composite. Carvalho et al. [19] modeled the resin with a linear Drucker-Prager model, and the matrix plasticity showed a significant effect in the tensile behavior of woven composites. Melro et al. [41] and Stier et al. [42] applied an elasto-plastic law with isotropic damage to model the epoxy resin in their RVE simulations. Chen et al. [43] developed an elasto-viscoplastic damage model and implemented to the failure analysis of composite laminates at various strain rates. More recently, Wang et al. [44] proposed an accurate and efficient method for modeling unidirectional laminates considering both anisotropic plasticity and hydrostatic pressure sensitivities. It captures the damage behaviors well in the Iosepescu test with different orientations and thicknesses. Additionally, delamination is another important failure mechanism which affects the mechanical properties remarkably [27][45], but most studies fail to consider this mechanism. To avoid the difficulties in RVE model generation, rigid tie/shared nodes are commonly applied to the interfaces [16]–[18][24][27], but these methods suffer from a large deviation from realistic failure mechanisms.
In current work, to obtain a comprehensive understanding of the woven fabric composite properties and damage evolutions under in-plane loadings, a systematic computational approach based on RVE simulation is proposed. First, a consistent mesh generation method is proposed to build a multi-layer RVE model with high mesh quality and yarn volume fraction. Then, a new elasto-plastic constitutive law with damage evolution is developed for the yarn, and an elasto-plastic-damage constitutive law is applied to the epoxy matrix together with a delamination model to describe the interface behavior. The predicted deformation and damage behaviors by RVE simulations are compared with experimental results on a typical carbon/epoxy woven composite under in-plane tension and compression, including stress-strain behavior, Poisson’s ratio evolution and failure morphology. The corresponding damage evolutions in the woven fabric composite are subsequently analyzed through both simulation and experimental results.
2. Material and experiment setup
2.1. Material
A 2× 2 twill carbon/epoxy woven composite of 660 g/m2 area density is fabricated with hot compression (referred as twill-660 hereafter) for further testing [45][46]. The woven fabric plaques are molded with A42 carbon fiber with a diameter of 7 μm and thermoset epoxy resin, which are both supplied by Dow Chemical Company. Plaques of 300×300 mm2 are fabricated with 4 prepreg plies in the same lay-up direction to obtain a nominal thickness of 2.5 mm. Both warp and weft yarns have the same bundle size of 12K (number of filaments in one bundle) and weave density of 4 picks/cm (number of bundles per centimeter). The fiber volume fraction of 52.5% is measured by both burning-off test and density test.
As shown in Fig. 1, the twill composite shows a complex initial configuration. Both warp and weft yarns have a quasi-elliptical shape. Due to the specific weaving processing, the yarns in two directions also have different cross-section geometries as marked in Fig. 1 (average values). Moreover, yarns in warp direction show less undulation than those in weft direction, which can be characterized by the crimp ratio [46]. Table 1 summarizes the initial geometries of current twill-660. Since no special control is implemented in the molding processing, different stacking patterns are observed due to the misalignment between two adjacent layers, including balanced, nested and aligned, as marked in Fig. 1.
Fig. 1.
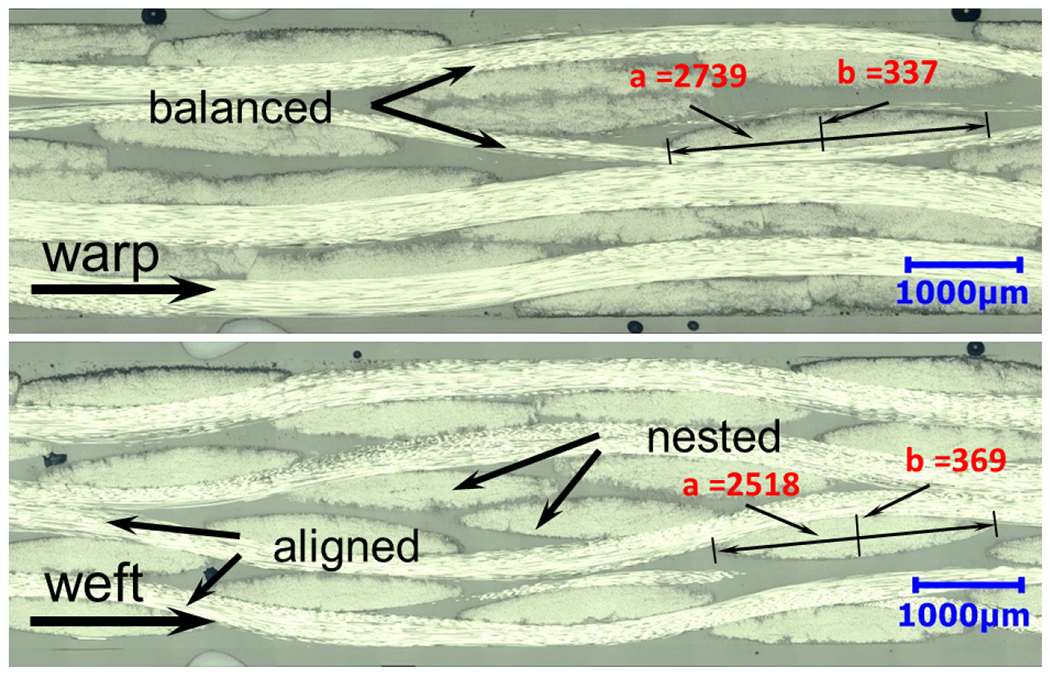
Initial microstructures along both warp and weft directions of a twill-660 composite. Different geometries and stacking patterns are observed in both directions, (a and b represent the long and short diameter, respectively.)
Table. 1.
Initial configuration of the twill-660 composite.
| Yarn Geometry | |||
| Warp a (mm) | 2.518 | Warp b (mm) | 0.369 |
| Weft a (mm) | 2.739 | Weft b (mm) | 0.337 |
| Warp crimp ratio (%) | 0.659 | Weft crimp ratio (%) | 0.933 |
| Volume fraction (VF) | |||
| Yarn VF (%) | 87.3 | Fiber VF in yarn (%) | 60.1 |
| Fiber VF (%) | 52.5 | ||
The yarn volume fraction and fiber volume fraction in a yarn are evaluated and summarized for the later modeling process. Typically, the yarn volume fraction can be measured from the optical images. However, many images in the depth direction are required to obtain an accurate volume fraction, since the measured volume fraction of transverse yarns in the observation plane highly depends on the cutting depth. In the present work, the total yarn volume fraction is obtained by calculating the out-of-plane yarn cross-section area from two groups of orthogonal side sections (including at least two images for each group) with a Matlab code. Two representative images for both directions are shown in Fig. 2. Then the average fiber volume in the yarn is calculated from the total fiber volume fraction and the yarn volume fraction as:
| (1) |
Fig. 2.

Calculation of total yarn volume fraction based on the images from two orthogonal sections. The fractions of the green regions measured in the two directions will be summed up to obtain the total yarn volume fraction.
2.2. Uniaxial tension and compression test setup
The in-plane properties of twill-660 composite are investigated under uniaxial tension and compression. The tensile samples with dimensions of 200 mm × 25 mm are prepared following the ASTM standard D3039, and compression samples are of dimensions of 140 mm × 12 mm following the ASTM standard D6641. All the samples are prepared by water jet cutting away from the plaque edges. The sample edges are further polished with sandpaper of #400 and #1200. In order to reduce stress concentration and avoid premature failure at the gripping area, glass/epoxy composite tabs of 1.6 mm thickness are glued to the sample ends with DP420 adhesives. The detailed geometries of the samples are shown in Fig. 3(a).
Fig. 3.
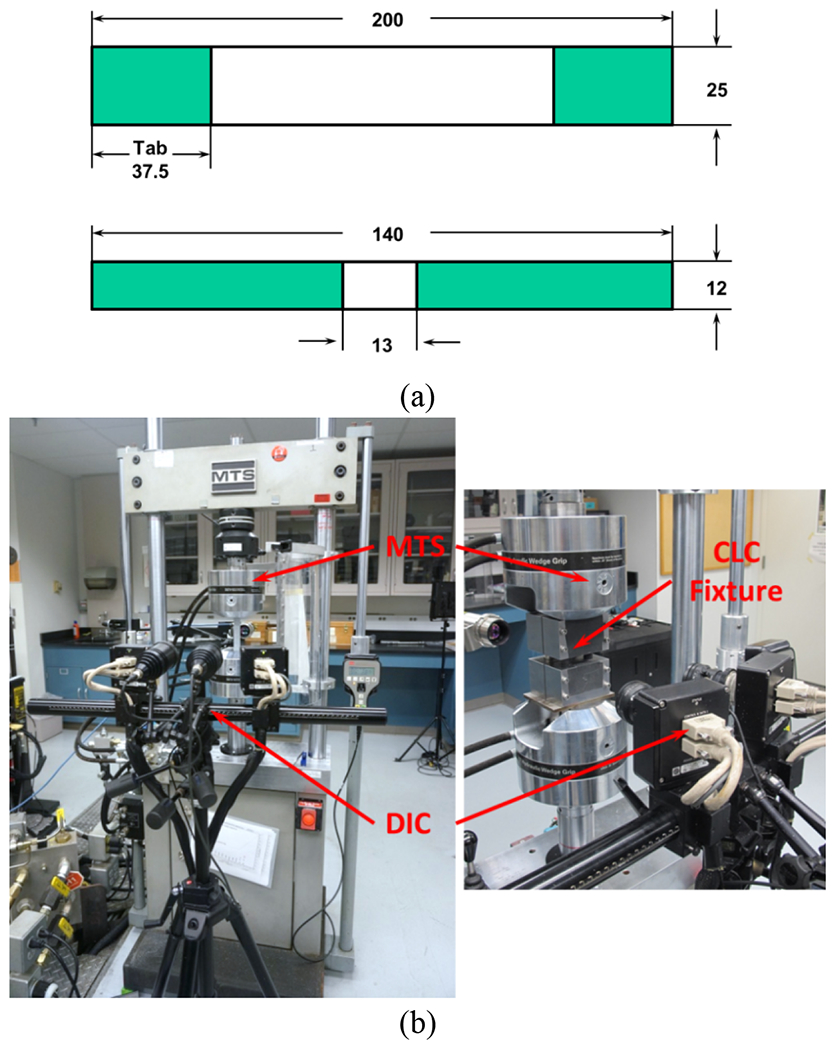
(a) Uniaxial tension and compression sample geometry (unit: mm), (b) experiment setup for uniaxial tension and compression test.
Quasi-static uniaxial tension and compression tests are performed with an MTS servo-hydraulic testing machine at constant loading speeds of 2 mm/min and 1.3 mm/min respectively, as shown in Fig. 3(b). The compression loading is applied to the specimen through shear and end compression with a combined loading compression (CLC) test fixture. The full-field strain is measured with the DIC technique (ARAMIS system, in 3D mode with a maximum camera resolution of 4 megapixels). White color background and a black spry are used to generate a spotted pattern for the DIC measurement. To examine the damage evolution with strain and identify damage modes, samples are loaded to several specific strain levels and subsequently cut for microstructure analysis. The samples are mounted with epoxy resin and further polished with sandpapers and diamond suspensions. Optical microscopy images are captured by a Keyence vhx2000 system.
3. RVE model development
3.1. RVE model and mesh generation
In this section, the existing challenges on RVE modeling and mesh generation are further illustrated, and then a new method to address these challenges is proposed. The first challenge is that high-quality mesh is usually prohibited by complex geometry features, such as gap and penetration. Fig. 4 shows that although two contacted yarns share the same geometry boundary, there still can be certain mismatches between the discrete elements after regular meshing. In addition, the gradual separation of yarn boundaries further introduces tiny features and leads to poor-quality elements. The second challenge is that by using the previous method, the corresponding yarn volume fraction can only reach a relatively low value, while the yarn volume fraction is much higher in real applications (over 87% in current work). Moreover, the yarns are usually modeled by sweeping a constant cross-section along an idealized path. However, both yarn shape and path evolve remarkably after the compression molding in practice, depending on the neighboring contacts.
Fig. 4.
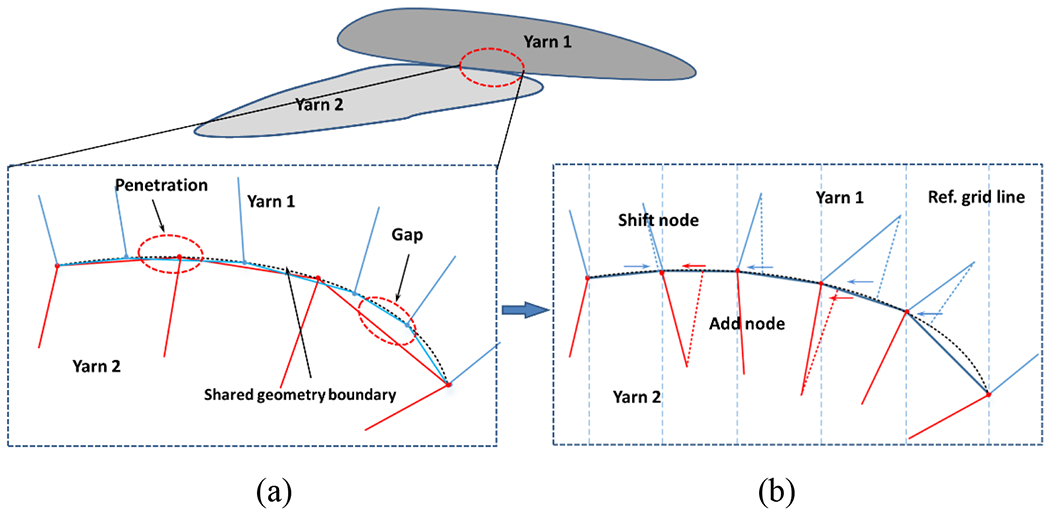
Penetration and gap generated in the meshing process even with the shared geometry boundary, and the modifications on the meshes: (a) unprocessed meshes and (b) processed meshes.
In current work, a mesh dependent method is proposed, which processes the node and mesh directly to eliminate the small overlaps and gaps, as shown in Fig. 4(b). The gaps among mesh elements can be eliminated by shifting nodes within a cutoff distance to the same location and adding additional nodes when necessary. TexGen [47] is implemented to generate the initial mesh for the dry fabric only. Then, a compression molding simulation with Abaqus is performed on the dry fabric model. The effects of the compression simulation are two-fold. First, it aims to capture the influence of compression molding in practice on yarn geometry and the variation of cross-sections along the yarn. Second, this will increase the yarn volume fraction in the model. A Matlab code is developed to process the mesh model before and after the compression simulation to eliminate any tiny gaps or penetrations. A layer of cohesive elements with zero thickness and high-quality matrix mesh are also generated after the compression simulation on dry woven fabric by using the Matlab code. The yarn is modeled with C3D8R and C3D6R elements, and the interface is modeled with COH3D6 and COH3D8 elements. To describe the complex matrix pocket accurately, tetrahedral element C3D4 is adopted.
Here, the basic steps for the proposed mesh generation method are summarized below:
1). A rough mesh of dry woven fabric is generated by using TexGen.
2). Apply a Matlab code to rearrange the nodes, elements and orientations, and generate a model for the following compression molding simulation. The operation of rearrangement is performed based on a virtual space with evenly distributed grid lines at a step size comparable to the element size. The nodes’ positions are compared with the referential grid lines, and different operations, including shifting and adding nodes, are correspondingly conducted to eliminate the gaps and penetrations, as shown in Fig. 4(b).
3). Boundary conditions, including in-plane tension and compression in the normal direction, are applied in the compression molding simulation with Abaqus to reach the target crimp ratio and thickness in real geometry, and the new node coordinates and orientations are output for post-processing.
4). Post-process, including rearranging nodes, elements and orientations again, generating the cohesive layer and matrix part based on the compressed dry fabric mesh information, is implemented by using the Matlab code. The surface facets of the dry fabric are identified to form volume parts by Boolean calculation with a cuboid which is further meshed as the matrix part. The cohesive layer is also generated by offsetting the surface facets of dry fabric. These three parts, including dry fabric, cohesive layer and matrix, are assembled to form the final RVE model.
In summary, comparing to the common RVE models, the model in this work has several key advantages. First, a high yarn volume fraction of over 87% is achieve, close to the actual specimen. Second, the RVE model in this study conserves the orientation distribution and cross-section variation of yarns with the compression deformation simulation, thus achieving a more realistic geometry. These advantages of constructed RVE model enable a more accurate investigation of the mechanical properties and damage behaviors of woven composites, which will be discussed in more detail in Section 4.
3.2. RVE model details and its validation with experimental results
Based on the optical analysis, mixed stacking patterns are observed in current composite. Moreover, it has been reported that the interaction between adjacent layers affects the stress/strain filed significantly, which should not be neglected [2][3][18][48]. As a result, a single layer RVE model is not capable to capture these effects correctly. In the present work, a 4-layer dry fabric model with a nested pattern according to the actual ply quantity is established to capture the effects of complex patterns and adjacent layers. Although a more sophisticated model with various stacking patterns can better capture the complexness, only nested pattern is considered here for the balance between modeling simplification and accuracy. More complex RVE analysis will be explored in future work.
In the current woven fabric composite, the warp and weft yarns are of different cross-section shapes and crimp ratios. Therefore, the initial dry fabric is modeled with different yarn geometries, and different tension loadings are applied to both directions during the compression molding simulation. The applied tension displacements in warp and weft directions are calculated based on corresponding crimp ratios, and the displacement of compression is constrained to match the actual thickness. A transversely isotropic elastic model is used in the molding simulation, which is sufficient to capture the yarn shape and orientation evolutions at this stage [27]. Since the fabric prepreg is not cured during the hot compression, a weak elastic property is assigned to the yarn with E1=126 GPa, E2=E3=0.8 GPa, G12=0.4 GPa, v12=0.32, v23=0.6 to ensure bending deformation and yarn section evolution, where the three directions are defined as in Fig. 5(b). The contact between yarns is modeled by penalty method with a low friction coefficient of 0.01.
Fig. 5.
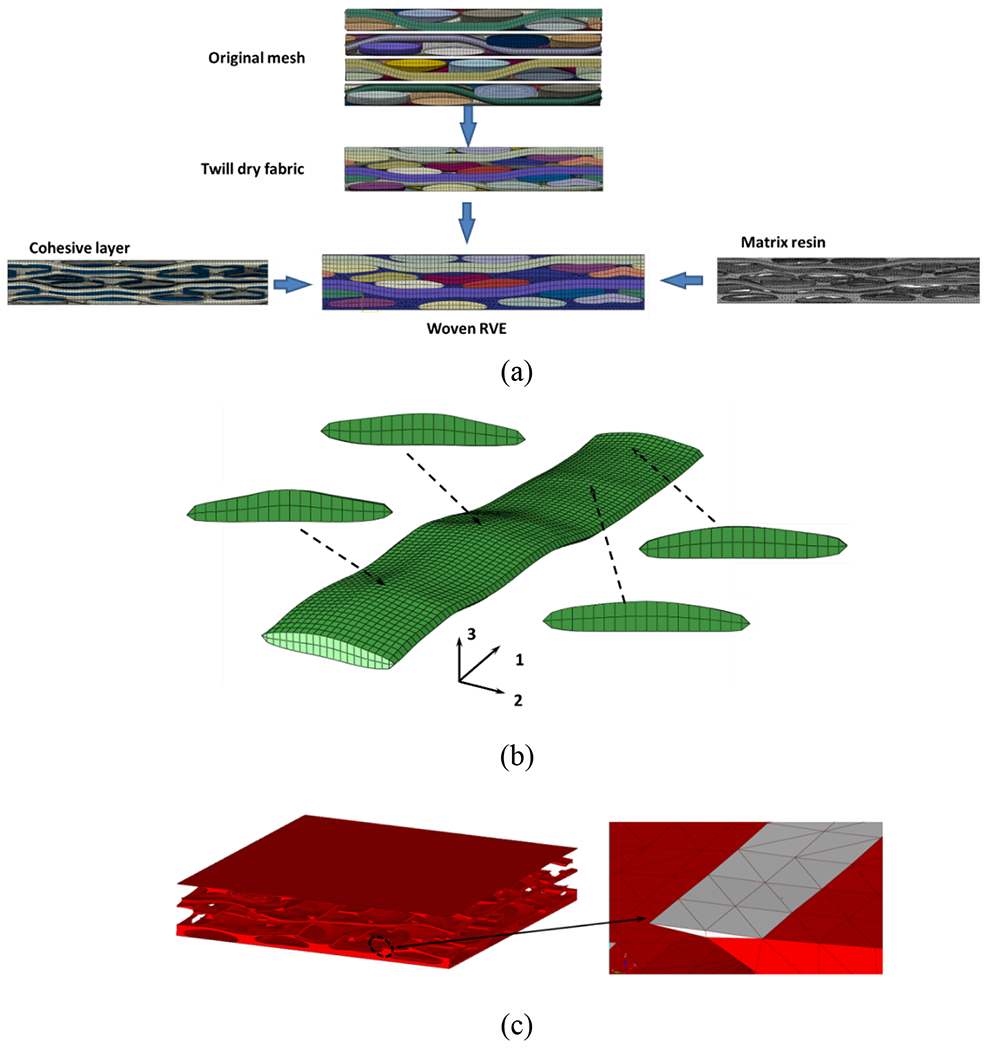
(a) RVE model incorporating dry fabric, cohesive layer and matrix parts, (b) yarn cross-section variation, (c) mesh quality of the matrix part (elements of high aspect ratio are marked in white).
Fig. 5(a) illustrates the final woven RVE model generated with the proposed method. The size of RVE is 12.5 mm × 12.5 mm × 2.5 mm (4 × 4 yarns in-plane and 4 layers in the thickness direction). Compared with the initial FE model generated from TexGen, where the yarn volume fraction can only reach 75% (far below the real volume fraction), the yarn volume fraction increases significantly to 89% using current method, close to the actual specimen. With even larger compression deformation, the final yarn volume fraction can be further increased. Although initial yarn cross-section is assigned to be constantly elliptical, after further deformation under compression, cross-sections variations are observed along the yarn (Fig. 5(b)). Mesh quality checking shows that there are only 7% matrix elements with poor aspect ratio quality, which are defined by an aspect ratio larger than 10, and the worst scenario in our case is an aspect ratio of 19, as shown in Fig. 5(c).
Yarn orientation is another important factor that affects the mechanical property directly. It is thus critical for an RVE model to capture the orientation distribution accurately. Fig. 6 shows the comparison of orientations between image analysis and RVE model after compression simulation in both warp and weft directions. Although crimp ratio is the only controlling parameter in the compression molding simulation, the measured and simulated results on yarn orientation show a very good agreement. Meanwhile, the clear difference between orientation distributions of warp and weft directions is captured in current RVE model.
Fig. 6.
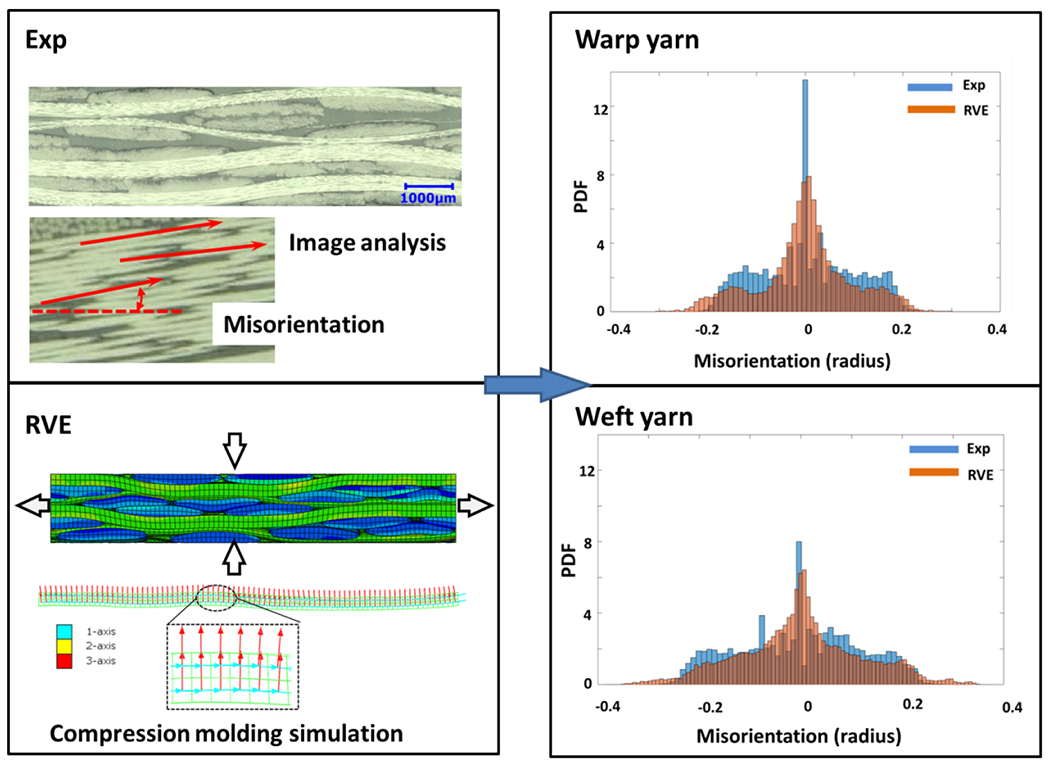
Comparison of yarn orientations from experiment analysis and RVE compression molding simulation.
To replicate the repeatable nature of woven composite, periodic boundary conditions (PBC) are implemented in current composite RVE simulations. The displacement constraint for each pair of nodes on the opposite surfaces of RVE model is applied. Since the current RVE model consists of the actual number of layers in thickness direction, there are no boundary constraints on the top and bottom surface nodes. The specimen used in the compression test has a similar size compared to the RVE model with only 4 yarns along the loading direction, and therefore no PBC is applied to the end surfaces in compression simulation.
3.3. Material constitutive laws
The established RVE model includes three components, i.e., yarn, interface (cohesive layer) and matrix, of which different material constitutive laws will be introduced individually in this section.
3.3.1. Yarn
The yarns in woven composite have similar properties with a typical unidirectional (UD) composite element [24][42]. In previous studies, linear elastic constitutive law has been widely applied to the yarns since UD composite generally exhibits quasi-linear behavior along the fiber direction. Nevertheless, significant nonlinear mechanical behaviors under transverse compression and shear loading have been reported, as well as strong tension-compression asymmetry in the transverse direction. Moreover, the dependence of yield strength and stress-strain curves on hydrostatic pressure has been found to be critical [37][44]. Thus, the linear elastic constitutive model is over-simplified and cannot well capture these complex behaviors. Here, an elastic-plastic-damage model is developed for the yarn. Specifically, the yarn is assumed to be transversely isotropic elastic until yielding. Then, Liu-Huang-Stout yield criterion which is an anisotropic form of the Drucker-Prager yield function is adopted to describe the heterogeneous deformation behaviors [49]:
| (2) |
where F, G, H, I, J, K and L are parameters of anisotropy. The Liu-Huang-Stout yield criterion can describe the complex deformation evolutions observed in UD composite, such as tension-compression asymmetry and non-linear shear behaviors. Due to the transversely isotropic behavior in the yarn, these parameters can be further simplified and defined as [50]:
| (3) |
where σ1t and σ1c are the longitudinal tensile and compressive yield stresses; σ2t σ2c are the transverse tensile and compressive yield stresses; and are the in-plane and out-of-plane shear stresses.
An associative flow rule is adopted to describe the yield surface evolution:
| (4) |
where represents the plastic multiplier and is determined by the Newton-Raphson method.
In order to characterize the damage evolutions, the above elasto-plastic constitutive model is implemented into the CDM framework. Chang/Chang failure criterion incorporating various damage mechanisms is adopted to describe the damage initiation [51]. Both the tension and compression failures in the longitudinal and transverse directions are identified as characteristic failure modes, which are described as follows:
| (5) |
where Xt, Xc, Yt, Yc and Sc are the failure strengths for fiber tension, fiber compression failure, transverse tension, transverse compression and in-plane shear, respectively.
Once the yarn is damaged according to Eq. 5, the damage variables and corresponding stress evolution are evaluated by CDM. The Murakami’s damage tensor [52][53] is adopted here.
| (6) |
where di (i=1,2,3) means the damage in the i direction.
After the damage is initiated, the elastic stiffness matrix starts to degrade, depending on the damage mode. The constitutive equation for the damaged yarn is derived with effective stress (σ*) in the fictitious undamaged configuration. The Cauchy stress (σ) in the damaged configuration is related to the effective stress as:
| (7) |
Eq. 7 can be rewritten with linear transformation tensor M(D):
| (8) |
According to the energy equivalence hypothesis, the damaged stiffness can be derived as:
| (9) |
where bi =1 − di, bij =(2(1 − di)(1 − dj) / (2 − di − dj))2, (i, j=1,2,3), S and C are the compliance and stiffness matrices.
The damage evolution is driven by the strain variable in the form as:
| (10) |
where εi0 and εif are the strains at the onset and end of the failure, respectively. εi0 is the strain corresponding to damage initiation with the failure criterion in Eq. 5, and it is only related to the stress state. The post-failure behavior is governed by the damage evolution law, which is associated with the fracture toughness, element stress and element characteristic length. To avoid the element size effect on the post-failure behavior, the strain at the end of failure is determined by the fracture toughness based on smeared formulation [32]:
| (11) |
where Gi and Xi are the fracture toughness and strength of i damage mode, respectively; Lc is the characteristic element size. Table 2 lists the parameters of yarn which are from theoretical estimation based on the supplier datasheet and previous experiments [39][54]. The fracture toughness values are adopted from the results of unidirectional reinforced carbon/epoxy laminate in Ref. [32]. More detailed verification of the yarn constitutive model will be provided in Appendix A.
Table. 2.
Mechanical properties of the yarn material.
| Elastic properties | |||
| E1 (GPa) | 148.38 | E2 (GPa) | 9.72 |
| G12 (GPa) | 5.88 | v12 | 0.32 |
| v23 | 0.6 | ||
| Damage properties | |||
| Xt (MPa) | 2810 | Xc (MPa) | 1200 |
| Yt (MPa) | 63.5 | Yc (MPa) | 250 |
| Sc (MPa) | 84 | Gxt (N/mm) | 91.6 |
| Gxc (N/mm) | 79.9 | Gyt (N/mm) | 0.022 |
| Gyc (N/mm) | 2.0 | ||
3.3.2. Resin
The epoxy resin is described with an elasto-plastic with damage constitutive model proposed by Melro [38], which has been widely applied in epoxy resin simulations [39][41] [42]. The paraboloidal yield criterion considering hydrostatic pressure is adopted.
| (12) |
where J2 is the second invariant of the deviatoric stress tensor, I1 the first invariant of the stress tensor, σc and σT the corresponding yield stress under compression and tension. To model the volumetric deformation correctly, the following non-associative flow rule is used:
| (13) |
where is the von Mises stress, P = 1/ 3I1 and α is a material parameter, which is calculated from the plastic Poisson’s ratio:
| (14) |
Therefore, the plastic strain rate can be expressed as:
| (15) |
where represents the plastic multiplier determined with the Newton-Raphson method.
Isotropic damage model with a single damage variable is applied, and the loading function is defined as the effective stress tensor:
| (16) |
where Xc and Xt are the matrix resin compressive and tensile strengths. , and are determined with effective stress tensor.
The damage variable evolves following an exponential law:
| (17) |
where Am is a parameter related to the energy release rate, correlated with the characteristic element size, and rm is the damage internal variable. The updated damage variable dm is applied in the calculation of stiffness tensor and stress tensor. For more detailed description on the resin model, one can refer to [3 8][39].
The material parameters (Table 3) of the epoxy matrix are obtained from experiments under various loading conditions and has been reported in Ref. [39][50].
Table. 3.
Mechanical properties of the epoxy resin.
| Em (GPa) | 3.8 | vp | 0.3 |
| vm | 0.38 | Xc (MPa) | 300 |
| Xt (MPa) | 61.6 | GIC (N/mm) | 0.3341 |
3.3.3. Interface
The yarn-yarn and yarn-matrix interfaces are modeled with cohesive elements of zero thickness. Traction-separation including damage initiation and propagation is used to simulate the interface behaviors. The interfaces deform elastically until damage occurring which is determined by a quadratic function of nominal stress:
| (18) |
where ts, tt, tn are the nominal stresses in the first, second shear directions and normal direction to the interface. The Macaulay bracket means that the compressive normal stress does not contribute to the damage initiation. N and S are the critical stresses for Mode I and Mode II/III delamination, respectively. The critical fracture toughness is defined based on the Benzeggath-Kenane (BK) criterion for the mixed fracture modes:
| (19) |
where GTC is the total energy release rate, GIC and GIIC the measured critical fracture toughness from pure mode I and Mode II experiments, m the BK material parameters. For detailed delamination tests, one can refer to the previous work [55]. The corresponding properties for different modes are listed in Table 4.
Table. 4.
The properties of the interface.
| K (N/mm3) | 1e5 | N (MPa) | 20 |
| S (MPa) | 20 | GIC (N/mm) | 0.36 |
| GIIC/GIIIC (N/mm) | 0.48 | m | 1.2 |
4. Results and discussions
Simulations of uniaxial tension and compression are performed with the above RVE model and constitutive laws to study the mechanical behaviors of twill-660 carbon/epoxy woven fabric composite. Simulation results are compared with experimental observations side by side from several aspects as discussed below.
4.1. Stress-strain curves
Fig. 7 compares the mechanical behaviors of twill-660 composite under tension and compression in both warp and weft directions. Under tension, a clear transition region is observed in both warp and weft directions where the tangent modulus drops after the initial elastic stage. After that, the stress increases quasi-linearly again until final failure. Based on previous experimental results [45][56], the stress-strain evolution is determined by multiple hardening and softening mechanisms. The rapid development of damage is the main reason for transition region. Meanwhile, due to the difference in crimp ratio, the warp direction shows stronger mechanical properties than those in the weft direction. Compared with tension results, a significantly different mechanical behavior is observed under compression. The compressive stress increases quasi-linearly until final failure, and shows much less nonlinearity during deformation. In compression, a smaller initial crimp ratio also generates a higher strength in warp direction, although the trends of stress-strain behaviors in two directions are similar. The current RVE model can capture the distinctive mechanical behaviors under in-plane tension and compression accurately. Especially, the transition region is well reproduced, and the difference in warp and weft directions is conserved.
Fig. 7.
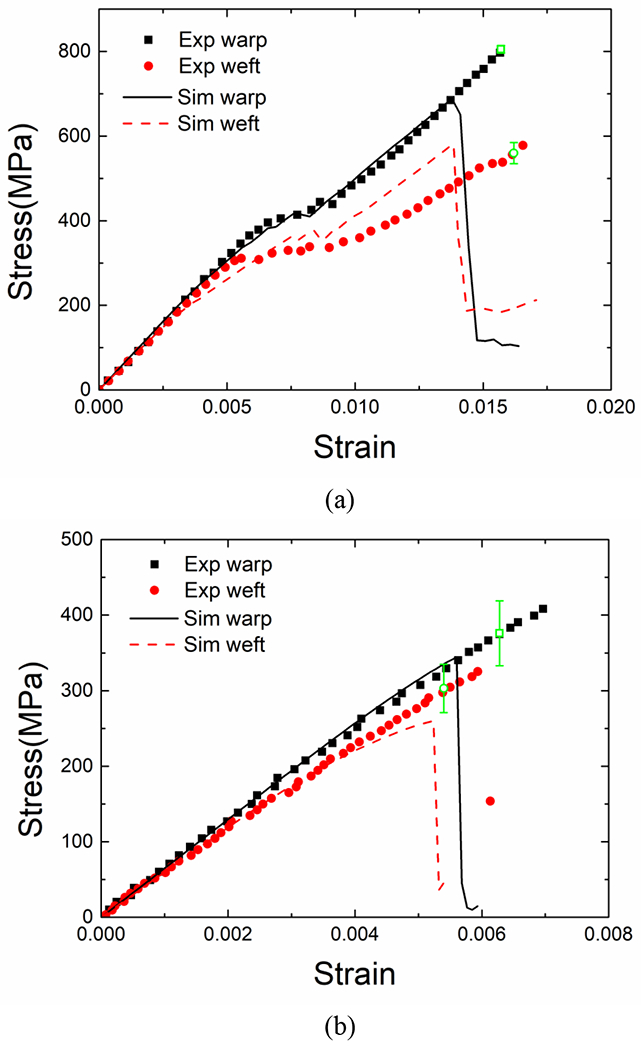
Comparison of stress-strain curves between experiment and simulation for uniaxial tension (a) and compression (b). The average experimental strengths are also marked as green dots in the figures.
The final failure morphologies in experimental and simulation results are compared in Fig. 8. Both tension and compression samples show catastrophic failure. Severe delamination with resin failure is observed in tension, and the delamination propagates through the whole sample. The tension sample breaks into several pieces/layers once it fails. This is related to the pull-out effect and intensive delamination between layers [57]. Axial yarns tend to have out-of-plane displacement, and the transverse yarns can only provide limited resistance against that. Once the interface fails with large delamination zone, abrupt pull-out of the axial yarns occurs due to the loss of through-thickness support. A significant matrix resin failure is also observed in experiments, as plenty of resin powders or debris are found after tests. In the RVE simulation, there will be a catastrophic failure once the yarn breakage occurs. Meanwhile, significant delamination among plies appears with the yarns being straightened. Even prior to the final yarn breakage, intensive resin damage develops on the RVE surface. It demonstrates that the resin damage and delamination initiate at an early stage and keep accumulating until the final tension failure. For the compression case, the samples also show a catastrophic failure mode, and transverse yarns crack and delamination are observed after the test. Different from the gradual damage accumulation under tension, no clear damage is observed in the compression simulation before final rupture. Therefore, the delamination and resin damage are caused by the yarn breakage and occur at the final stage simultaneously. Simulation results provide detailed insights into the failure behavior by preserving all the details in the evolution process. In summary, the failure modes in both tension and compression are well captured by current simulation, which also provides in-depth insights into the damage evolution process.
Fig. 8.
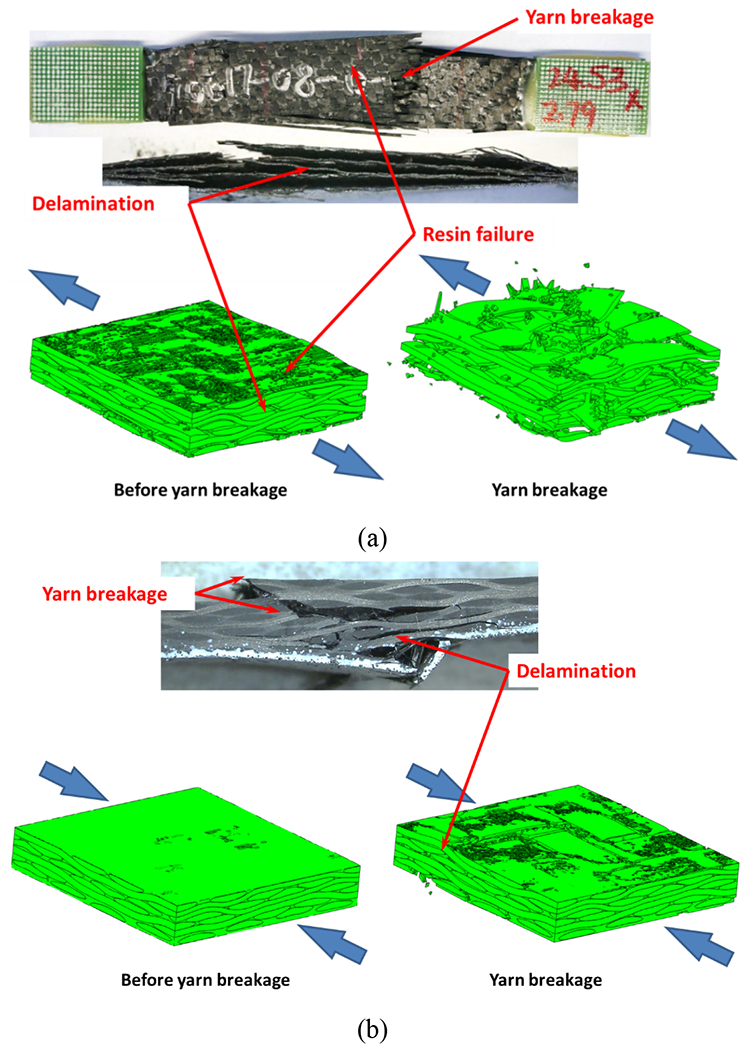
Final failure morphologies under tension (a) and compression (b) in warp direction.
4.2. Local stress distribution and Poisson’s ratio evolution
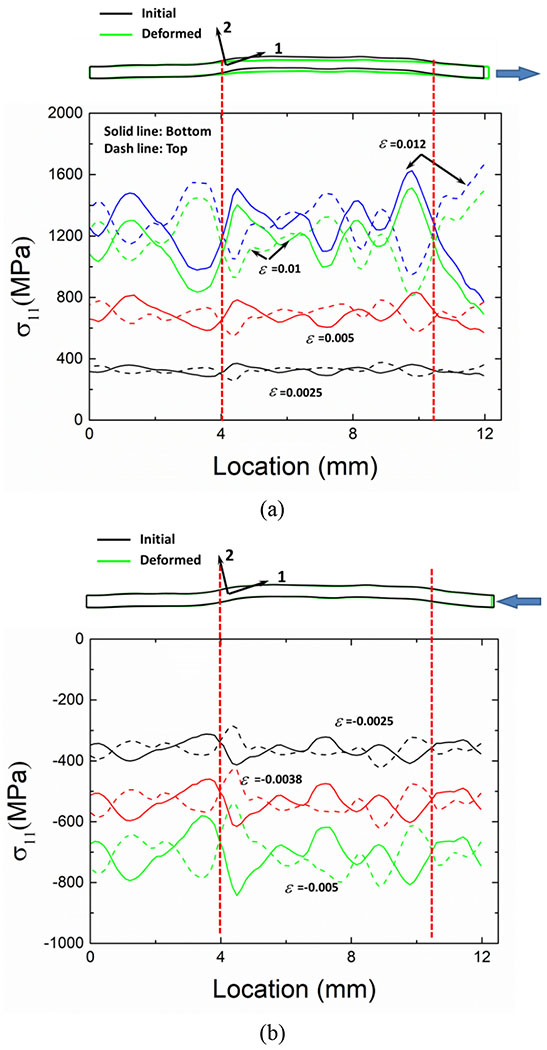
The complex geometries in woven fabric composite, especially the yarn crimp, will affect the stress and deformation states, and thus the damage initiation and morphology [3]. To better understand the geometry’s effect, local stress distributions of the top and bottom parts in one load-aligned yarn under both tension and compression are illustrated in Fig. 9. Remarkable undulation in the loading stress is observed which has also been observed in a previous study [19]. Even under small deformation (ε =0.0025), the stress variation has already developed in the thickness direction. Sharp evolution from peak to valley occurs near the region with high misorientations, as marked by dot lines. With higher level of strain, the stress difference between top and bottom surfaces becomes more significant. The stress under compression shows a similar trend as that under tension. The stress concentration further develops and finally leads to yarn breakage in these regions. This agrees with the experimental results, where the crimp ratio has a linear correlation with the uniaxial tension strength [45]. By comparing the yarn geometries before and after deformation, obvious yarn strengthening behavior is observed under tension, whereas little deformation is found under compression till failure.
Fig. 9.
Evolutions of stress distribution on the top and bottom surfaces in one typical load-aligned yarn: (a) tension and (b) compression along warp direction. All the stresses are presented under the local coordinate system.
Both tension and compression samples show a similar strain pattern where the difference in strains of longitudinal and transverse yarns creates a pattern of regularly alternating transversal bands, corresponding to high or low strain levels. Therefore, only the strain distribution under tension is shown here (Fig. 10). The uneven strain distribution becomes more significant with increasing tension strain. Once the sample enters the transition region, matrix resin failure starts on the surface.
Fig. 10.
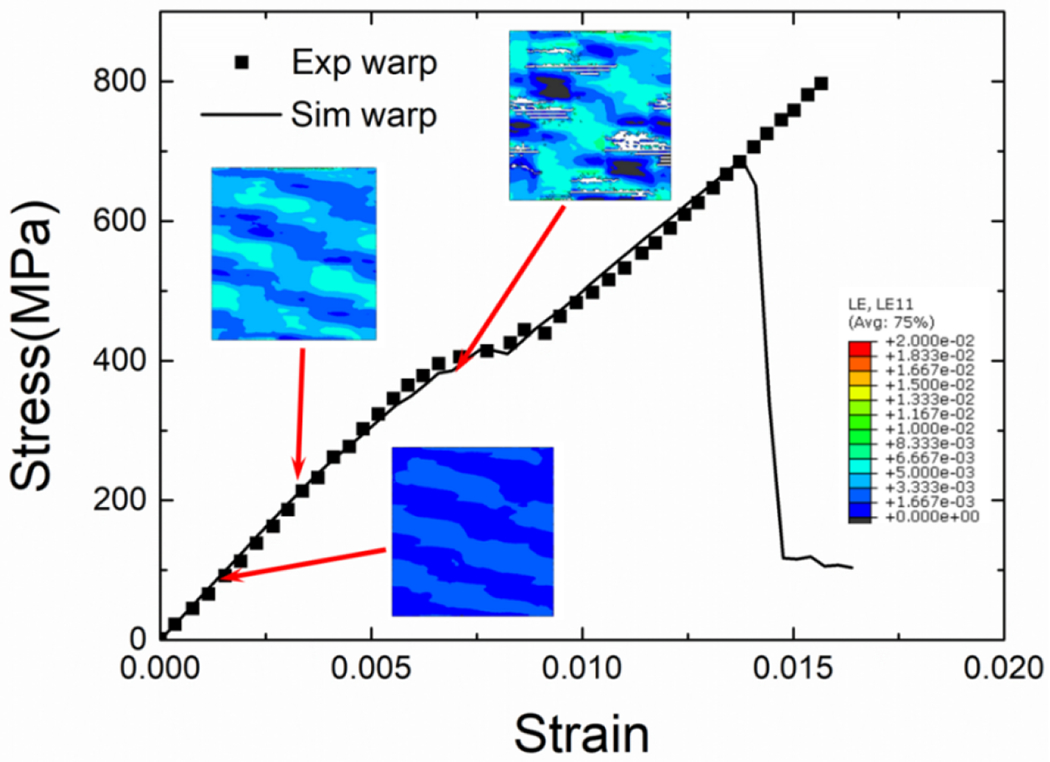
Predicted strain distribution evolution in the RVE model under warp direction tension.
Poisson’s ratio is another important factor representing material volume compressibility, which is calculated based on the strains along longitudinal and transverse directions as below.
| (20) |
Here, 〈…〉 represents averaging over the selected strain field from DIC measurement, which are 85 mm × 15 mm and 10 mm × 10 mm for tension and compression analysis, respectively. Note that Poisson’s ratio as an elastic constant is usually only measured in the elastic deformation region. In order to characterize the strain evolution in both directions and the possible damage here, nominal Poisson’s ratio is extended to a large deformation range. As reported in previous work [56], the Poisson’s ratio shows a considerably large scatter in experimental measurement. Here, the average value obtained from the experimental results is plotted, while the upper and lower limits are also presented as dot lines in Fig. 11.
Fig. 11.
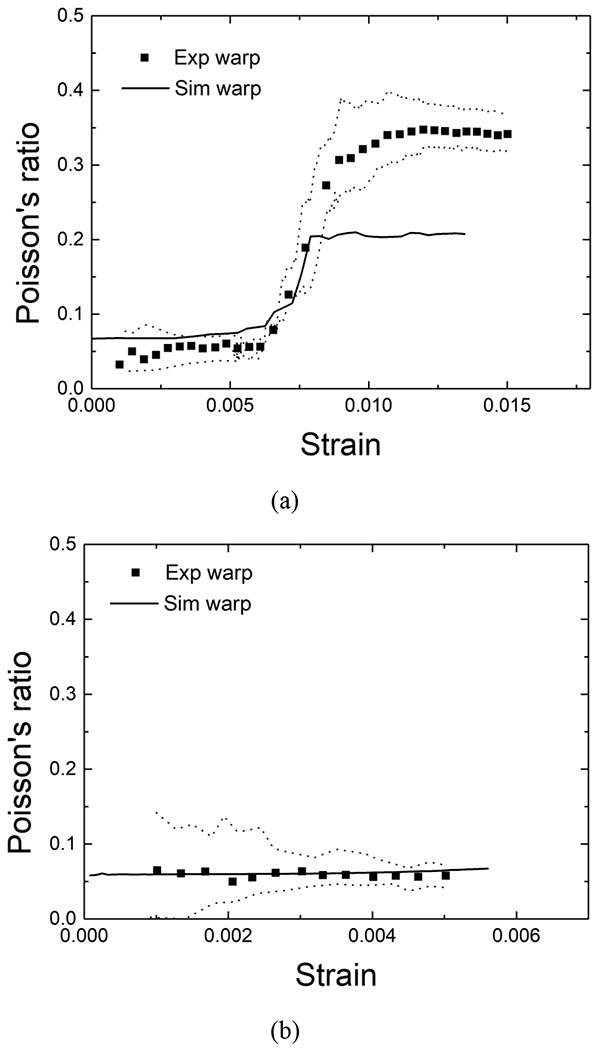
Evolutions of Poisson’s ratio in tension (a) and compression (b) along the warp direction. The dot lines represent the low and upper limits of measured values.
Fig. 11 compares the Poisson’s ratio evolution in experiment and simulation of warp direction tension and compression. At the initial deformation stage, the Poisson’s ratio keeps a relatively constant low value in both loading conditions. However, after a certain strain, the Poisson’s ratio shows a remarkable increase in tension. After this rapid increase stage, it keeps relatively constant again. In contrast, for the compression case, the Poisson’s ratio maintains a constantly low value until the final failure. In the elastic region, tension and compression samples have similar Poisson’s values. Fig. 11 also presents the predicted Poisson’s ratio under both loading conditions. The remarkable increase of Poisson’s ratio in tension is well captured by simulation, and the predicted quasi-constant evolution in compression is also consistent with the experimental result.
It has been reported that the Poisson’s ratio measured at surface layer strain may be different from the one measured at the inner ones, due to the different boundary conditions [11][58]. Here, the Poisson’s ratios calculated from four individual layers are compared in Fig. 12. As shown in Fig. 12(a), for the tension case, Poisson’s ratios in four layers are very close and have the same variation trend in the elastic region. It implies single-layer RVE should be able to predict the elastic property well even for the multiple layers composite with random stacking patterns. After damage initiation, divergence in Poisson’s ratios of various layers is observed. The clear transition appears earlier in top and bottom layers, of which Poisson’s ratio is larger, while Poisson’s ratio shows a more dramatic evolution but maintains at a lower level in inner layers. The different evolution trends are related to the constraint conditions. With constraints from only one side, the transverse yarns in surface layers can shrink more easily. In contrast, the inner layers have to overcome the constraints from both sides of the neighboring plies, and thus both the damage evolution and deformation in the transverse direction are reduced. Only when the constraints are reduced to a certain degree with damage accumulation, the inner layers will have significant shrinkage, which results in dramatic change in Poisson’s ratio.
Fig. 12.
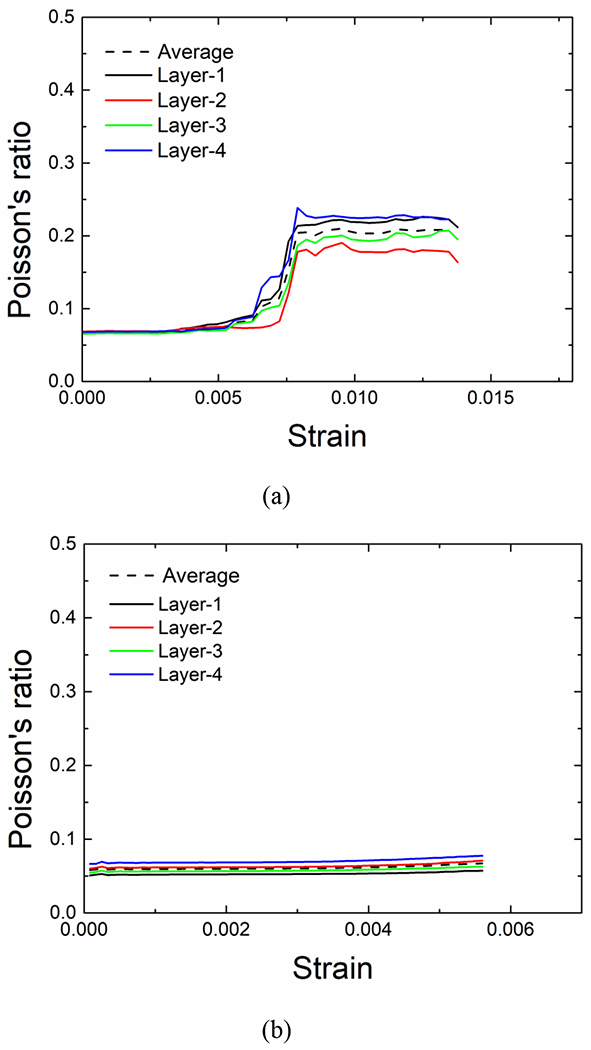
The evolution of Poisson’s ratio in each layer under tension (a) and compression (b).
A similar comparison is performed for the compression loading case, as shown in Fig. 12(b). Because there is no clear damage under compression, all four layers show a very similar trend up to the failure point and the small divergence may be related to the variations in geometries of different layers. Therefore, it can be concluded that single layer RVE is only sufficient to predict the elastic properties, but the multi-layer model, by incorporating the interactions between layers, is necessary to capture the complex large deformation more precisely.
It is noted that after the transition in tension, the simulation slightly underestimates the Poisson’s value compared with experiment results. This may arise from the strong constraints imposed in RVE model. Compared with 4 longitudinal yarns in one layer of the RVE model, there are only 8 yarns in one layer of the actual tensile specimen. The PBC is usually chosen to approximate a large (infinite) region by using the RVE. In current tension test, the width of tensile sample is only about twice of the RVE size, which means the PBC on the transverse yarns provides overestimated constraints and thus limits the deformation in transverse direction. Previous experimental analysis showed that the increase in Poisson’s ratio was determined by the easy shrinkage of transverse yarns after intensive damage [45]. Therefore, with stronger boundary constraints in transverse yarns, current RVE model predicts a lower transverse deformation strain and Poisson’s ratio.
4.3. Damage evolution
In previous sections, the stress-strain curve, strain/stress distribution and evolution of Poisson’s ratio are compared under in-plane tension and compression. All these properties are related to the damage evolutions closely, and different damage evolutions occur under either tension or compression. In this section, more details on damage evolutions are further investigated by using the RVE model.
The predicted damage in tension is compared with experiment at three strain levels, ~0.005, ~0.01 and ~0.015, which are roughly correspondent to the initiation of transition, the end of transition and approaching final failure, as shown in Fig. 13(a). Fig. 14 compares the detailed damage developments. In order to show the damage more clearly, cracks in experimental microscopic images are highlighted. Before the initiation of transition region (ε =~0.005), transverse yarn damage is clearly observed around the center of yarn and near the yarn edge (as marked by circles, A and B), which is well captured in the simulation. With tension strain increasing, damage develops rapidly in the transition region, and intensive transverse damage and resin damage appear, as shown in Fig. 14(b). The dramatic damage development leads to the transition region in stress-strain curve and the abrupt evolution in Poisson’s ratio. After the transition region till the final failure (ε =~0.015), both experiments and simulation show further damage developments, and the yarn straightening dominates the deformation.
Fig. 13.
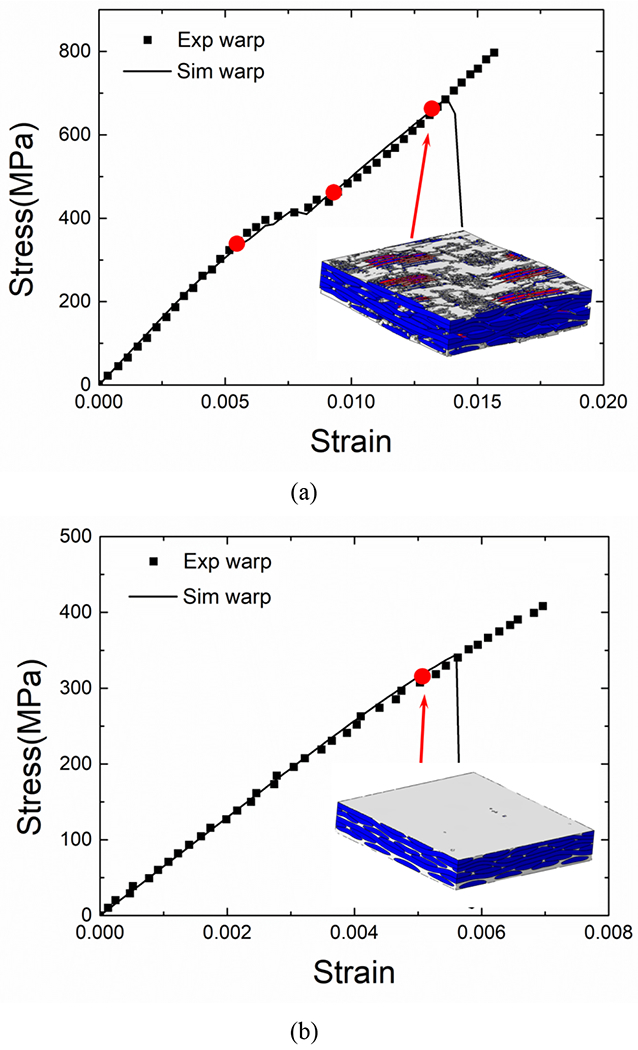
Overall damage evolutions and the specific strain levels for damage analysis under tension (a) and compression (b) along the warp direction.
Fig. 14.
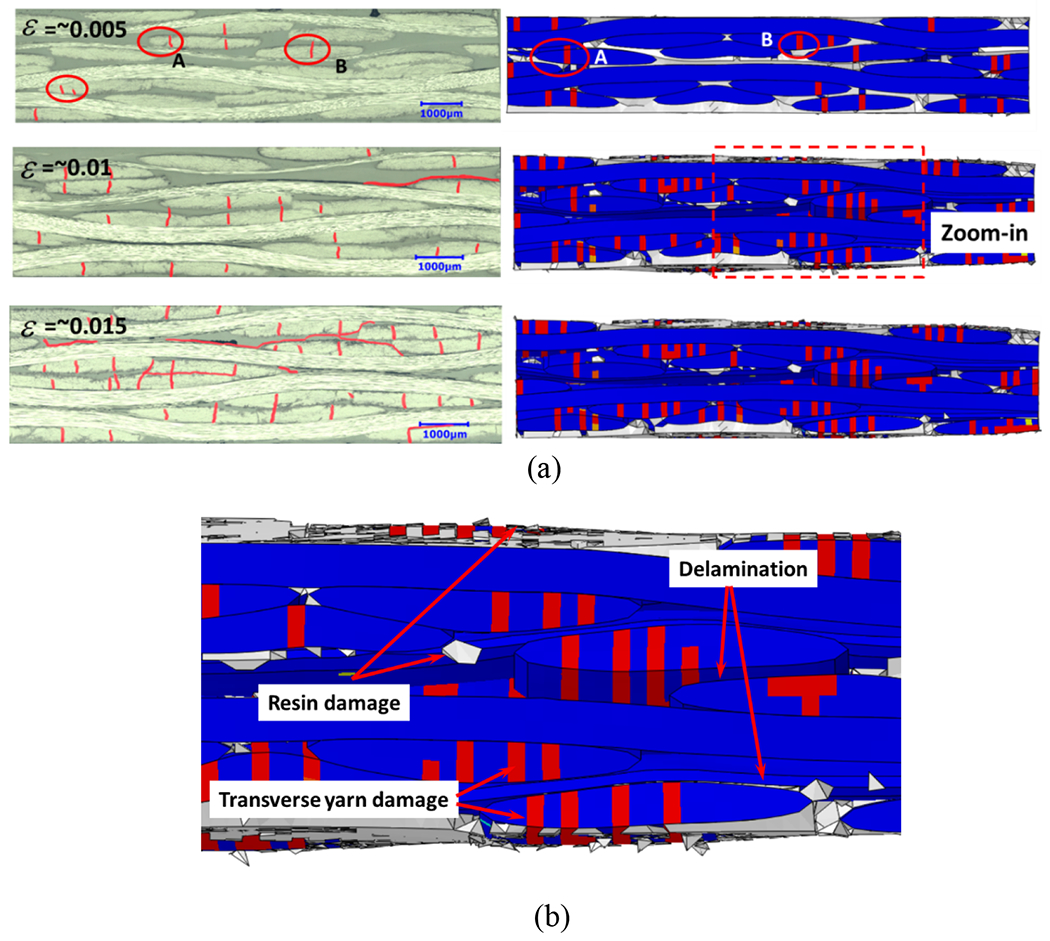
(a) Comparison of damage evolutions under tension in experiment and simulation, (b) A zoom-in part of the simulation result at ε =~0.01. The loading direction is horizontal.
The damage development under compression (ε =~0.005) is also illustrated in Fig. 15. Compared with the intensive damage before final failure in tension, the compression sample shows less damage before failure. Until the final yarn breakage, there is neither clear transverse yarn damage nor delamination. Only limit matrix damage appears on the surface and inside. Based on the previous stress analysis in load-aligned yarns, the crimp region shows higher stress concentration, which corresponds to the yarn breakage locations shown in Fig. 15(b). It also confirms that the delamination and transverse yarn damage observed in the ruptured compression samples are resulted from the catastrophic yarn breakage.
Fig. 15.
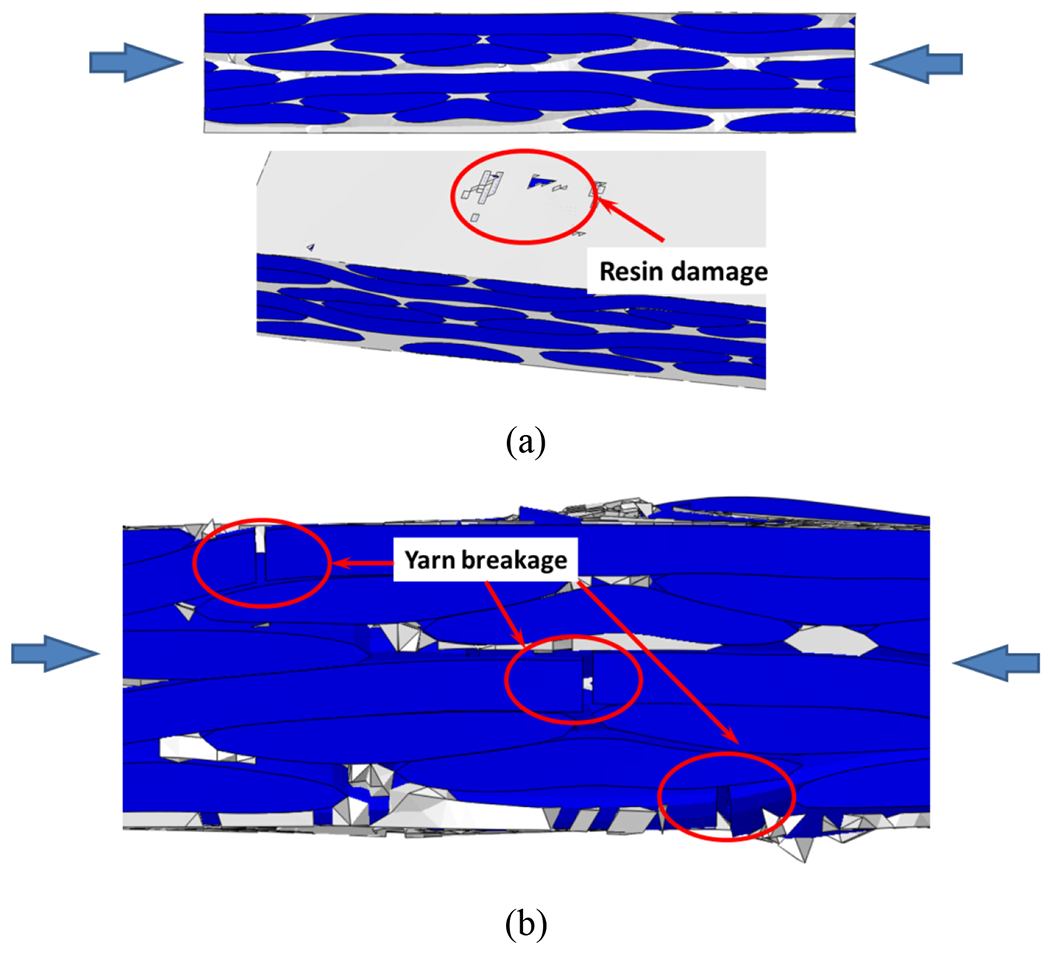
Damage evolution under compression: (a) before final failure and (b) after final failure.
In order to explore the correlation between nominal Poisson’s ratio and damage evolution under tension, the deformed shape of one typical transverse yarn is compared at the above mentioned three stages, as shown in Fig. 16. At 0.005 strain, there is no significant damage, and the transverse yarn shrinks uniformly. With intensive damage accumulation in the transition region (ε =~0.01), the strong constraints among yarns are released, and the transverse yarn curvature increases remarkably, leading to the crimp interchange and large Poisson’s ratio [45]. It is noted that the extremely large nominal Poisson’s ratio after damage is only adopted to characterize the deformation in two directions, which is more like a structural property rather than a material constant.
Fig. 16.
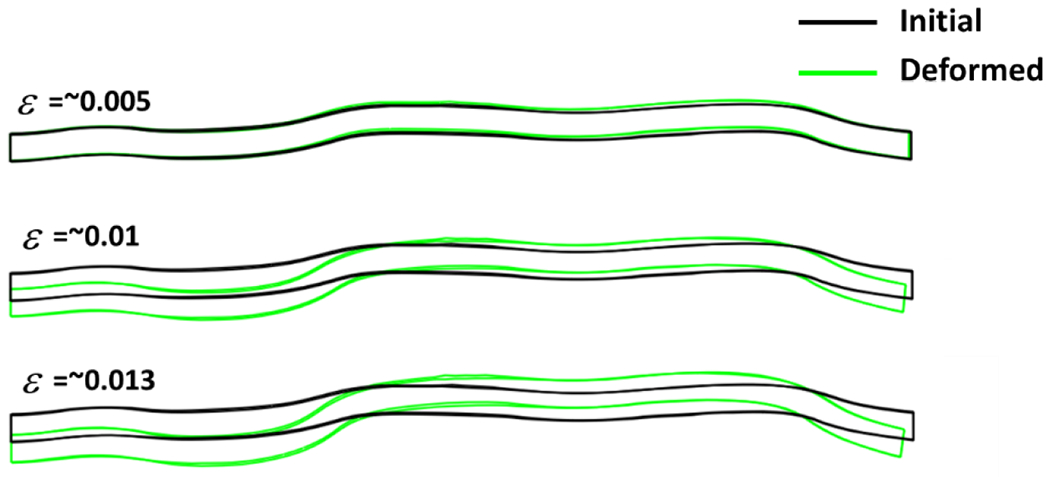
The deformation of one typical transverse yarn at three stages in tension: prior to the transition, at the end of the transition and prior to the failure. The deformation is scaled by 5× for better illustration.
In summary, the developed RVE model and computational approach present great advantages in describing the mesoscale features and detailed failure mechanisms in woven composites. Future work plans to incorporate more sophisticated features, such as the variations of fiber distribution and combination of various stacking patterns, and analyze their influence on the damage behaviors.
5. Conclusions
In this study, the mechanical properties and damage behaviors of a 2 × 2 twill carbon/epoxy composite under in-plane tension and compression are analyzed at mesoscale by both experiments and simulations. A new mesh generation method is developed to generate the multi-layer RVE model with realistic geometry, consistent mesh and high yarn volume fraction. Material constitutive laws considering comprehensive elasto-plastic-damage behaviors and tension-compression asymmetry are applied separately to the three components: yarn, resin matrix and interface. The mechanical behaviors and damage evolutions are studied under uniaxial tension and compression. The following conclusions are drawn based on this study.
(1) Geometry characteristics of woven fabric composites, especially the crimp ratio, have significant effects on the mechanical responses of fabric composites. A lower crimp ratio in warp direction leads to a higher modulus and strength under both tension and compression. A clear transition region in stress-strain curve under tension is observed, while the compressive stress-strain curve shows a quasi-linear behavior up to failure.
(2) Different evolution trends in Poisson’s ratio are observed during tensile and compressive deformation. Compared with a quasi-constant Poisson’s ratio under compression loading, a significant increase occurs under tension, which corresponds to the transition region in stress-strain curve. Intensive damage during tension leads to large transverse strain and abrupt change of Poisson’s ratio. Similar Poisson’s ratio is observed in different layers before intensive damage. In contrast to the inner layers, earlier transition and higher stable value of Poisson’s ratio appear in the surface layers due to the single-side constraint.
(3) Damage shows significant dependence on the loading condition. In uniaxial tension, damage in matrix resin and transverse yarn, and delamination initiate at small strain and accumulate gradually. The rapid damage evolution generates the transition in tension curve. In contrast, there is little damage observed in compression before final failure, corresponding to the quasi-linear stress-strain curve and relatively constant Poisson’s ratio.
Current work proposes a novel and effective computational approach to analyze the complex properties of woven fabric composite, which will be instrumental in future geometry design and optimization of such fabric composites.
Acknowledgments
The authors acknowledge support from the Ford Motor Company with funding from the U.S. Department of Energy’s Office of Energy Efficiency and Renewable Energy (EERE), under Award Number DE-EE0006867. Z. Meng would like to acknowledge startup funds from Clemson University and SC TRIMH support (P20 GM121342).
Appendix A. Single element test of yarn material constitutive law
The constitutive law for yarn material is implemented as an Abaqus VUMAT and is validated with one 3D element model under various loading conditions. As shown in Fig. A, five different loading conditions are tested with a single element model, including uniaxial tension/compression in fiber and transverse directions, and in-plane shear. In the current yarn material law, only the fiber tension and compression failure will cause element deletion. To avoid any numerical problem, the damage can only increase to a maximum value of 0.9 before the damaged element is deleted. As shown in the figures, the nonlinear behavior and tension-compression asymmetry in the transverse direction and in-plane shear are well modeled with current constitutive law.
Fig. A.
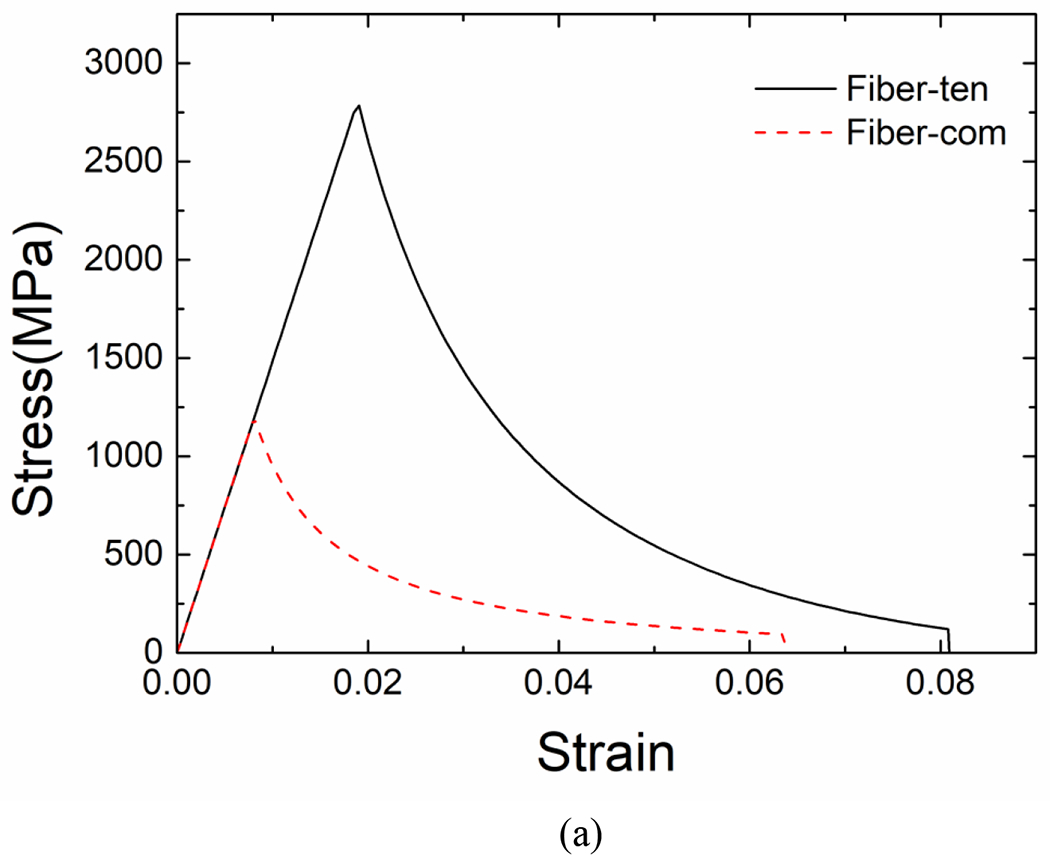
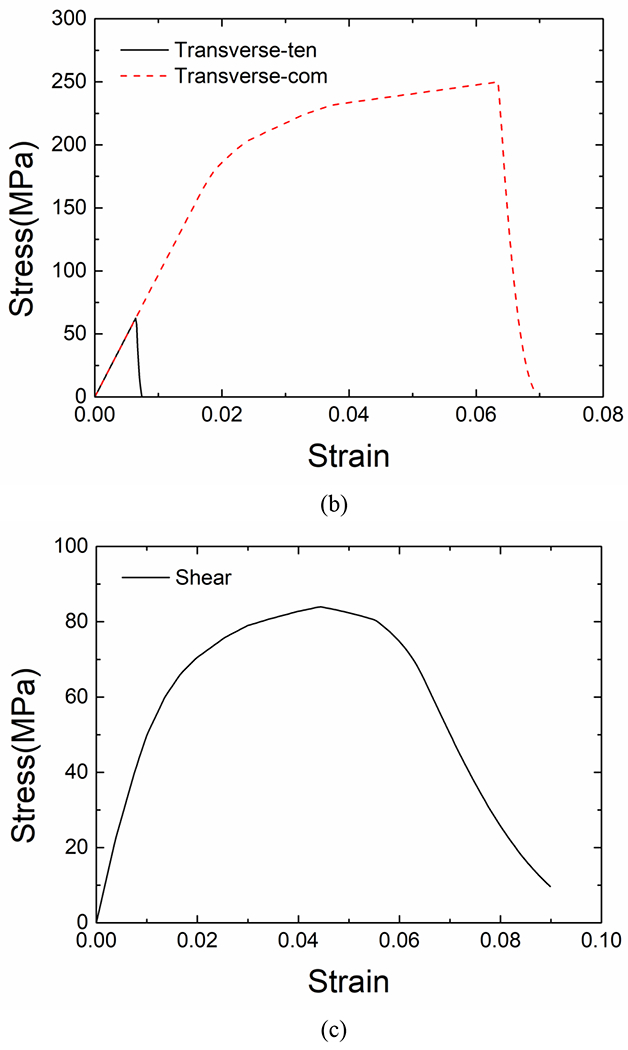
Single element simulations under various loading conditions: (a) fiber direction loading, (b) transverse direction loading and (c) in-plane shear.
Reference
- [1].Bishop SM, Curtis PT An Assessment of the potential of woven fabric reinforced plastics for aerospace use. RAE Tech Pap 1983; 83010 HMSO, London. [Google Scholar]
- [2].Gao F, Boniface L, Ogin SL, Smith PA, Greaves RP Damage accumulation in woven-fabric CFRP laminates under tensile loading: Part 1. Observations of damage accumulation. Compos Sci Technol 1999; 59(1): 123–136. [Google Scholar]
- [3].De Carvalho NV, Pinho ST, Robinson P An experimental study of failure initiation and propagation in 2D woven composites under compression. Compos Sci Technol 2011; 71(10): 1316–1325. [Google Scholar]
- [4].Daggumati S, De Baere I, Van Paepegem W, Degrieck J, Xu J, et al. Local damage in a 5-harness satin weave composite under static tension: Part I-Experimental analysis. Compos Sci Technol 2010; 70(13): 1926–1933. [Google Scholar]
- [5].Osada T, Nakai A, Hamada H Initial fracture behavior of satin woven fabric composites. Compos Struct 2003; 61(4): 333–339. [Google Scholar]
- [6].Nicoletto G, Riva E Failure mechanisms in twill-weave laminates: FEM predictions vs. experiments. Compos Part A: Appl Sci Manuf 2004; 35(7-8): 787–795. [Google Scholar]
- [7].Takeda T, Takano S, Shindo Y, Narita F Deformation and progressive failure behavior of woven-fabric-reinforced glass/epoxy composite laminates under tensile loading at cryogenic temperatures. Compos Sci Technol 2005; 65(11-12): 1691–1702. [Google Scholar]
- [8].Lomov SV, Bogdanovich AE, Ivanov DS, Mungalov D, Karahan M, Verpoest I A comparative study of tensile properties of non-crimp 3D orthogonal weave and multi-layer plain weave E-glass composites. Part 1: Materials, methods and principal results. Compos Part A: Appl Sci Manuf 2009; 40(8): 1134–1143. [Google Scholar]
- [9].Kim J, Shioya M, Kobayashi H, Kaneko J, Kido M Mechanical properties of woven laminates and felt composites using carbon fibers. Part 1: in-plane properties. Compos Sci Technol 2004; 64: 2221–2229. [Google Scholar]
- [10].Khan AS, Colak OU, Centala P Compressive failure strengths and modes of woven S2-glass reinforced polyester due to quasi-static and dynamic loading. Int J Plast 2002; 18: 1337–1357. [Google Scholar]
- [11].Rossol MN, Rajan VP, Zok FW Effects of weave architecture on mechanical response of 2D ceramic composites. Compos Part A: Appl Sci Manuf 2015; 74:141–152. [Google Scholar]
- [12].Lomov SV, Ivanov DS, Verpoest I, Zako M, Kurashiki T, Nakai H, Hirosawa S Meso-FE modelling of textile composites: Road map, data flow and algorithms. Compos Sci Technol 2007; 67(9): 1870–1891. [Google Scholar]
- [13].Doitrand A, Fagiano C, Irisarri FX, Hirsekorn M Comparison between voxel and consistent meso-scale models of woven composites. Compos Part A: Appl Sci Manuf 2015; 73: 143–154. [Google Scholar]
- [14].Liu Y, Straumit I, Vasiukov D, Lomov SV, Panier S Prediction of linear and non-linear behavior of 3D woven composite using mesoscopic voxel models reconstructed from X-ray micro-tomography. Compos Struct 2017; 179: 568–579. [Google Scholar]
- [15].Potter E, Pinho ST, Robinson P, Iannucci L, McMillan AJ Mesh generation and geometrical modelling of 3D woven composites with variable tow cross-sections. Comp Mater Sci 2012; 51(1): 103–111. [Google Scholar]
- [16].Barbero EJ, Lonetti P, Sikkil KK Finite element continuum damage modeling of plain weave reinforced composites. Compos Part B: Eng 2005; 37(2-3): 137–147. [Google Scholar]
- [17].Dai S, Cunningham PR Multi-scale damage modelling of 3D woven composites under uni-axial tension. Compos Struct 2016; 142: 298–312. [Google Scholar]
- [18].Daggumati S, Van Paepegem W, Degrieck J, Xu J, Lomov SV, Verpoest I Local damage in a 5-harness satin weave composite under static tension: Part II-Meso-FE modelling. Compos Sci Technol 2010; 70(13): 1934–1941. [Google Scholar]
- [19].De Carvalho NV, Pinho ST, Robinson P Numerical modelling of woven composites: Biaxial loading. Compos Part A: Appl Sci Manuf 2012; 43(8): 1326–1337. [Google Scholar]
- [20].Blacklock M, Shaw JH, Zok FW, Cox BN Virtual specimens for analyzing strain distributions in textile ceramic composites. Compos Part A: Appl Sci Manuf 2016; 85: 40–51. [Google Scholar]
- [21].Bednarcyk BA, Stier B, Simon JW, Reese S, Pineda EJ Meso-and micro-scale modeling of damage in plain weave composites. Compos Struct 2015; 121: 258–270. [Google Scholar]
- [22].Zhou Y, Lu Z, Yang Z Progressive damage analysis and strength prediction of 2D plain weave composites. Compos Part B: Eng 2013; 47: 220–229. [Google Scholar]
- [23].Obert E, Daghia F, Ladeveze P, Ballere L Micro and meso modeling of woven composites: Transverse cracking kinetics and homogenization. Compos Struct 2014; 117: 212–221. [Google Scholar]
- [24].Wang L, Zhao B, Wu J, Chen C, Zhou K Experimental and numerical investigation on mechanical behaviors of woven fabric composites under off-axial loading. Int J Mech Sci 2018; 141: 157–167. [Google Scholar]
- [25].Liu G, Zhang L, Guo L, Liao F, Zheng T, Zhong S Multi-scale progressive failure simulation of 3D woven composites under uniaxial tension. Compos Struct 2019; 208: 233–243. [Google Scholar]
- [26].Grail G, Hirsekorn M, Wendling A, Hivet G, Hambli R Consistent Finite Element mesh generation for meso-scale modeling of textile composites with preformed and compacted reinforcements. Compos Part A: Appl Sci Manuf 2013; 55: 143–151. [Google Scholar]
- [27].Doitrand A, Fagiano C, Chiaruttini V, Leroy FH, Mavel A, Hirsekorn M Experimental characterization and numerical modeling of damage at the mesoscopic scale of woven polymer matrix composites under quasi-static tensile loading. Compos Sci Technol 2015; 119: 1–11. [Google Scholar]
- [28].Doitrand A, Fagiano C, Hild F, Chiaruttini V, Mavel A, Hirsekorn M Mesoscale analysis of damage growth in woven composites. Compos Part A: Appl Sci Manuf 2017; 96: 77–88. [Google Scholar]
- [29].Wintiba B, Sonon B, Kamel KEM, Massart TJ An automated procedure for the generation and conformal discretization of 3D woven composites RVEs. Compos Struct 2017; 180: 955–971. [Google Scholar]
- [30].Rinaldi RG, Blacklock M, Bale H, Begley MR, Cox BN Generating virtual textile composite specimens using statistical data from micro-computed tomography: 3D tow representations. J Mech Phys Solids 2012; 60(8), 1561–1581. [Google Scholar]
- [31].Pierreux G, Van Hemelrijck D, Massart TJ Automated generation of 3D orthogonal woven composites RVEs including yarn cross-section variations. Compos Sci Technol 2019; 176: 90–102. [Google Scholar]
- [32].Pinho ST Modelling failure of laminated composites using physically-based failure models. Imperial College London, PHD thesis, 2005. [Google Scholar]
- [33].Bergmann T, Heimbs S, Maier M Mechanical properties and energy absorption capability of woven fabric composites under±45 off-axis tension. Compos Struct 2015; 125: 362–373. [Google Scholar]
- [34].Hinton MJ, Kaddour AS Triaxial test results for fibre-reinforced composites: The Second World-Wide Failure Exercise benchmark data. J Compos Mater 2013; 47(6-7): 653–678. [Google Scholar]
- [35].Yang L, Yan Y, Liu Y, Ran Z Microscopic failure mechanisms of fiber-reinforced polymer composites under transverse tension and compression. Compos Sci Technol 2012; 72(15): 1818–1825. [Google Scholar]
- [36].Gonzalez C, LLorca J Mechanical behavior of unidirectional fiber-reinforced polymers under transverse compression: microscopic mechanisms and modeling. Compos Sci Technol 2007; 67(13): 2795–2806. [Google Scholar]
- [37].Chen Y, Zhao Y, He C, Ai S, Lei H, Tang L, Fang D Yield and failure theory for unidirectional polymer-matrix composites. Compos Part B: Eng 2019; 164: 612–619. [Google Scholar]
- [38].Melro AR, Camanho PP, Pires FA, Pinho ST Micromechanical analysis of polymer composites reinforced by unidirectional fibres: Part I-Constitutive modelling. Int J Solids Struct 2013; 50(11-12): 1897–1905.4 [Google Scholar]
- [39].Sun Q, Meng Z, Zhou G, Lin SP, Kang H, Keten S, Su X Multi-scale computational analysis of unidirectional carbon fiber reinforced polymer composites under various loading conditions. Compos Struct 2018; 196: 30–43. [Google Scholar]
- [40].Tabiei A, Ivanov I Materially and geometrically non-linear woven composite micro-mechanical model with failure for finite element simulations. Int J Non-linear Mech 2004; 39(2), 175–188. [Google Scholar]
- [41].Melro AR, Camanho PP, Pires FA, Pinho ST Numerical simulation of the non-linear deformation of 5-harness satin weaves. Comp Mater Sci 2012; 61: 116–126. [Google Scholar]
- [42].Stier B, Simon JW, Reese S Comparing experimental results to a numerical meso-scale approach for woven fiber reinforced plastics. Compos Struct 2015; 122: 553–560. [Google Scholar]
- [43].Chen JF, Morozov EV, Shankar K A combined elastoplastic damage model for progressive failure analysis of composite materials and structures. Compos Struct 2012; 94(12): 3478–3489. [Google Scholar]
- [44].Wang X, Guan Z, Du S, Han G, Li Z (2020). An accurate and easy to implement method for predicting matrix crack and plasticity of composites with an efficient search algorithm for LaRC05 criterion. Compos Part A: Appl Sci Manuf 2020; 131: 105808. [Google Scholar]
- [45].Zhou G, Sun Q, Meng Z, Li D, Peng Y, Zeng D, Su X Experimental Investigation on the Effects of Fabric Architectures on Mechanical and Damage Behaviors of Carbon/Epoxy Woven Composites. Submitted. [DOI] [PMC free article] [PubMed] [Google Scholar]
- [46].Zhou G, Sun Q, Li D, Meng Z, Peng Y, Zeng D, Su X Effects of fabric architectures on mechanical and damage behaviors in carbon/epoxy woven composites under multiaxial stress states, Polym Test 2020; 90: 106657. [Google Scholar]
- [47].Sherburn M, Geometric and Mechanical Modelling of Textiles, The University of Nottingham, PHD thesis, 2007. [Google Scholar]
- [48].Doitrand A, Fagiano C, Leroy FH, Mavel A, Hirsekorn M On the influence of fabric layer shifts on the strain distributions in a multi-layer woven composite. Compos Struct 2016; 145: 15–25. [Google Scholar]
- [49].Liu C, Huang Y, Stout MG On the asymmetric yield surface of plastically orthotropic materials: a phenomenological study. Acta Mater 1997;45(6):2397–406. [Google Scholar]
- [50].Chen Z, Tang H, Shao Y, Sun Q, Zhou G, Li Y, ... Su X. Failure of chopped carbon fiber Sheet Molding Compound (SMC) composites under uniaxial tensile loading: Computational prediction and experimental analysis. Compos Part A: Appl Sci Manuf 2019; 118: 117–130. [Google Scholar]
- [51].Chang FK, Chang KY A progressive damage model for laminated composites containing stress concentrations. J of Comp Mater 1987; 21: 834–855. [Google Scholar]
- [52].Murakami S Mechanical modeling of material damage. J Appl Mech 1988; 55(2): 280–286. [Google Scholar]
- [53].Zako M, Uetsuji Y, Kurashiki T Finite element analysis of damaged woven fabric composite materials. Compos Sci Technol 2003; 63(3-4): 507–516. [Google Scholar]
- [54].Gutkin R, Pinho S, Robinson P, Curtis P A finite fracture mechanics formulation to predict fibre kinking and splitting in CFRP under combined longitudinal compression and in-plane shear, Mech Mater 2011; (11): 730–739. [Google Scholar]
- [55].Fenner J, Daniel IM Mixed-Mode and Mode-II fatigue crack growth in woven composites. Fract Fatigue Fail Damage Evol 2016; 8: 63–73. [Google Scholar]
- [56].Bogdanovich AE, Karahan M, Lomov SV, Verpoest I Quasi-static tensile behavior and damage of carbon/epoxy composite reinforced with 3D non-crimp orthogonal woven fabric. Mech Mater 2013; 62: 14–31. [Google Scholar]
- [57].Wehrkamp-Richter T, Hinterholzl R, Pinho ST Damage and failure of triaxial braided composites under multi-axial stress states. Compos Sci Technol 2017; 150: 32–44. [Google Scholar]
- [58].John S, Herszberg I, Coman F Longitudinal and transverse damage taxonomy in woven composite components. Compos Part B: Eng 2001; 32(8): 659–668. [Google Scholar]


