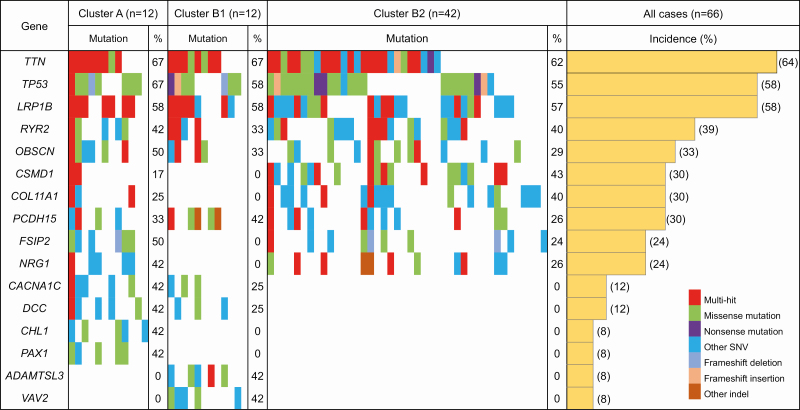
Figure 3.
Waterfall plot (oncoplot) of the distribution of SNVs (i.e. missense mutation, nonsense mutation and other SNV) and insertions/deletions (indels; i.e. frameshift deletion, frameshift insertion and other indel) of the top 16 genes for which mutations would potentially result in protein function disruption (accounting for more than 40% of the incidence of mutations in each cluster in Supplementary Table S7, available at Carcinogenesis Online) in each tumor (vertical row) belonging to Clusters A (n = 12), B1 (n = 12) and B2 (n = 42). Samples showing more than one type of mutation in the same gene are indicated as the ‘multi-hit’ type. In addition, the incidence (%) of gene mutations in each cluster and in all samples (n = 66) is shown.

