

Supplemental Digital Content is available in the text.
Keywords: atrial fibrillation, incidence, proportional hazards models, stroke, survival analysis
Abstract
Background:
Ignoring competing risks in time-to-event analyses can lead to biased risk estimates, particularly for elderly patients with multimorbidity. We aimed to demonstrate the impact of considering competing risks when estimating the cumulative incidence and risk of stroke among elderly atrial fibrillation patients.
Methods and Results:
Using linked administrative databases, we identified patients with atrial fibrillation aged ≥66 years discharged from hospital in ON, Canada between January 1, 2007, and March 31, 2011. We estimated the cumulative incidence of stroke hospitalization using the complement of the Kaplan–Meier function and the cumulative incidence function. This was repeated after stratifying the cohort by presence of prespecified comorbidities: chronic kidney disease, chronic obstructive pulmonary disease, cancer, or dementia. The full cohort was used to regress components of the CHA2DS2VASc (congestive heart failure, hypertension, age, diabetes mellitus, stroke, vascular disease, sex) score on the hazard of stroke hospitalization using the Fine-Gray and Cox methods. These models were subsequently used to predict the 5-year risk of stroke hospitalization. Among 136 156 patients, the median CHA2DS2VASc score was 4 and 84 728 patients (62.2%) had ≥1 prespecified comorbidity. The 5-year cumulative incidence of stroke was 5.4% (95% confidence interval, 5.3%–5.5%), whereas that of death without stroke was 48.8% (95% confidence interval, 48.5%–49.1%). The incidence of both events was overestimated by the Kaplan–Meier method; stroke incidence was overestimated by a relative factor of 39%. The degree of overestimation was larger among patients with non-CHA2DS2VASc comorbidity because of higher incidence of death without stroke. The Fine-Gray model demonstrated better calibration than the Cox model, which consistently overpredicted stroke incidence.
Conclusions:
The incidence of death without stroke was 9-fold higher than that of stroke, leading to biased estimates of stroke risk with traditional time-to-event methods. Statistical methods that appropriately account for competing risks should be used to mitigate this bias.
WHAT IS KNOWN
The complement of the Kaplan–Meier survival estimate is used frequently to estimate the cumulative incidence of outcomes over time.
Cox regression models are used frequently to study the association between patient characteristics and the hazard of an outcome and to develop risk prediction models.
WHAT THE STUDY ADDS
A competing risk is an event that precludes the occurrence of the primary event of interest.
Ignoring competing risks can lead to estimates of cumulative incidence (using the Kaplan–Meier complement) and predicted risk (using Cox regression) that are biased upwards.
Authors conducting time-to-event analyses should consider the question to be answered and appropriately account for competing risks.
Primary prevention of cardiovascular events frequently involves long-term (often lifelong) medication use based on the estimated risk for a given patient.1–4 The complement of the Kaplan–Meier survival is used frequently to estimate the cumulative incidence of events over time, whereas multivariable modeling using the Cox model is often used to estimate the effect of covariates on the hazard of an outcome. Risk prediction models based on Cox regression have become an extremely popular method to estimate a patient’s risk of future cardiovascular events based on the presence or absence of multiple risk factors in combination.1,2,5,6 This estimate of risk is then used to guide decisions about primary or secondary prevention of future cardiovascular events.1–4
Populations around the world have aged substantially7 since the concept of risk factors was first introduced in 1961.8 As a result, risk prediction models are commonly used today to guide primary prevention in patients who are older than the cohorts in which the risk scores were developed. Thoughtful clinicians recognize that preventative interventions are less likely to yield benefit in patients with a high risk of near-term death. For example, most clinicians would not initiate a statin for primary prevention of cardiovascular disease in a 70-year-old man with hypertension, dyslipidemia, and terminal lung cancer because of smoking. Despite the high estimate of cardiovascular risk, they would recognize that death from lung cancer would likely occur before the patient develops an atherosclerotic cardiovascular event. In this example, death from lung cancer is a competing risk that precludes the occurrence of a future cardiovascular event. This example of competing risks is intuitive for many clinicians.
There is less appreciation among clinicians that similar considerations may apply to the primary prevention of cardiovascular disease over the long term for elderly patients with multiple morbidities. A potential source of bias with time-to-event methods is that competing risks are ignored and not considered in the analysis. Although this practice may result in minimal bias when the incidence of the competing risk is small, the consequences of this practice become more serious as the incidence of the competing risk increases. Consider a cohort of 100 patients, of whom 1 patient dies of cardiovascular disease every year over 5 years. An intuitive description of their risk of cardiovascular death is that 5% will die of cardiovascular causes over the next 5 years. However, in a cohort of 100 patients with cancer, of whom 20 patients die of their malignancy every year for the first 4 years, the estimate of cardiovascular disease based on the complement of the Kaplan–Meier would be 12% (survival table provided in Appendix I in the Data Supplement). Accordingly, traditional methods of time-to-event analysis can overestimate the incidence of nonfatal events in the presence of competing risks.9,10 Rote application of interventions for primary prevention of cardiovascular disease based on these risk estimates may favor treatment of individuals from the lung cancer cohort rather than the healthier cohort.4
This highlights the importance of accounting for competing risks in time-to-event analyses, which requires careful consideration of the questions to be answered. These can be broadly classified into 2 categories. An analysis may be conducted to describe the etiologic relationship between risk factors and the outcome. An alternative objective would be to provide an estimate of the risk of the outcome based on the combination of risk factors applicable to a patient. Lau et al11 write that questions about etiologic relationships are better served by cause-specific hazard regression models. In contrast, the cumulative incidence function (CIF) is better suited to describe event incidence in the setting of competing risks. Moreover, prediction of the absolute event rate in the setting of competing risks may be better served by a Fine-Gray regression model which allows estimation of the effect of covariates on the CIF.9,11
In this article, we use the example of stroke in the setting of atrial fibrillation (AF) to demonstrate the potential degree of misestimation when failing to account for competing risks. We also show the potential implications for decision-making about primary prevention of stroke using risk models that do not account for competing risks. AF is a pertinent example as an increasingly prevalent disease that frequently affects elderly patients with multiple noncardiovascular morbidities.12 Among such patients, the occurrence of stroke after AF can be precluded by death from other causes. We aimed to demonstrate the impact of common comorbidities that may increase the risk of death with a less prominent effect on the risk of stroke. We hypothesized that the incidence of stroke is overestimated by the Kaplan–Meier method, and that the degree of overestimation will be higher among patients with a higher incidence of competing risks.
Based on the considerations described above, Cox regression methods may overestimate stroke incidence in AF patients.9 The CHA2DS2VASc (congestive heart failure, hypertension, age >75 years, diabetes, stroke, vascular disease, age >65 years, sex category)5 score is commonly used to guide anticoagulation in patients with AF. Most guidelines recommend anticoagulation for patients with CHA2DS2VASc scores >0 or 1,1,13,14 because the predicted stroke incidence is high enough to make the risk-benefit balance favorable.6,15,16 However, risk estimates that ignore competing risks may lead to anticoagulation of patients who do not have a high enough stroke risk to justify the risk, cost, and inconvenience of anticoagulation. We compared the performance of Cox and Fine-Gray regression models at predicting stroke risk using variables that constitute the CHA2DS2VASc score. We hypothesized that the predicted risk of stroke will be systematically overestimated by prediction models that use Cox regression rather than Fine-Gray regression.
Methods
Residents of ON, Canada receive universal healthcare via a single-payer system. This enables determination of all contact with physicians and hospitals using linked administrative databases. These data sets were linked using unique encoded identifiers and analyzed at the Institute for Clinical Evaluative Sciences. Using these data sets, we identified all patients aged ≥66 years but <105 years who were discharged alive from an acute care hospital in ON between January 1, 2007, and March 31, 2011. The data set from this study is held securely in coded form at the Institute for Clinical Evaluative Sciences. Although data sharing agreements prohibit Institute for Clinical Evaluative Sciences from making the data set publicly available, access may be granted to those who meet prespecified criteria for confidential access, available at http://www.ices.on.ca/DAS.
The index date was that of hospital discharge. In the event of multiple hospitalizations during the study period, we utilized the first hospitalization for the index event. Patients were determined to have AF based on a validated algorithm.17 We also identified prior diagnoses that comprise the CHA2DS2VASc score. Additionally, we identified diagnoses of chronic kidney disease (CKD), chronic obstructive pulmonary disease (COPD), cancer, and dementia to serve as examples of important noncardiovascular comorbidities not captured within the CHA2DS2VASc score that can increase the incidence of death before stroke. We collected these data using validated algorithms if available,18–27 or by surveillance for the appropriate diagnostic codes with a 5-year lookback window. Vascular disease was defined as the presence of ischemic heart disease or peripheral arterial disease. The primary outcome was hospitalization for stroke. The date of last follow-up was March 31, 2016.
Baseline characteristics were compared in univariable analyses based on status at the end of follow-up: stroke hospitalization, death without stroke hospitalization, or event-free survival. Continuous variables were summarized by determining mean and median values, with SD and interquartile ranges, respectively. Statistical significance of differences between categories was assessed using ANOVA and the Wilcoxon rank-sum test. Categorical variables were summarized using counts (with percentages), and differences between groups assessed using the χ2 method.
CIF curves were used to estimate the incidence of stroke and death without stroke in the overall cohort. For contrast, we also estimated event incidence using the complement of the Kaplan–Meier method. Both methods were also used to estimate incidence after the cohort was stratified based on the presence of at least one of the predetermined non-CHA2DS2VASc comorbidities, to demonstrate their impact on the overestimation of incidence by the Kaplan–Meier method. Additionally, we examined the cumulative incidence of stroke after the cohort has been divided based on patients’ CHA2DS2VASc score.
The full cohort was used to fit 2 regression models evaluating the association between component variables of the CHA2DS2VASc risk score with the hazard of hospitalization for stroke. The first was a Fine-Gray model that modeled the subdistribution hazard function; the second was a Cox model in which patients were censored at time of death if it was not preceded by a stroke (ie, a cause-specific hazard regression model). Both models included warfarin exposure in the year preceding hospitalization as a stratification variable, thus accounting for the impact of anticoagulation on stroke incidence. The analyses were repeated after adding the non-CHA2DS2VASc comorbidities to both models. The estimated regression coefficients for each variable were compared between the 2 models to examine whether there were differences in the direction of their association with the rate of stroke (derived from the Cox model) versus its incidence (derived from the Fine-Gray model).
We randomly selected 91 119 patients (2/3 of the original sample) for inclusion in a derivation sample, in which we fit 2 risk prediction models based on components of the CHA2DS2VASc score using Fine-Gray and Cox regression. The remaining patients (n=45 037, comprising 1/3 of the original sample) were used for model validation. We used the regression coefficients estimated in the derivation sample to assess the calibration of the 2 models by applying them to patients in the validation sample, thus obtaining a predicted probability of the occurrence of stroke within 5 years of the index date for each subject in the validation sample. Subjects in the validation sample were divided into deciles of predicted risk based on the model-based estimates of risk at 5 years. Within each of the 10 strata of predicted risk for each model, the mean model-based predicted probability of stroke was determined. Similarly, within each of these 10 strata per model, the observed incidence of stroke within 5 years was determined using the CIF. Calibration of each model was assessed by comparing the mean predicted probability of stroke with the observed probability of stroke.
Statistical analyses were performed using SAS version 9.4 (SAS Institute, Cary, NC). Statistical significance was defined by a 2-tailed P value <0.05. The use of data in this project was authorized under section 45 of Ontario’s Personal Health Information Protection Act, which does not require review by a Research Ethics Board.
Results
We identified 703 033 patients aged ≥66 years who were discharged alive from hospital, among whom 136 156 were documented to have AF. Baseline characteristics are detailed in Table 1. The median age of the AF cohort was 80 (interquartile range, 74–85) years, and 49.8% were female. The median CHA2DS2VASc score was 4 (interquartile range, 3–5); 98% of the cohort had a CHA2DS2VASc score >1. At least 1 non-CHA2DS2VASc comorbidity of interest (CKD, COPD, cancer, or dementia) was observed in 84 728 patients (62.2% of cohort). Only 50% of the AF cohort had filled a script for warfarin in the year before hospitalization, and 53% were dispensed warfarin within the first 90 days postdischarge. The presence of non-CHA2DS2VASc comorbidity was associated with lower anticoagulation rates before hospitalization (48.5% versus 52.5%, P<0.001) and after hospital discharge (49% versus 56%, P<0.001).
Table 1.
Baseline Characteristics of Patients Based on Status at the End of Follow-Up: Stroke, Death Without Stroke, or Event-Free Survival
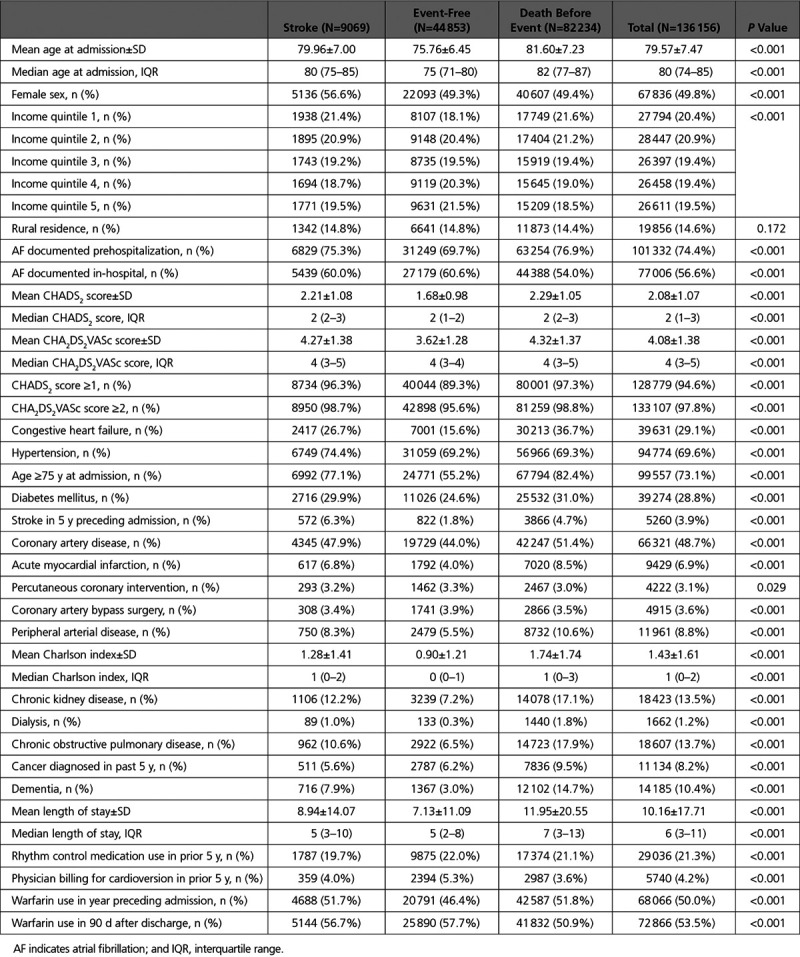
Over a median follow-up of 4.4 (interquartile range, 1.4–6.7) years, 9069 patients (6.7% of cohort) developed stroke, and 82 234 (60.4%) died without stroke. Univariable comparisons revealed that some components of the CHA2DS2VASc score were most common in patients developing stroke, but other components were most common among patients who died without stroke. Female sex, hypertension, and prior stroke were most common in patients developing stroke. However, age ≥75 years, congestive heart failure, diabetes mellitus, and vascular disease were most common in patients who died without stroke. Other comorbidities such as CKD, dialysis, COPD, cancer, and dementia were most common in patients who died before stroke.
Figure 1 demonstrates the CIF curves for stroke and for death without stroke in the full cohort, with overlaid dashed curves demonstrating event cumulative incidence as estimated by the complement of the Kaplan–Meier curve. At 5 years, the cumulative incidence of stroke was 5.4% (95% confidence interval [CI], 5.3%–5.5%), whereas that of death without stroke was 48.8% (95% CI, 48.5%–49.1%). In contrast, the Kaplan–Meier method overestimated the cumulative incidence of both events. The 5-year estimated stroke incidence using the Kaplan–Meier method was 7.5% (95% CI, 7.4%–7.7%), whereas that of death without stroke was 50.4% (95% CI, 50.1%–50.7%).
Figure 1.
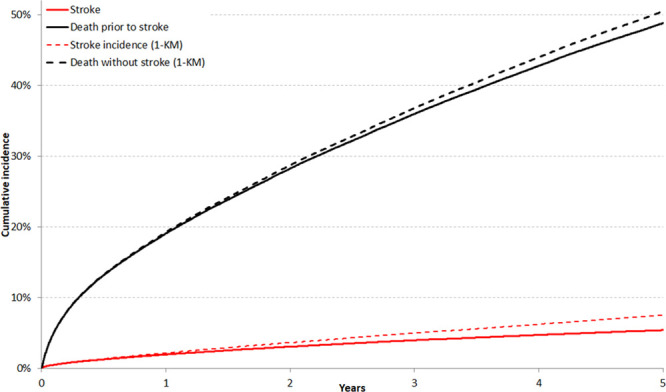
Incidence of stroke hospitalization compared with the competing risk (death before stroke hospitalization). Incidence of stroke or death without stroke, as estimated using cumulative incidence functions (solid line) or the complement of the Kaplan–Meier (KM) survival estimate (dashed line).
Stratified CIF analyses demonstrated that the presence of CKD, COPD, cancer, or dementia were associated with a higher risk of death without stroke, and a lower crude incidence of stroke compared with the absence of these comorbidities. Figure 2 plots the risk of stroke, as estimated by the CIF and the Kaplan–Meier complement, after the cohort had been stratified based on the presence of any of the prespecified non-CHA2DS2VASc comorbidities. Appendix II in the Data Supplement illustrates the risk of death without stroke in these patient strata. Among patients without any of these comorbidities, the 5-year cumulative incidence of stroke was 5.9% (95% CI, 5.7%–6.0%), whereas it was estimated to be 7.5% (95% CI, 7.3%–7.7%) using the Kaplan–Meier complement. In contrast, patients with at least 1 comorbidity had a 5-year stroke cumulative incidence of 4.6% (95% CI, 4.4%–4.8%), compared with an estimated incidence of 7.7% (95% CI, 7.4%–8.0%) with the Kaplan–Meier method. This was mediated by increased incidence of the competing risk: the 5-year cumulative incidence of death without stroke was 38.7% (95% CI, 38.4%–39.1%) in patients without CKD, COPD, cancer, or dementia, and 65.3% (95% CI, 64.8%–65.7%) in patients with at least one of these diagnoses.
Figure 2.
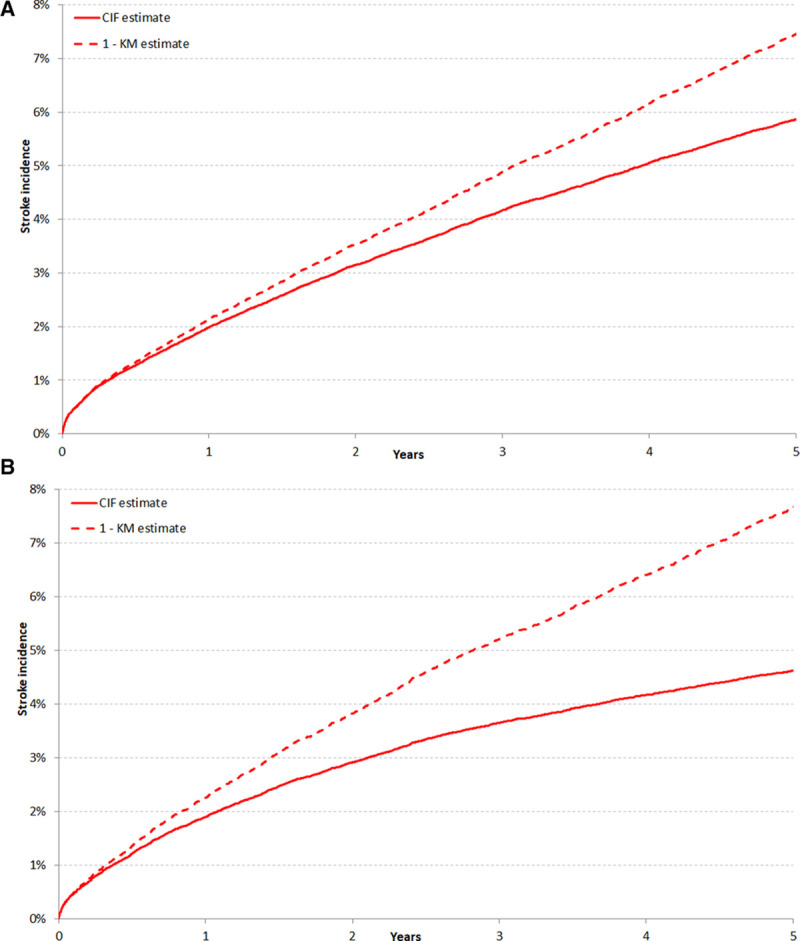
The impact of non-cardiovascular comorbidity on estimated stroke incidence with the Kaplan–Meier (KM) and cumulative incidence function (CIF) methods. Incidence of stroke, as estimated using cumulative incidence functions (solid line) or the complement of the KM survival estimate (dashed line) in patients without chronic kidney disease, chronic obstructive pulmonary disease, recent cancer, or dementia (A) and those with at least 1 of those comorbidities (B).
As expected, higher CHA2DS2VASc scores were associated with a higher incidence of stroke. This is illustrated in Figure 3, which plots the cumulative incidence of stroke after patients have been divided based on their CHA2DS2VASc score. However, higher CHA2DS2VASc scores were also associated with a higher incidence of death without stroke (illustrated in Appendix III in the Data Supplement). The 5-year cumulative incidence of death without stroke was 25.7% (95% CI, 24.1%–27.2%) among patients with a CHA2DS2VASc score of 1 and 49.3% (95% CI, 49.0%–49.6%) among patients with higher scores. This difference in competing risk translated into a greater overestimation of stroke incidence by the Kaplan–Meier method among patients with higher CHA2DS2VASc scores. The 5-year cumulative incidence of stroke was 2.6% (95% CI, 2.1%–3.2%) for patients with a CHA2DS2VASc score of 1 but was estimated at 3.1% (95% CI, 2.5%–3.8%) with the Kaplan–Meier complement. Among patients with higher CHA2DS2VASc scores, the 5-year cumulative incidence of stroke was 5.5% (95% CI, 5.3%–5.6%) but was estimated at 7.7% (95% CI, 7.5%–7.8%) with the Kaplan–Meier method.
Figure 3.
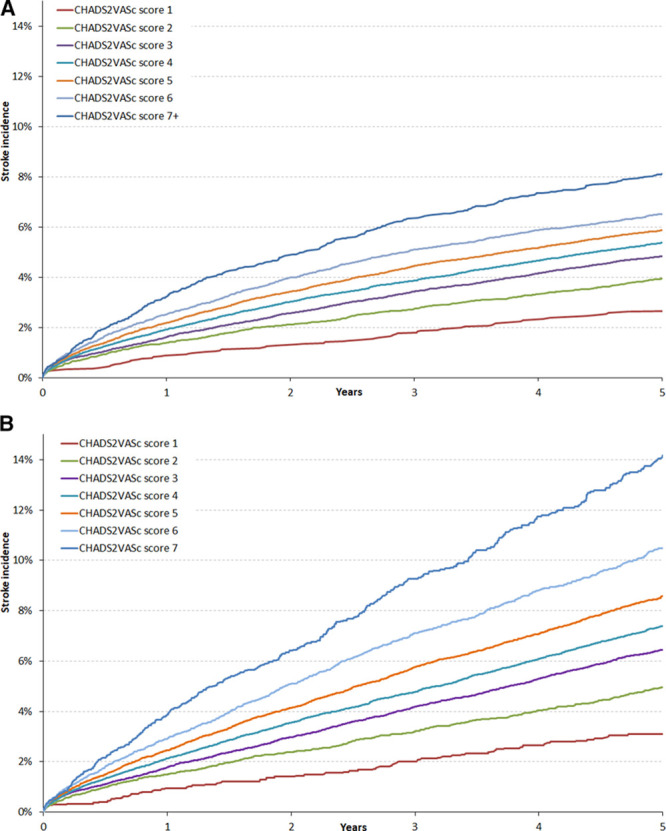
Estimated stroke risk at different levels of the CHA2DS2VASc score with the Kaplan–Meier and cumulative incidence function methods. Incidence of stroke, as estimated using the cumulative incidence function (A) or the complement of the Kaplan–Meier survival estimate (B), in patients with different congestive heart failure, hypertension, age, diabetes mellitus, stroke, vascular disease, sex (CHA2DS2VASc) scores. The cumulative incidence of death without stroke in patients at different levels of the CHA2DS2VASc score is illustrated in Appendix III in the Data Supplement.
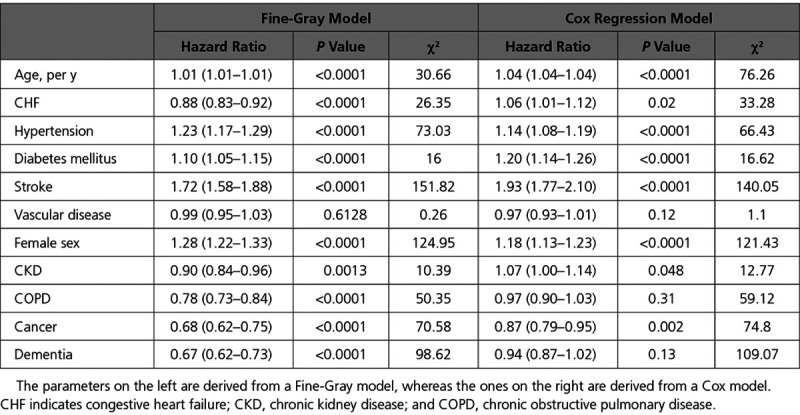
The results of the multivariable regression models using the variables included in the CHA2DS2VASc score are listed in Table 2. For most components of the CHA2DS2VASc score, the direction of the association was similar for the rate (Cox model) and incidence (Fine-Gray model) of stroke. However, the direction of the association differed for congestive heart failure, which was associated with higher rate of stroke but a lower stroke incidence. The results of the multivariable regression models using the CHA2DS2VASc variables plus additional comorbidities are listed in Table 3. The measures of association for non-CHA2DS2VASc comorbidities with the incidence versus the rate of stroke showed notable differences. This was most important for CKD, which was associated with an increased rate, but a decreased incidence, of stroke. COPD and dementia showed no significant relationship with stroke rate but were associated with a significantly lower stroke incidence. A recent cancer diagnosis was associated with both lower risk and rate of stroke.
Table 2.
Regression Models Assessing the Relationship Between Components of the CHA2DS2VASc Score and the Hazard of Hospitalization for Stroke
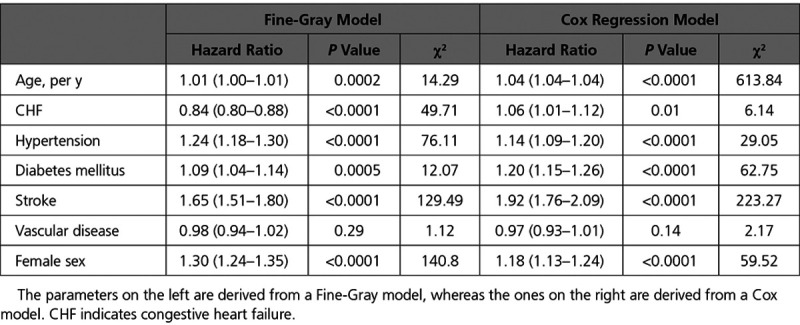
Table 3.
Regression Models Assessing the Relationship Between Components of the CHA2DS2VASc Score Plus Comorbidities of Interest With the Hazard of Hospitalization for Stroke
A comparison of the calibration of the Cox and Fine-Gray regression models utilizing the variables constituting the CHA2DS2VASc score is illustrated in Figure 4. The Cox regression model consistently overpredicted the incidence of stroke across all ranges of predicted risk, in contrast to the Fine-Gray model, which displayed better calibration.
Figure 4.
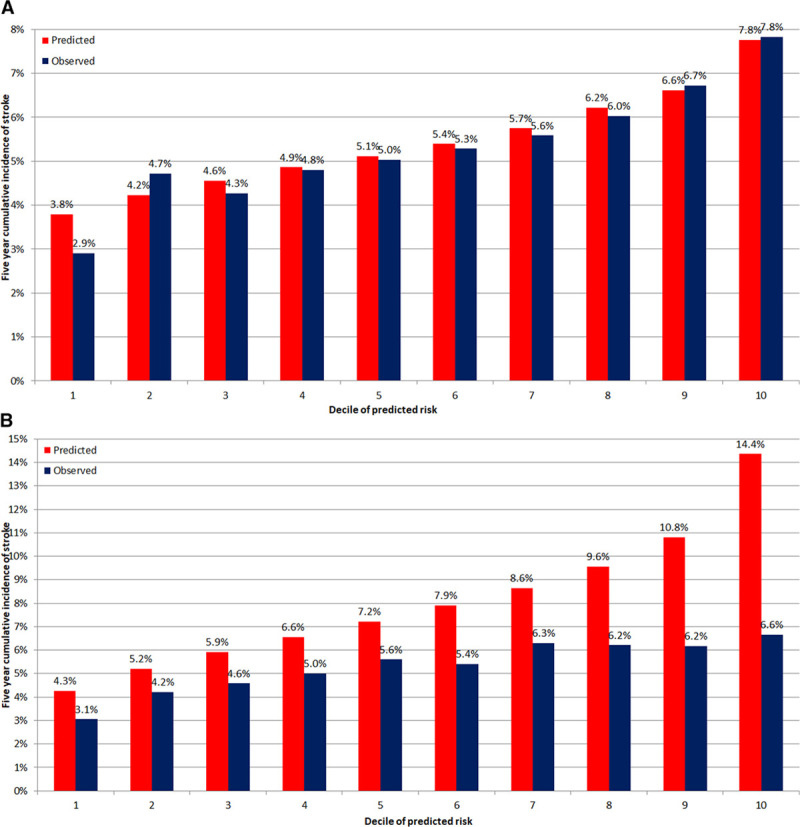
Calibration of models to predict stroke risk using Fine-Gray and Cox regression models.Predicted and observed incidence of stroke at 5 y by decile of predicted risk from Fine-Gray model (A) and Cox model (B).
Discussion
We used a population-based cohort of elderly patients with AF to illustrate the impact of competing risks on the estimated incidence of stroke. The incidence of the competing risk, death without stroke, was 9-fold higher than that of stroke. Accordingly, the incidence of stroke was consistently overpredicted by the Kaplan–Meier complement. In the overall cohort, the incidence of stroke was estimated at 7.5% (95% CI, 7.4%–7.7%) by the Kaplan–Meier method, compared with an estimated incidence of 5.4% (95% CI, 5.3%–5.5%) using the CIF. This translates to a 39% relative overestimation of stroke incidence by the Kaplan–Meier method. The degree of bias increased in strata with a higher incidence of the competing risk. Patients with non-CHA2DS2VASc comorbidity had a significantly lower 5-year incidence of stroke than their healthier counterparts in univariable comparisons (4.6%; 95% CI, 4.4%–4.8%; versus 5.9%; 95% CI, 5.7%–6.0%). However, the Kaplan–Meier method led to a different conclusion, predicting a comparable 5-year stroke incidence among patients with non-CHA2DS2VASc comorbidity (7.7%; 95% CI, 7.4%–8.0%) relative to those without one (7.5%; 95% CI, 7.3%–7.7%). Thus, the Kaplan–Meier method resulted in an estimated stroke incidence that was two-thirds higher than the CIF estimate among patients with comorbidities.
Interestingly, the upwards bias in stroke incidence was greater in patients with higher CHA2DS2VASc scores. This is because higher CHA2DS2VASc scores were associated with an increased incidence of competing risks. Accordingly, the relative overestimation in 5-year stroke incidence was 19% among patients with a score of 1, and 40% in patients with scores ≥2. Thus, the use of suboptimal statistical methods can lead to risk overestimation that is amplified among patients for whom anticoagulation would typically be recommended.1,13,14 This could lead to a falsely inflated expectation of benefit by biasing the risk-benefit assessment in favor of anticoagulation. Furthermore, the calibration of the Fine-Gray model was substantially better than that of the Cox model, which systematically overpredicted stroke risk in the validation cohort. This is an important limitation, particularly for diseases like AF which mostly affect older patients with a large burden of comorbidity.
An important observation is that the observed incidence of stroke in our cohort is lower than anticipated from the seminal studies reporting on the heightened risk of stroke in patients with AF.28–30 The 5-year cumulative incidence of stroke was only 5.4% (95% CI, 5.3%–5.5%), despite 47% of the cohort not filling a single prescription for warfarin in the 90 days after the index date. Based on a median CHADS2 score of 2 and CHA2DS2VASc score of 4, the expected stroke incidence is 4% per year.6 This is consistent with other reports on the decreasing risk of stroke associated with AF over the past 20 years, even among nonanticoagulated patients.31
The decreasing stroke incidence underscores the need to reappraise which patients are expected to benefit from long-term anticoagulation for primary stroke prevention because the net benefit of anticoagulation for stroke prophylaxis was demonstrated in patients with higher event rates. A meta-analysis of randomized controlled trials of warfarin in patients with AF reported 282 strokes over 8946 patient-years (≈3.1 per 100 patient-years) in antiplatelet-treated patients.15 A more recent meta-analysis demonstrating the benefit of direct oral anticoagulants relative to warfarin reported a stroke incidence of 3.8% over ≈2 years’ median follow-up in warfarin-treated patients.16 Anticoagulation is currently recommended for patients with a CHA2DS2VASc score of ≥2, which has been reported to be associated with a 2.2% annual stroke risk.6,32 The risk-benefit balance of anticoagulation for primary prevention of stroke in patients with AF becomes more ambiguous if the absolute stroke risk is lower. Accordingly, treatment decisions about stroke prophylaxis in elderly patients today may be better aided with risk estimates that more accurately reflect contemporary absolute risk. This would require consideration of the impact of competing risks, as illustrated with our data and that of others.10 Competing risks would also be a relevant consideration when predicting the risk of bleeding associated with anticoagulation.
Comparisons of the Cox and Fine-Gray regression models also provide interesting insights into how the impact of the stroke risk factors should be perceived. We should emphasize, however, that the magnitude of the hazard ratio from the cause-specific hazard model (ie, the Cox model) is not directly comparable to the magnitude of the effect of the covariate on the risk of stroke derived from the Fine-Gray model.33 Comparison of the 2 regression methods suggests that passive comorbidities which do not substantially affect stroke rate can decrease observed stroke incidence. This would be mediated by their association with a higher competing risk of death without stroke. Thus, it may be useful to account for comorbidities which may not directly affect the rate of the cardiovascular outcome of interest, but which could substantially increase the risk of death, thus reducing the observed incidence of the event of interest.
Our analysis has several limitations. Our study was not designed to generate a prediction model for stroke after AF. The outcome definition was limited to hospitalizations for stroke, and we did not identify strokes that led to death before hospital presentation. Moreover, our inclusion criteria stipulated age ≥66 years and a hospitalization event to select patients with a large burden of comorbidities and a higher risk of nonstroke death. This was done to illustrate the concepts of competing risks in a clinically meaningful manner. However, this means that our observations should not be extrapolated to younger, healthier patients with a lower risk of death.
Conclusions
The incidence of death without stroke was 9-fold higher than that of stroke in this cohort of patient with AF. Accordingly, there is the potential for substantial bias if competing risks are ignored when estimating the incidence and risk of stroke. Our analyses illustrate that the Kaplan–Meier survival functions and Cox regression models overestimate risk if used in a setting in which competing risks are incorrectly assumed to be absent. Where this assumption cannot be verified, one should account for competing risks in the manner most appropriate for the purpose of the analysis. The concepts we present here likely apply to other settings where the patient population is elderly or carries a high burden of comorbidity.
Sources of Funding
Funding for this project was provided by the Heart and Stroke Foundation of Canada. This study was supported by the Institute for Clinical Evaluative Sciences (ICES), which is funded by an annual grant from the Ontario Ministry of Health and Long-Term Care (MOHLTC). Dr Abdel-Qadir was supported by a Fellowship from the Canadian Institutes of Health Research and salary support from the University of Toronto Clinician-Scientist Training Program. Dr Lee is supported by a midcareer research award from the Heart and Stroke Foundation and the Ted Rogers Chair in Heart Function Outcomes. Dr Austin is supported in part by a Career Investigator Award from the Heart and Stroke Foundation. Dr Tu was supported by a Tier 1 Canada Research Chair in Health Services Research and an Eaton Scholar award. The opinions, results, and conclusions reported in this article are those of the authors and are independent from the funding sources. No endorsement by ICES or the Ontario MOHLTC is intended or should be inferred.
Disclosures
None.
Supplementary Material
Footnotes
The Data Supplement is available at http://circoutcomes.ahajournals.org/lookup/suppl/doi:10.1161/CIRCOUTCOMES.118.004580/-/DC1.
References
- 1.January CT, Wann LS, Alpert JS, Calkins H, Cigarroa JE, Cleveland JC, Jr, Conti JB, Ellinor PT, Ezekowitz MD, Field ME, Murray KT, Sacco RL, Stevenson WG, Tchou PJ, Tracy CM, Yancy CW ACC/AHA Task Force Members. 2014 AHA/ACC/HRS guideline for the management of patients with atrial fibrillation: a report of the American College of Cardiology/American Heart Association Task Force on practice guidelines and the Heart Rhythm Society. Circulation. 2014;130:e199–e267. doi: 10.1161/CIR.0000000000000041. doi: 10.1161/CIR.0000000000000041. [DOI] [PMC free article] [PubMed] [Google Scholar]
- 2.Stone NJ, Robinson JG, Lichtenstein AH, Bairey Merz CN, Blum CB, Eckel RH, Goldberg AC, Gordon D, Levy D, Lloyd-Jones DM, McBride P, Schwartz JS, Shero ST, Smith SC, Jr, Watson K, Wilson PW, Eddleman KM, Jarrett NM, LaBresh K, Nevo L, Wnek J, Anderson JL, Halperin JL, Albert NM, Bozkurt B, Brindis RG, Curtis LH, DeMets D, Hochman JS, Kovacs RJ, Ohman EM, Pressler SJ, Sellke FW, Shen WK, Smith SC, Jr, Tomaselli GF American College of Cardiology/American Heart Association Task Force on Practice Guidelines. 2013 ACC/AHA guideline on the treatment of blood cholesterol to reduce atherosclerotic cardiovascular risk in adults: a report of the American College of Cardiology/American Heart Association Task Force on Practice Guidelines. Circulation. 2014;129(25)(suppl 2):S1–S45. doi: 10.1161/01.cir.0000437738.63853.7a. doi: 10.1161/01.cir.0000437738.63853.7a. [DOI] [PubMed] [Google Scholar]
- 3.Piepoli MF, Hoes AW, Agewall S, Albus C, Brotons C, Catapano AL, Cooney MT, Corra U, Cosyns B, Deaton C, Graham I, Hall MS, Hobbs FD, Lochen ML, Lollgen H, Marques-Vidal P, Perk J, Prescott E, Redon J, Richter DJ, Sattar N, Smulders Y, Tiberi M, Bart van der Worp H, van Dis I, Verschuren WM. 2016 European Guidelines on cardiovascular disease prevention in clinical practice: the Sixth Joint Task Force of the European Society of Cardiology and Other Societies on Cardiovascular Disease Prevention in Clinical Practice (constituted by representatives of 10 societies and by invited experts) Developed with the special contribution of the European Association for Cardiovascular Prevention & Rehabilitation (EACPR). Atherosclerosis. 2016;252:207–274. doi: 10.1016/j.atherosclerosis.2016.05.037. [DOI] [PubMed] [Google Scholar]
- 4.Guyatt G, Rennie D, Meade MO, Cook DJ. Users’ Guides to the Medical Literature: Essentials of Evidence-Based Clinical Practice. 3 ed. New York, NY: McGraw-Hill Education; 2014. [Google Scholar]
- 5.Lip GY, Nieuwlaat R, Pisters R, Lane DA, Crijns HJ. Refining clinical risk stratification for predicting stroke and thromboembolism in atrial fibrillation using a novel risk factor-based approach: the euro heart survey on atrial fibrillation. Chest. 2010;137:263–272. doi: 10.1378/chest.09-1584. doi: 10.1378/chest.09-1584. [DOI] [PubMed] [Google Scholar]
- 6.Lip GY, Tse HF, Lane DA. Atrial fibrillation. Lancet. 2012;379:648–661. doi: 10.1016/S0140-6736(11)61514-6. doi: 10.1016/S0140-6736(11)61514-6. [DOI] [PubMed] [Google Scholar]
- 7.The World Bank. Population ages 65 and above (% of total). https://data.worldbank.org/indicator/SP.POP.65UP.TO.ZS. Accessed March 17, 2018.
- 8.Kannel WB, Dawber TR, Kagan A, Revotskie N, Stokes J., III. Factors of risk in the development of coronary heart disease–six year follow-up experience. The Framingham Study. Ann Intern Med. 1961;55:33–50. doi: 10.7326/0003-4819-55-1-33. [DOI] [PubMed] [Google Scholar]
- 9.Austin PC, Lee DS, Fine JP. Introduction to the analysis of survival data in the presence of competing risks. Circulation. 2016;133:601–609. doi: 10.1161/CIRCULATIONAHA.115.017719. doi: 10.1161/CIRCULATIONAHA.115.017719. [DOI] [PMC free article] [PubMed] [Google Scholar]
- 10.Wolbers M, Koller MT, Witteman JC, Steyerberg EW. Prognostic models with competing risks: methods and application to coronary risk prediction. Epidemiology. 2009;20:555–561. doi: 10.1097/EDE.0b013e3181a39056. doi: 10.1097/EDE.0b013e3181a39056. [DOI] [PubMed] [Google Scholar]
- 11.Lau B, Cole SR, Gange SJ. Competing risk regression models for epidemiologic data. Am J Epidemiol. 2009;170:244–256. doi: 10.1093/aje/kwp107. doi: 10.1093/aje/kwp107. [DOI] [PMC free article] [PubMed] [Google Scholar]
- 12.Feinberg WM, Blackshear JL, Laupacis A, Kronmal R, Hart RG. Prevalence, age distribution, and gender of patients with atrial fibrillation. Analysis and implications. Arch Intern Med. 1995;155:469–473. [PubMed] [Google Scholar]
- 13.Kirchhof P, Benussi S, Kotecha D, Ahlsson A, Atar D, Casadei B, Castella M, Diener HC, Heidbuchel H, Hendriks J, Hindricks G, Manolis AS, Oldgren J, Popescu BA, Schotten U, Van Putte B, Vardas P ESC Scientific Document Group. 2016 ESC Guidelines for the management of atrial fibrillation developed in collaboration with EACTS. Eur Heart J. 2016;37:2893–2962. doi: 10.1093/eurheartj/ehw210. doi: 10.1093/eurheartj/ehw210. [DOI] [PubMed] [Google Scholar]
- 14.Macle L, Cairns J, Leblanc K, Tsang T, Skanes A, Cox JL, Healey JS, Bell A, Pilote L, Andrade JG, Mitchell LB, Atzema C, Gladstone D, Sharma M, Verma S, Connolly S, Dorian P, Parkash R, Talajic M, Nattel S, Verma A CCS Atrial Fibrillation Guidelines Committee. 2016 Focused update of the Canadian Cardiovascular Society Guidelines for the management of atrial fibrillation. Can J Cardiol. 2016;32:1170–1185. doi: 10.1016/j.cjca.2016.07.591. doi: 10.1016/j.cjca.2016.07.591. [DOI] [PubMed] [Google Scholar]
- 15.Hart RG, Pearce LA, Aguilar MI. Meta-analysis: antithrombotic therapy to prevent stroke in patients who have nonvalvular atrial fibrillation. Ann Intern Med. 2007;146:857–867. doi: 10.7326/0003-4819-146-12-200706190-00007. [DOI] [PubMed] [Google Scholar]
- 16.Ruff CT, Giugliano RP, Braunwald E, Hoffman EB, Deenadayalu N, Ezekowitz MD, Camm AJ, Weitz JI, Lewis BS, Parkhomenko A, Yamashita T, Antman EM. Comparison of the efficacy and safety of new oral anticoagulants with warfarin in patients with atrial fibrillation: a meta-analysis of randomised trials. Lancet. 2014;383:955–962. doi: 10.1016/S0140-6736(13)62343-0. doi: 10.1016/S0140-6736(13)62343-0. [DOI] [PubMed] [Google Scholar]
- 17.Tu K, Nieuwlaat R, Cheng SY, Wing L, Ivers N, Atzema CL, Healey JS, Dorian P. Identifying patients with atrial fibrillation in administrative data. Can J Cardiol. 2016;32:1561–1565. doi: 10.1016/j.cjca.2016.06.006. doi: 10.1016/j.cjca.2016.06.006. [DOI] [PubMed] [Google Scholar]
- 18.Vermeulen MJ, Tu JV, Schull MJ. ICD-10 adaptations of the Ontario acute myocardial infarction mortality prediction rules performed as well as the original versions. J Clin Epidemiol. 2007;60:971–974. doi: 10.1016/j.jclinepi.2006.12.009. doi: 10.1016/j.jclinepi.2006.12.009. [DOI] [PubMed] [Google Scholar]
- 19.Tu K, Mitiku T, Lee DS, Guo H, Tu JV. Validation of physician billing and hospitalization data to identify patients with ischemic heart disease using data from the Electronic Medical Record Administrative data Linked Database (EMRALD). Can J Cardiol. 2010;26:e225–e228. doi: 10.1016/s0828-282x(10)70412-8. [DOI] [PMC free article] [PubMed] [Google Scholar]
- 20.Schultz SE, Rothwell DM, Chen Z, Tu K. Identifying cases of congestive heart failure from administrative data: a validation study using primary care patient records. Chronic Dis Inj Can. 2013;33:160–166. [PubMed] [Google Scholar]
- 21.Lee DS, Donovan L, Austin PC, Gong Y, Liu PP, Rouleau JL, Tu JV. Comparison of coding of heart failure and comorbidities in administrative and clinical data for use in outcomes research. Med Care. 2005;43:182–188. doi: 10.1097/00005650-200502000-00012. [DOI] [PubMed] [Google Scholar]
- 22.Atzema CL, Austin PC, Miller E, Chong AS, Yun L, Dorian P. A population-based description of atrial fibrillation in the emergency department, 2002 to 2010. Ann Emerg Med. 2013;62:570.e7–577.e7. doi: 10.1016/j.annemergmed.2013.06.005. doi: 10.1016/j.annemergmed.2013.06.005. [DOI] [PubMed] [Google Scholar]
- 23.Tu K, Campbell NR, Chen ZL, Cauch-Dudek KJ, McAlister FA. Accuracy of administrative databases in identifying patients with hypertension. Open Med. 2007;1:e18–e26. [PMC free article] [PubMed] [Google Scholar]
- 24.Hux JE, Ivis F, Flintoft V, Bica A. Diabetes in Ontario: determination of prevalence and incidence using a validated administrative data algorithm. Diabetes Care. 2002;25:512–516. doi: 10.2337/diacare.25.3.512. [DOI] [PubMed] [Google Scholar]
- 25.Fleet JL, Dixon SN, Shariff SZ, Quinn RR, Nash DM, Harel Z, Garg AX. Detecting chronic kidney disease in population-based administrative databases using an algorithm of hospital encounter and physician claim codes. BMC Nephrol. 2013;14:81. doi: 10.1186/1471-2369-14-81. doi: 10.1186/1471-2369-14-81. [DOI] [PMC free article] [PubMed] [Google Scholar]
- 26.Gershon AS, Warner L, Cascagnette P, Victor JC, To T. Lifetime risk of developing chronic obstructive pulmonary disease: a longitudinal population study. Lancet. 2011;378:991–996. doi: 10.1016/S0140-6736(11)60990-2. doi: 10.1016/S0140-6736(11)60990-2. [DOI] [PubMed] [Google Scholar]
- 27.Jaakkimainen RL, Bronskill SE, Tierney MC, Herrmann N, Green D, Young J, Ivers N, Butt D, Widdifield J, Tu K. Identification of physician- diagnosed Alzheimer’s disease and related dementias in population-based administrative data: a validation study using family physicians’electronic medical records. J Alzheimers Dis. 2016;54:337–349. doi: 10.3233/JAD-160105. doi: 10.3233/JAD-160105. [DOI] [PubMed] [Google Scholar]
- 28.Wolf PA, Abbott RD, Kannel WB. Atrial fibrillation as an independent risk factor for stroke: the Framingham Study. Stroke. 1991;22:983–988. doi: 10.1161/01.str.22.8.983. [DOI] [PubMed] [Google Scholar]
- 29.Wolf PA, Abbott RD, Kannel WB. Atrial fibrillation: a major contributor to stroke in the elderly. The Framingham Study. Arch Intern Med. 1987;147:1561–1564. [PubMed] [Google Scholar]
- 30.Wolf PA, Dawber TR, Thomas HE, Jr, Kannel WB. Epidemiologic assessment of chronic atrial fibrillation and risk of stroke: the Framingham study. Neurology. 1978;28:973–977. doi: 10.1212/wnl.28.10.973. [DOI] [PubMed] [Google Scholar]
- 31.Asinger RW, Shroff GR, Simegn MA, Herzog CA. Anticoagulation for nonvalvular atrial fibrillation: influence of epidemiologic trends and clinical practice patterns on risk stratification and net clinical benefit. Circ Cardiovasc Qual Outcomes. 2017;10:e003669. doi: 10.1161/CIRCOUTCOMES.117.003669. doi: 10.1161/CIRCOUTCOMES.117.003669. [DOI] [PubMed] [Google Scholar]
- 32.Gage BF, Waterman AD, Shannon W, Boechler M, Rich MW, Radford MJ. Validation of clinical classification schemes for predicting stroke: results from the National Registry of Atrial Fibrillation. JAMA. 2001;285:2864–2870. doi: 10.1001/jama.285.22.2864. [DOI] [PubMed] [Google Scholar]
- 33.Austin PC, Fine JP. Practical recommendations for reporting Fine-Gray model analyses for competing risk data. Stat Med. 2017;36:4391–4400. doi: 10.1002/sim.7501. doi: 10.1002/sim.7501. [DOI] [PMC free article] [PubMed] [Google Scholar]