Abstract
STUDY QUESTION
What is the optimal follicular tracking strategy for controlled ovarian stimulation (COS) in order to minimise face-to-face interactions?
SUMMARY ANSWER
As data from follicular tracking scans on Days 5, 6 or 7 of stimulation are the most useful to accurately predict trigger timing and risk of over-response, scans on these days should be prioritised if streamlined monitoring is necessary.
WHAT IS KNOWN ALREADY
British Fertility Society guidance for centres restarting ART following coronavirus disease 2019 (COVID-19) pandemic-related shutdowns recommends reducing the number of patient visits for monitoring during COS. Current evidence on optimal monitoring during ovarian stimulation is sparse, and protocols vary significantly. Small studies of simplifying IVF therapy by minimising monitoring have reported no adverse effects on outcomes, including live birth rate. There are opportunities to learn from the adaptations necessary during these extraordinary times to improve the efficiency of IVF care in the longer term.
STUDY DESIGN, SIZE, DURATION
A retrospective database analysis of 9294 ultrasound scans performed during monitoring of 2322 IVF cycles undertaken by 1875 women in a single centre was performed. The primary objective was to identify when in the IVF cycle the data obtained from ultrasound are most predictive of both oocyte maturation trigger timing and an over-response to stimulation. If a reduced frequency of clinic visits is needed due to COVID-19 precautions, prioritising attendance for monitoring scans on the most predictive cycle days may be prudent.
PARTICIPANTS/MATERIALS, SETTING, METHODS
The study comprised anonymised retrospective database analysis of IVF/ICSI cycles at a tertiary referral IVF centre. Machine learning models are used in combining demographic and follicular tracking data to predict cycle oocyte maturation trigger timing and over-response. The primary outcome was the day or days in cycle from which scan data yield optimal model prediction performance statistics. The model for predicting trigger day uses patient age, number of follicles at baseline scan and follicle count by size for the current scan. The model to predict over-response uses age and number of follicles of a given size.
MAIN RESULTS AND THE ROLE OF CHANCE
The earliest cycle day for which our model has high accuracy to predict both trigger day and risk of over-response is stimulation Day 5. The Day 5 model to predict trigger date has a mean squared error 2.16 ± 0.12 and to predict over-response an area under the receiver operating characteristic curve 0.91 ± 0.01.
LIMITATIONS, REASONS FOR CAUTION
This is a retrospective single-centre study and the results may not be generalisable to centres using different treatment protocols. The results are derived from modelling, and further clinical validation studies will verify the accuracy of the model.
WIDER IMPLICATIONS OF THE FINDINGS
Follicular tracking starting at Day 5 of stimulation may help to streamline the amount of monitoring required in COS. Previous small studies have shown that minimal monitoring protocols did not adversely impact outcomes. If IVF can safely be made less onerous on the clinic’s resources and patient’s time, without compromising success, this could help to reduce burden-related treatment drop-out.
STUDY FUNDING/COMPETING INTEREST(S)
F.P.C. acknowledges funding from the NIHR Applied Research Collaboration Wessex. The authors declare they have no competing interests in relation to this work.
TRIAL REGISTRATION NUMBER
N/A.
Keywords: ultrasound, oocyte maturation, trigger, ovarian stimulation, over-response, machine learning
Introduction
Traditionally, IVF cycles involve patients attending repeat transvaginal ultrasound monitoring for follicular tracking during controlled ovarian stimulation (COS). There are two crucial reasons for monitoring during COS: firstly to facilitate clinical decision-making on the most appropriate timing to trigger final follicular maturation in order to maximise the number of mature oocytes and thus chance of live birth; and secondly, as part of a continued risk assessment of over-response. Over-response puts patients at higher risk of ovarian hyperstimulation syndrome (OHSS), a rare iatrogenic complication of COS (Griesinger et al., 2016). OHSS was the most common reported complication of ART in the 2015 European registry data with 2167 cases, an incidence rate of 0.44% (De Geyter, 2020). In 2015–2016, 98 severe or critical OHSS cases were reported to the UK, The Human Fertilisation and Embryology Authority. Adequate monitoring is clearly required for patients triaged as high risk for this potentially life-threatening condition. Indeed, the OHSS working group consensus statement recommends ‘frequent vaginal ultrasonography and/or serum oestradiol measurements’ for those identified to be at higher risk (Humaidan et al., 2016).
However, frequent monitoring visits are time-consuming, costly and can be disruptive to patients’ daily routines, adding to both the practical and psychological burden of IVF. In a survey across four European countries, 21–36% of patients reported that difficulty fitting fertility treatments into their life and the need for repeated time off work are barriers to seeking treatment (Domar et al., 2012). Frequent monitoring is also a time-intensive use of clinic staff resources. The timing and frequency of follicular monitoring in COS are traditionally based on the clinical culture and individual preference and, in reality, the evidence for best practice is sparse. A 2014 systematic review of ultrasound for monitoring COS concluded that more studies evaluating the optimal procedure for monitoring COS are needed, with a requirement for these to have live birth as the primary outcome and to be adequately powered (Kwan et al., 2014). Aiming to reduce the burden of attending for repeated scans, some clinics have trialled home sonography as an alternative, but this technique has not been widely adopted (Gerris et al., 2014, 2016). Simplification of IVF therapy by minimal monitoring has been reported to have no adverse effects on treatment outcome and the incidence of OHSS, although these studies were small and often used patient selection criteria and fixed-dose protocols (Abdalla et al., 1989; Tan, 1994; Wikland et al., 1994; Roest et al., 1995; Hurst et al., 2002).
The coronavirus disease 2019 (COVID-19) pandemic requires fertility centres to maximise the safety of both patients and staff during fertility treatment. This involves not only risk assessment and testing but also minimisation of in-person clinic visits where possible to reduce encounters and thus reduce the chance of severe acute respiratory syndrome coronavirus 2 (SARS-CoV-2) viral transmission. The British Fertility Society guidance recommends reducing the number of patient visits for monitoring during COS, particularly in those with a normal ovarian reserve. However, the optimal follicular tracking strategy for COS in order to minimise face-to-face interactions is unknown. The aim of this study is to inform centres contemplating monitoring protocol adjustment to minimise face-to-face interactions in the era of social distancing, whilst SARS-CoV-2 remains prevalent in their community. We use machine learning methods to predict the usefulness of each day of COS monitoring in assessing the timing of final follicular trigger and the risk of over-response. This evaluation aims to help streamline IVF scan schedules, whilst retaining the accurate predictive power needed for optimal, safe and personalised care.
Materials and methods
Fully anonymised retrospective electronic data (IDEAS™, Mellowood Medical, Toronto, Canada) on IVF and ICSI cycles were extracted from a tertiary IVF centre in the South of England, UK from 1 January 2011 to 30 November 2019. Fertility preservation, egg freezing and altruistic egg donation cycles were excluded.
The usual practice for this centre includes a baseline transvaginal ultrasound scan on menstrual cycle Days 2–4, with COS commencing subsequent to the baseline scan. Follicle tracking scans are commenced after 3–5 days of stimulation and continued every other weekday until the maturation trigger is administered. GnRH antagonist was initiated on a fixed-day protocol at Day 5 of stimulation. Transvaginal oocyte collection is scheduled 36 h following the trigger administration and performed under sedation.
Detailed patient data, including demographics, cycle characteristics, antral follicle count (AFC), diagnosis, anti-Müllerian hormone (AMH, where available) and all follicle measurements taken during follicular tracking, medications and dosages used for stimulation, the type of oocyte maturation trigger and time/date of trigger administration, outcome data (number of eggs collected, number of embryos frozen, live birth from fresh cycle, cumulative live birth from embryos created from this cycle) for each stimulation cycle, were extracted from the database. Descriptive statistics were analysed for all variables in dataset.
Outcomes
The primary outcome was the machine-learnt model’s performance in predicting the day of trigger administration for predictions performed on each day of an IVF cycle and a separate model’s performance in predicting if the patient had over-responded and hence was at higher risk of OHSS. High response was defined as per the ESHRE ovarian stimulation guideline as >18 follicles ≥11 mm in size on day of oocyte maturation trigger and/or 18 oocytes collected (ESHRE, 2020). This definition was used as it has been shown to be associated with a significant risk increase in OHSS (Griesinger et al., 2016).
Machine learning methods
To predict the day of trigger administration, we used Random Forest Regressors, as implemented in the sci-kit learn Python library (Pedregosa et al., 2011). These regressors are ensembles of decision tree regressors, which perform a set of (if-then-else) decisions to predict a trigger day for a given instance. For an unseen instance, the predicted trigger day is equal to the mean trigger day of all training instances assigned to the relevant leaf of the tree. Decision rules are learnt by the model (as opposed to being explicitly programmed) by selecting decisions that minimise the mean squared error (MSE) between the predicted trigger day and the actual trigger day for all instances involved in a given decision during model training. The final Random Forest Regressor is the mean of the predicted trigger day as predicted by 100 individual decision tree regressors, where variance is introduced between these individual regressors by bootstrapping the training data. To evaluate the performance of our models, we used 5-fold cross-validation at the treatment cycle level. In this validation scheme, the data are randomly portioned into five equal size subsets. The model is trained on four of the subsets and evaluated on the fifth (out-of-fold) subset, this is performed over the five possible permutations of the subsets, yielding five estimates of the models’ generalisation performance. The metric used for evaluating the models’ generalisation performance is the MSE between the predicted trigger day and the observed trigger day. Ultimately, for each model, we report the mean MSE across the five subsets and the associated standard error. Hyperparameter tuning was not performed to ensure we did not overfit the validation set, and reasonable model parameters were used (i.e. no restriction on tree depth). Models were constructed for each cycle day using the results of individual ultrasound scans performed on the given day and combined with demographic data. Missing values (<1% of patients age was not recorded in the database) were imputed using mean imputation within respective cross-validation folds.
For comparison, we created a baseline trigger administration day predictor, which predicts, for a given cycle day, the mean trigger day for all cycles in the training set which had a scan on the given cycle day.
To construct models to predict the risk of OHSS, we used the same validation procedure but framed the problem as a binary classification problem (with the target described in ‘Outcomes’). For predictive models, we used Random Forest Classifiers, an ensemble of 100 decision tree classifiers where the outcome is now the probability that the instance belongs to a given class (patient at risk of OHSS or not), which is determined by the class fraction in the relevant leaf of the tree. The metric used for evaluating the model performance is the area under the receiver operating characteristic curve (AUROC).
Ethical approval
Ethical approval for this study was obtained from the University of Southampton ERGO II and NHS REC (IRAS Project ID: 275218). A data protection impact assessment was completed and approved by the University of Southampton DPIA panel on 23 January 2020.
Results
We collected data from follicular charts of 2322 cycles of 1875 women undergoing stimulation prior to oocyte retrieval for IVF, ICSI or oocyte donation. A total of 9294 individual scans are included in study. The mean age of patients included in the study was 33.57 years (range 20–44 years). In total, 1505 patients had one cycle of COS within the dataset, 301 had two cycles and 55 had three cycles. After exclusion of oocyte donors and fertility preservation cycles, data from 2128 cycles from 1731 patients were complete and suitable for analysis. Table I presents the age, treatment and outcome data for the analysed cycles. The live birth rate per cycle started was 31.53%.
Table I.
Demographic, treatment and outcome data for analysed cycles (n = 2128).
| Variable | Mean (SD) | Median | Interquartile range |
|---|---|---|---|
| Age (years) | 33.57 (4.39) | 34 | 31–37 |
| AFC | 13.77 (8.24) | 12 | 8–18 |
| Starting dose (Units) | 250.6 (78.23) | 225 | 200–300 |
| Leading follicle size at pre-trigger scan (mm) | 20.06 (2.28) | 20 | 18–21 |
| Oocyte number | 10.81 (6.78) | 9.5 | 6–15 |
| M2 oocyte number | 8.68 (6.44) | 7 | 4–12 |
| Number fertilised | 6.36 (4.62) | 5 | 3–9 |
|
| |||
| Variable | % of Total | ||
|
| |||
| GnRH antagonist cycles | 88.8 | – | – |
| Folitropin alfa (Gonal F®) used for stimulation) | 81.1 | – | – |
| Menopur® used for stimulation | 18.9 | – | – |
| Live birth rate | 31.53 | – | – |
AFC, antral follicle count; M2, metaphase II.
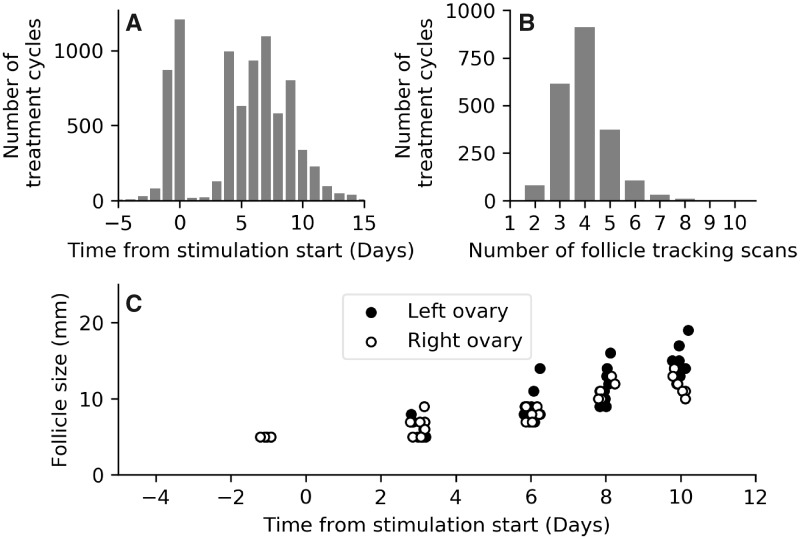
Data presenting information on typical scan frequencies are presented in Fig. 1A and B. In Fig. 1A, we present the proportion of treatment cycles that had a scan on a given day. Most patients have baseline scans immediately prior to stimulation start, and scans are then performed on stimulation Days 3, 4 or 5. Scans then occur with a high frequency between cycle Days 5 and 10. Figure 1B displays a histogram of the total number of scans each patient received in a single treatment cycle. The median number of scans for each patient was four (interquartile range 3–5). A follicular growth chart for a patient with HCG trigger injection administered on cycle Day 14 (stimulation Day 11) is displayed in Fig. 1C, a typical visualisation used by clinical staff to help forecast the trigger administration day and a representation of the key data used by our predictive models.
Figure 1.
Ultrasound scan frequency during treatment cycles. (A) Proportion of cycles (vertical axis) having a scan on each given day of the cycle (horizontal axis, most scans occur between Days 4 and 9 from stimulation start). n= 2128 cycles. (B) Histogram of the total number of scans for a given cycle. (C) Follicle growth chart for a single patient in the study, with HCG trigger injection administered on cycle Day 14 (11 days from stimulation start). A small horizontal jitter has been added to the data points to improve the visualisation.
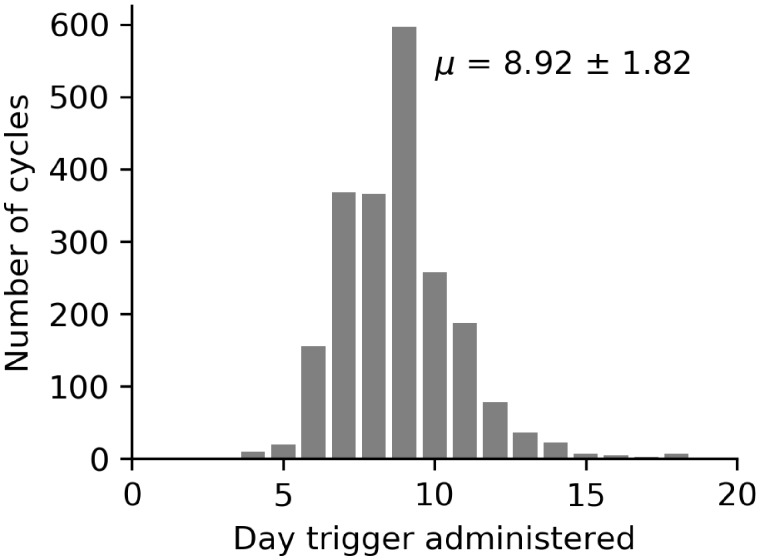
Figure 2 displays a histogram of trigger administration day for each cycle in the dataset. In this dataset, the trigger injection was administered on mean day of stimulation of 8.92 ± 1.82.
Figure 2.
Histogram of day of trigger administration for each cycle in the database, with Day 0 being the date that stimulation started. The mean day of trigger administration was after 8.92 ± 1.82 days of stimulation. n= 2128 cycles.
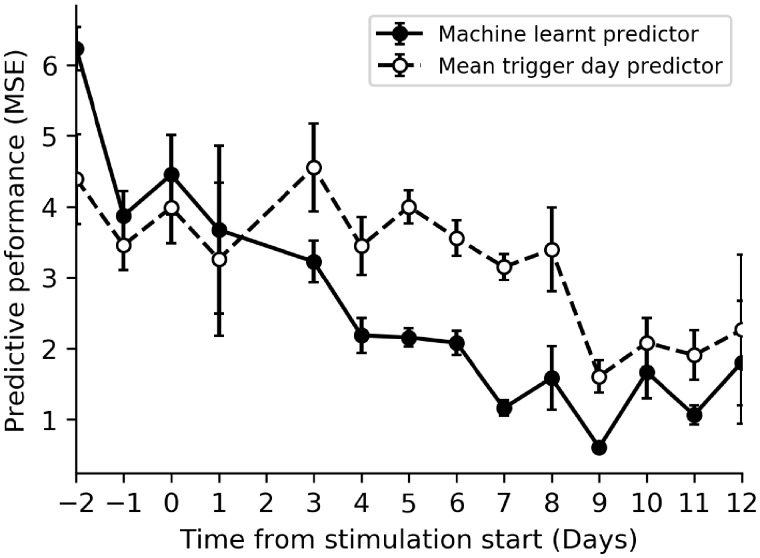
In Fig. 3, we display our machine-learnt models’ performance for predicting the day of trigger administration for each scan day. The developed models use patient age, AFC and follicle count by size for the current scan to predict the day trigger will be administered. The trigger prediction models primarily use the number of follicles of each size to make their prediction of trigger timing, essentially learning the follicle growth rate and clinical decisions to trigger. Models using data from any baseline scan are not highly predictive of the trigger administration day (the mean MSE of models using data only from baseline scans is 4.42 ± 0.57) and do not perform significantly better than simply assuming each patient triggers on the mean day of trigger administration of historical cycles (dashed line in Fig. 3). However, models built using data from scans performed later in the cycle become much more predictive and significantly outperform the baseline trigger day prediction (compare dashed and solid lines in Fig. 3 for stimulation Days 4 and beyond). From Day 5 of stimulation, there is very low standard deviation of model performance across the validation folds.
Figure 3.
Model performance when predicting trigger day versus a heuristic predictor that assumes all patients are triggered on the mean day of trigger administration. Vertical axis is the mean squared error (MSE) between predicted trigger day and actual trigger day. Solid black line and points display performance for the machine-learnt regressor, and dashed black line and points display the performance if we assume all patients are triggered on the mean day. Any day with <100 scans in the database was removed. Error bars represent the SD of the model performance across the validation folds, which yield an estimate of the CI of the models’ performance. n= 2128 cycles.
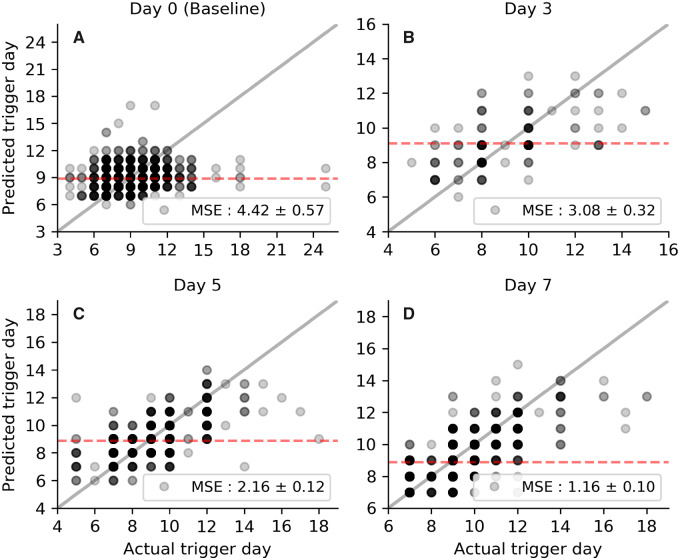
This is further supported by looking at the model’s predictions in detail, as shown in Fig. 4 for several representative days. For follicular data obtained from baseline scans (with little discernible follicle growth), the model cannot reliably stratify patients into their eventual trigger administration day and does not perform better than simply assuming each person will trigger on the historical mean of trigger administration day (Fig. 4A). By Day 3 (Fig. 4B), the model can predict with reasonable confidence a patient’s triggering time, such that it can reliably assign patients into groups, segregated by the expected imminence of trigger administration. At Day 5, the model is strongly predictive of the day of trigger administration (data points follow the grey line, representing a perfect predictor, in Fig. 4C much more closely). The predictive ability of this model suggests that cycle Days 5–9 are most useful in predicting trigger timing and earlier scans hold significantly less benefit in forecasting the trigger administration day.
Figure 4.
Evaluation of model performance for respective scan days. Each panel represents a single scan day (see panel titles) and each data point is an individual patient’s predicted (vertical axis) and actual (horizontal axis) trigger day. Data points are translucent, so darker shades represent a higher density of points. The solid grey line shows the performance of a perfect predictor and the red-dashed line the mean trigger day for patients scanned on the respective day. n= 2128 cycles
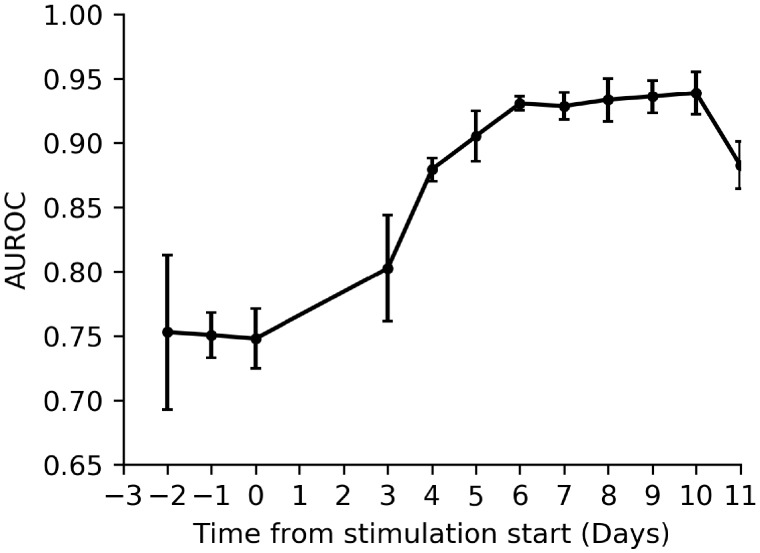
The performance of our model trained to predict patients who over-respond to treatment is displayed in Fig. 5, where we plot the AUROC (evaluated on the out-of-fold samples) for each model trained using scan data collected from the respective scan day. For baseline scans, the model can predict over-response with moderate accuracy (mean AUROC 0.77 ± 0.01), showing that reasonable predictions of over-response can be made using the number of follicles present at the baseline scan and patient age. As the treatment cycle progresses, over-response can be predicted with increasing accuracy as the follicles grow and the model can begin to predict over-response with high precision and recall (AUROC exceeding 0.90) beyond stimulation Day 5.
Figure 5.
Evaluation of the over-response predictive model performance, where the evaluation metric is AUROC. Over-response is a marker of ovarian hyperstimulation syndrome risk. AUROC, area under the receiver operating characteristic curve. Error bars are the SD of the model’s performance across validation folds, which give an indication of the CIs of the model’s performance. n= 2128 cycles.
Discussion
The principle findings of this study are that follicular tracking data obtained from stimulation Days 5–9 can accurately predict both the timing of ovulation trigger and the chance of over-response during COS. Generally, the patient’s age and ovarian reserve (AMH and/or AFC) are used to triage their risk of over- and under-response to COS. This study demonstrates that additional predictive power is gained from follicular tracking data, particularly when the scan is performed on Days 5–9 compared to earlier scans. This is useful to assist with decision-making regarding use of a GnRH agonist trigger and counselling regarding use of a freeze all embryo approach.
Our results suggest that it may be possible to reduce the number of COS monitoring visits without compromising predictive power to identify the timing of egg collection or increasing the risk of over-response by starting follicular tracking from stimulation Day 5. Our model suggests that follicular tracking early in stimulation offers little insight into cycle progress. However, three patients in this dataset (0.16%) had the trigger administered prior to stimulation Day 5 and would experience delayed trigger with this proposed tracking approach. The mean leading follicle size at the last scan pre-trigger for these three patients was 17.6 mm and it is possible that a delay of 1 day is of little clinical significance to their cycle outcome.
Many clinicians perform a baseline scan early in the cycle to assess AFC, check endometrial thickness and assess for the presence of ovarian cysts or endometrial polyps that could warrant postponement or cycle cancellation: there is a lack of evidence for benefit of the latter, particularly as most patients have had a detailed assessment, often including 3D-ultrasound scan, as part of their pre-IVF work-up. Delaying stimulation start for a thick endometrium at baseline scan is not justified by robust evidence and ESHRE guidelines recommend measuring one endometrial thickness at the time of trigger scan only (ESHRE, 2020). Sensibly streamlining COS follicular tracking protocols would reduce the number of patient contacts per cycle, potentially increasing safety for patients and clinic staff.
Strengths and weaknesses
Not every patient has a scan on each day, and this has the effect of the models test set for each scan day being different. The impact of this is mitigated by using cross-validation, which we use to evaluate the model performance on unseen data and provide an estimate of the CIs of the performance metrics. Ideally, a prospective study would be performed where a daily scan is performed to further validate this work.
The trigger day targeted by these models is the timing used for each individual patient, as decided by daily clinical multidisciplinary review of follicular growth charts. This may not have been the optimal timing to maximise cycle outcome. Confounders will include physician tendencies/bias, avoidance of weekend scans and oocyte retrieval, and the fact that each patient’s treatment was individually tailored. In addition, this study was performed within a single centre operating within its standard operating protocols. Results may not be generalisable to other centres that, for example, significantly base decision-making on blood monitoring during stimulation, use flexible start GnRH protocols or have a higher rate of within-cycle stimulation dosage changes. AMH results were not available for a significant proportion of patients in this database and were not included in our modelling. AFC was available and included in the modelling, with feature importance analysis showing that our models associate a lower AFC with a slightly later trigger day, but that this is not a very useful predictor. Further exploring the value of AMH and AFC as predictors of both trigger timing and over-response (requiring agonist trigger) would be of value in future data.
We emphasise that non-inferiority of reduced follicular tracking frequency cannot be surmised from these retrospective findings. It is possible that implementation of a streamlined stimulation monitoring approach utilising this model could have either beneficial or detrimental effects on IVF success rates. This is a retrospective single-centre study and our models would benefit from further validation by testing their generalisation to external data (i.e. collected at different centres). To this end, our models could be readily applied to fully anonymised data that are easily extractable (following ethical approval) from the IDEAs database of other centres in order to test the present findings. The benefit of these machine learning models is that they can be easily retrained once further data are available and individual centres could retrain on their own data to increase utility. As in all clinical research, it is best practice that randomised trials of any streamlined protocols should be carried out in comparison to routine care, with core outcome sets reported, a primary outcome of healthy live birth and key secondary outcomes including the number of cases of OHSS and validated measures of patient’s psychological well-being.
With a larger dataset, including detailed information on scan findings, oocyte numbers, number of metaphase II oocytes and live birth rates, this machine learning approach could possibly lead to optimisation of trigger timing, thereby reducing the impact of variation and bias in decision-making and potentially improving outcomes. However, this is a difficult predictive task, as there is already low variation in trigger timing and many other variables influence cycle outcomes, so this modelling would require a large and detailed dataset. Clinical decisions, such as individual trigger timing and choice, are complex and we envisage that machine learning models will be most useful if they are integrated into the electronic workflow of the clinic and best used as an aid to expert clinicians decision-making, rather than as a replacement.
Conclusion
The finding of good predictive power for both trigger timing and over-response risk from single scans on Days 5, 6 or 7 of stimulation agrees with previous small studies suggesting that reducing follicular tracking scan frequency may be justifiable. In the wake of the current COVID-19 pandemic, if there is a significant need to reduce patient contact per cycle in order to facilitate safe access to care, a priority for patients attending follicular tracking scans after Day 5 of stimulation should be considered.
Our current models require further testing in external validation studies. Nonetheless, we anticipate, with ongoing development, that the model will prove a useful aid both for clinics scheduling their upcoming procedures and for clinicians making crucial decisions on timing of the ovulation trigger. We anticipate that testing to compare model predictions with expert physician estimates of trigger timing will be a key step to evaluate model performance prior to clinical implementation.
Data availability
The dataset will be shared on reasonable request to the corresponding author.
Authors’ roles
I.R. envisaged the study, performed data curation and analysis, contributed to machine learning modelling, provided clinical insight and led manuscript writing. F.P.C. performed data analysis, led machine learning modelling and contributed to manuscript writing. Y.C. provided clinical insight, contributed to manuscript writing and supervised the project.
Funding
F.P.C. acknowledges funding from the NIHR Applied Research Collaboration Wessex.
Conflict of interest
The authors declare they have no conflicts of interest in relation to this work.
Contributor Information
F P Chmiel, IT Innovation Centre, School of Electronics and Computer Science, University of Southampton, Southampton SO16 7NS, UK.
Y Cheong, Human Development and Health, University of Southampton, Southampton SO16 5YA, UK.
References
- Abdalla HI, Baber RJ, Leonard T, Kirkland A, Mitchell A, Power M, Owen E, Studd JWW. Timed oocyte collection in an assisted conception program using GnRH analog. Hum Reprod 1989;4:927–930. [DOI] [PubMed] [Google Scholar]
- De Geyter C, Calhaz-Jorge C, Kupka MS, Wyns C, Mocanu E, Motrenko T, Scaravelli G, Smeenk J, Vidakovic S, Goossens V, The European IVF-monitoring Consortium (EIM) for the European Society of Human Reproduction and Embryology (ESHRE) et al. ART in Europe, 2015: results generated from European registries by ESHRE. Hum Reprod Open 2020. 10.1093/hropen/hoz038. [DOI] [PMC free article] [PubMed] [Google Scholar]
- Domar A, Gordon K, Garcia-Velasco J, La Marca A, Barriere P, Beligotti F. Understanding the perceptions of and emotional barriers to infertility treatment: a survey in four European countries. Hum Reprod 2012;27:1073–1079. [DOI] [PubMed] [Google Scholar]
- ESHRE. ESHRE guideline: ovarian stimulation for IVF/ICSI. Hum Reprod Open 2020;doi: 10.1093/hropen/hoaa009. [DOI] [PMC free article] [PubMed] [Google Scholar]
- Gerris J, Delvigne A, Dhont N, Vandekerckhove F, Madoc B, Buyle M, Neyskens J, Deschepper E, De Bacquer D, Pil L. et al. Self-operated endovaginal telemonitoring versus traditional monitoring of ovarian stimulation in assisted reproduction: an RCT. Hum Reprod 2014;29:1941–1948. [DOI] [PubMed] [Google Scholar]
- Gerris J, Vandekerckhove F, De Sutter P. Outcome of one hundred consecutive ICSI attempts using patient operated home sonography for monitoring follicular growth. Facts Views Vis Obgyn 2016;8:141–146. [PMC free article] [PubMed] [Google Scholar]
- Griesinger G, Verweij PJM, Gates D, Devroey P, Gordon K, Stegmann BJ, Tarlatzis BC. Prediction of ovarian hyperstimulation syndrome in patients treated with Corifollitropin alfa or rFSH in a GnRH antagonist protocol. PLoS One 2016;11:e0149615. [DOI] [PMC free article] [PubMed] [Google Scholar]
- Humaidan P, Nelson SM, Devroey P, Coddington CC, Schwartz LB, Gordon K, Frattarelli JL, Tarlatzis BC, Fatemi HM, Lutjen P. et al. Ovarian hyperstimulation syndrome: review and new classification criteria for reporting in clinical trials. Hum Reprod 2016;31:1997–2004. [DOI] [PubMed] [Google Scholar]
- Hurst BS, Tucker KE, Schlaff WD. A minimally monitored assisted reproduction stimulation protocol reduces cost without compromising success. Fertil Steril 2002;77:98–100. [DOI] [PubMed] [Google Scholar]
- Kwan I Bhattacharya S, Kang A, Woolner A. Monitoring of stimulated cycles in assisted reproduction (IVF and ICSI). Cochrane Database Syst Rev 2014; doi:10.1002/14651858.CD005289.pub3. [DOI] [PMC free article] [PubMed] [Google Scholar]
- Pedregosa F, Varoquaux G, Gramfort A, Michel V, Thirion B, Grisel O, Blondel M, Prettenhofer P, Weiss R, Dubourg V. et al. Scikit-learn: machine learning in Python. J Mach Learn Res 2011;12:2825–2830. [Google Scholar]
- Roest J, Verhoeff A, van Heusden AM, Zeilmaker GH. Minimal monitoring of ovarian hyperstimulation—a useful simplification of the clinical-phase of an in-vitro fertilization treatment. Fertil Steril 1995;64:552–556. [DOI] [PubMed] [Google Scholar]
- Tan SL. Simplifying in-vitro fertilizaton therapy. Curr Opin Obstet Gynecol 1994;6:111–114. [PubMed] [Google Scholar]
- Wikland M, Borg J, Hamberger L, Svalander P. Simplificaton of IVF—minimal monitoring and the use of subcutaneous highly purified FSH administration for ovulation induction. Hum Reprod 1994;9:1430–1436. [DOI] [PubMed] [Google Scholar]
Associated Data
This section collects any data citations, data availability statements, or supplementary materials included in this article.
Data Availability Statement
The dataset will be shared on reasonable request to the corresponding author.


