Abstract
The COVID-19 pandemic has severely impacted factories all over the world, which have been closed to avoid the spread of COVID-19. As a result, ensuring the long-term operation of a factory amid the COVID-19 pandemic becomes a critical but challenging task. To fulfill this task, the applications of smart and automation technologies have been regarded as an effective means. However, such applications are time-consuming and budget-intensive with varying effects and are not necessarily acceptable to workers. In order to make full use of limited resources and time, it is necessary to establish a systematic procedure for comparing various applications of smart and automation technologies. For this reason, an evolving fuzzy assessment approach is proposed. A case study has been conducted to demonstrate the effectiveness of the evolving fuzzy assessment approach in ensuring the long-term operation of a factory amid the COVID-19 pandemic.
Keywords: COVID-19 pandemic, Fuzzy assessment approach, Long-term operations, Factory
Introduction
An outbreak of COV-19 was discovered in Wuhan, China [4]. Since then, the COVID-19 pandemic has severely affected factories all over the world. Many factories were forced to close or operate on a smaller scale. On the contrary, during the COVID-19 pandemic, some factories have received more orders. For example, the necessity of working from home, distance teaching, and video conferencing has increased the demand for notebooks or tablets [29]. Other factories that have also benefited from the COVID-19 pandemic include factories that manufacture masks and thermometers [56].
A few months after the outbreak, the COVID-19 pandemic eased in some areas. However, it is still difficult for factories to resume normal operations due to the following problems:
Workers need to be quarantined for several weeks before returning to a factory [3].
The demand for a product has shrunk and may not recover, that is, the consumption was not delayed but has been canceled [30].
The demand for a product has been advanced. As a result, the future demand may disappear [29].
Due to insufficient transportation capacity, products manufactured by a factory cannot be delivered to customers [22].
Since no one can estimate when the COVID-19 pandemic can be successfully resolved, how to ensure the long-term operation of a factory amid the COVID-19 pandemic has become a critical issue. This research aims to address this issue. However, this research is not an investigation into the sustainability of a factory. The (operational) sustainability of a factory is to use its resources as efficiently as possible to minimize the impact on the environment [7, 13, 40, 59, 63], which has three traditional pillars: economic, environmental, and social sustainability [50, 53]. On the contrary, this study attempts to continue the operation of a factory without being affected by the COVID-19 pandemic, i.e., the environment.
In recent years, a number of advanced automation technologies have been proposed in the manufacturing field, such as automatic inspection [2, 58], autonomous robots [16, 26, 60], additive manufacturing [8, 9, 11, 62, 67], ubiquitous manufacturing (UM) [11, 39, 61], cloud manufacturing [10, 21, 48], Internet of things (IoT) [54, 55], cyber-physical systems [36, 55], etc. As shown in Table 1, some of these advanced automation technologies are designed to promote the cooperation between factories by sharing manufacturing resources, which is difficult amid the COVID-19 pandemic and may not help mitigate the impact, as illustrated in Table 1. In contrast, applications of smart and automation technologies to assist workers have been considered feasible [6, 45, 47]. For example, using voice commands or gestures to interact with machines can avoid spreading COVID-19 by touching the machines [33, 34]. The same purpose can be achieved by using a smartphone to remotely control a machine [46]. In addition, since body temperature is one of the basic criteria for screening workers who may be infected, workers can wear smart wristbands or watches to detect their body temperature [43]. Wearable sensors can also be used to measure the proximity of workers to ensure physical distance [45].
Table 1.
Effects of existing smart and automation technologies on mitigating the impact of the COVID-19 pandemic
| Smart and automation technology | Effect | Mechanism |
|---|---|---|
| Automatic inspection | Positive | Reduce workforce |
| Autonomous robots | Positive | Reduce workforce |
| Additive manufacturing | Positive | Reduce workforce |
| Ubiquitous manufacturing | Negative | Increasing the possibility of cross-factory infection |
| Cloud manufacturing | Negative | Increasing the possibility of cross-factory infection |
| Internet of things | Positive | Reducing human-machine contact |
| Cyber-physical systems | Positive | Reducing human-machine contact |
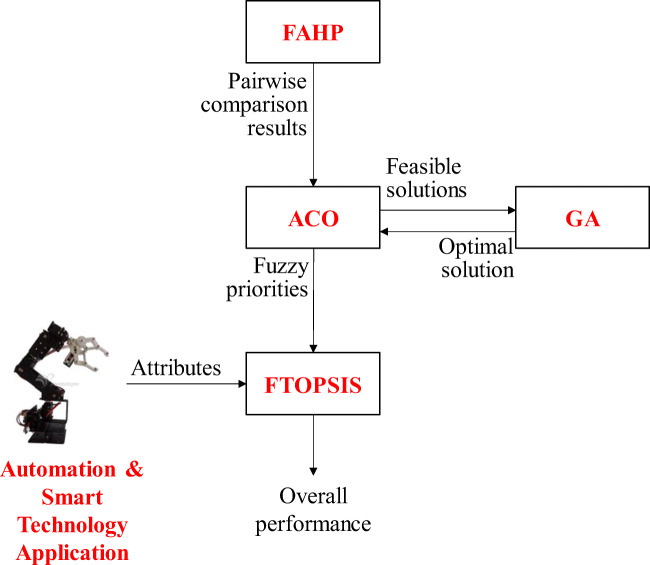
This study aims to establish a systematic mechanism to assist a factory manager in selecting the most suitable smart and automation technology application to ensure the long-term operation amid the COVID-19 pandemic. So far, no similar mechanisms have been proposed. For this purpose, an evolving fuzzy assessment approach is proposed. The evolving fuzzy assessment approach is composed of three parts: alpha-cut operations (ACO)-based fuzzy analytic hierarchy process (FAHP) [14], genetic algorithm (GA) [12, 35], and fuzzy technique for order preference by similarity to the ideal solution (FTOPSIS) [38]. First, according to the judgment of the factory manager, the ACO-FAHP approach is applied to derive the priorities of criteria for assessing a smart and automation technology application to ensure the long-term operation amid the COVID-19 pandemic. In this step, in order to enhance the computational efficiency of ACO, a GA is designed. Subsequently, based on the derived priorities, FTOPSIS is applied to evaluate the overall performance of each smart and automation technology application. The smart and automation technology application with the best performance will be selected. The evolving fuzzy assessment approach has been applied to a factory to assess its effectiveness.
The remainder of this paper is organized as follows. Section 2 is dedicated to the literature review. Section 3 is an introduction of the evolving fuzzy assessment approach proposed in this study. Section 4 details the application of the evolving fuzzy assessment approach to a case of choosing the most suitable smart and automation technology application to ensure the long-term operation of a factory amid the COVID-19 pandemic. Several existing methods were also applied to the case for comparison. Section 5 provides the conclusions of this study as well as some possible topics for future investigation.
Literature review
Measures taken by factories in response to the COVID-19 pandemic
Amid the COVID-19 pandemic, affected workers must undergo home quarantine. As a result, a factory runs for reduced work hours temporarily. As an alternative, the workforce in a factory can be reduced by staggering work shifts or introducing weekend working, which also avoids the gathering of workers [42]. In addition, indirect labor, such as administrative, managerial, and accounting staff, is encouraged to work remotely. Then, their offices become extra space for factory workers (Hesse and [24]). Further, Singapore’s experience showed that overseas workers (work permit holders) should be distributed among different dormitories to avoid cross-infection [44].
A sanitized working environment needs to be created to prevent any further infection [3]. There are sanitizers at the entrance. Each worker’s temperature is checked here. Then, workers wear masks (cloth or surgical masks), protective clothing, sterilizers, and gloves every day [18]. These treatments also apply to visitors and logistics drivers whose names and basic data are recorded and activities are restricted. Plastic barriers between machines are raised (Hesse and [24]).
Workers wear masks and keep a minimum distance from each other [31]. When the work rate is low or moderate, wearing a facial mask may not have a significant physiological impact on a worker [49]. For example, dizziness is less likely to occur when wearing a cloth or surgical mask. However, prolonged usage of facial masks may cause fatigue [28]. To solve this problem,
More rest opportunities need to be arranged into the work schedule [52].
The daily production target can be lowered.
The work pace can be slowed down by lowering the input rate or implementing pull production [17].
The standard processing time can be extended.
A worker is given more time to correct his/her mistakes.
In addition, workers should be provided with incentives to encourage them to wash their hands frequently [65]. After each use, a worker needs to disinfect the machine interface (such as buttons, keyboard, touchscreen, etc.) [64].
In sum, to address to avoid the spread of COVID-19 in the shop floor, factory managers have taken the following measures:
Contingency measures: Workers are asked to wear facial masks, keep physical distance from each other, wash hands frequently, and take the temperature every day. Some factories were closed during the lockdown of their cities [32].
Preventative measures: Factory managers actively look for guidelines such as those provided by International Labour Organization (ILO) and Occupational Safety and Health Administration (OSHA), and follow these guidelines by changing work procedures, rescheduling work shifts, adjusting facility layout, and creating a healthier working environment. [24, 31].
Sustainable measures: Factory managers develop strategies (such as changing the employment policy, transforming into a laborless factory (i.e., further automation), upgrading the ventilation system, moving the factory to countries with better COVID-19 responses, etc. to reduce the risk and impact of future possible outbreaks [6, 20].
These measures are summarized with an inverted triangle in Fig. 1, which means more measures need to be taken to achieve higher efficacy.
Fig. 1.
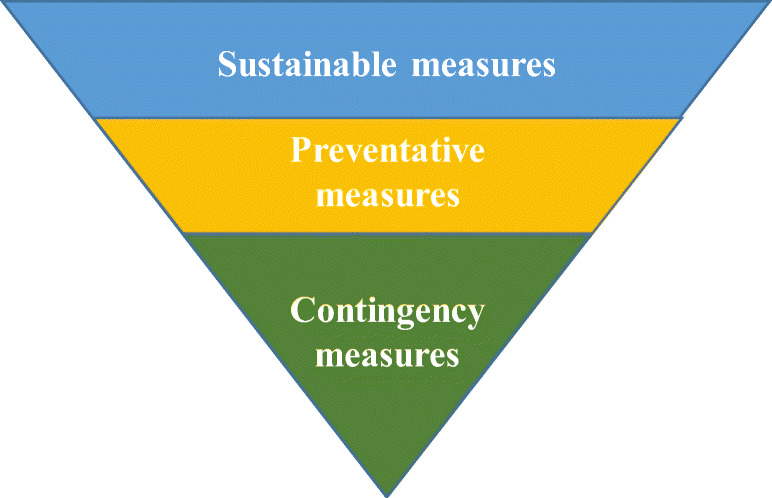
Measures taken by factories to avoid the spread of COVID-19
Smart and automation technology applications
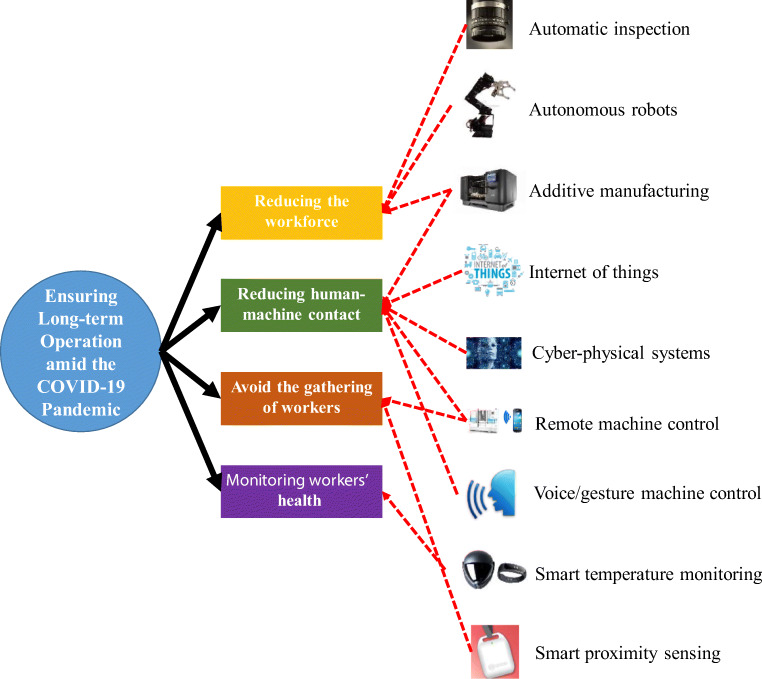
The COVID-19 pandemic provides factories with opportunities to increase automation and remote service delivery [47]. Among existing advanced automation technologies, automatic inspection, autonomous robots, and additive manufacturing can mitigate the impact of the COVID-19 pandemic by reducing the workforce; Internet of things and cyber-physical systems help to prevent the spread of COVID-19 by reducing human-machine contact. Therefore, it is expected that more robots and automation systems will be used earlier than planned [23, 47]. Canadian Plastics [6] described such a trend as “a lasting boom in factory robotics”.
Tradition automation is mainly for low-level tasks. In the epidemic, the goal of automation is shifting to tasks that are more labor intensive or difficult to maintain social distance [23]. In addition, whether automation technologies that have been popular in recent years, such as artificial intelligence (AI) and cloud manufacturing, have brought benefits to factories amid the COVID-19 pandemic is questioned [6]. In addition, automated equipment such as a computer numerical control (CNC) machine tool is controlled by a minicomputer with interfaces such as keyboards and touchscreens that easily spread COVID-19. To solve this problem, such automated equipment can be operated with voice commands or gestures, or can also be remotely controlled through applications on a smartphone [33, 34, 46]. The latter is a joint application of automation and smart technologies.
Smart technologies are technologies that use electronic devices or systems that can be connected to the Internet, used interactively, and are to some extent intelligent (Hollis 2015) [1, 15, 41, 57]. Amid the COVID-19 pandemic, smart technologies can also be applied to enhance the operational efficiency and protect the safety and health of workers. For example, workers can wear smart wristbands or watches to detect their body temperature [43], while supervisors can wear smart helmets to monitor workers’ body temperature [5]. In addition, wireless sensors can be worn or carried to measure the proximity of workers to ensure physical distance or record their movements for tracking [45, 68]. If two wearable sensors get too close, they will issue a warning signal. The contact time is also recorded. In-door positioning technologies can also be applied to screen workers who may come into contact with an infected worker [45]. Figure 2 summarizes possible smart and automation technologies for ensuring the long-term operation of a factory amid the COVID-19 pandemic.
Fig. 2.
Possible smart and automation technologies for ensuring the long-term operation of a factory amid the COVID-19 pandemic
The evolving fuzzy assessment approach
The proposed evolving fuzzy assessment approach comprises three major parts: FAHP-ACO, GA, and FTOPSIS, as illustrated in Fig. 3.
Fig. 3.
The evolving fuzzy assessment approach
In the evolving fuzzy assessment approach, at first the factory manager compares the relative priority of a critical factor over that of another in linguistic terms such as “as equal as,” “weakly more important than,” “strongly more important than,” “very strongly more important than,” and “absolutely more important than” [7]. These linguistic terms are usually mapped to triangular fuzzy numbers (TFNs) within [1, 8, 69].
Based on pairwise comparison results, the fuzzy judgment matrix is constructed as
| 1 |
| 2 |
The fuzzy eigenvalue and eigenvector of , indicated with and respectively, satisfy [51]
| 3 |
and
| 4 |
where (-) and (×) denote fuzzy subtraction and multiplication, respectively. The consistency among pairwise comparison results can be evaluated with fuzzy consistency ratio:
| 5 |
where is the fuzzy maximal eigenvalue; RI is the random consistency index [51]. should be less than 0.1~0.3, depending on the problem size. Subsequently, ACO is applied to derive the values of and as follows.
First, the fuzzy parameters and variables in Equations (3) and (4) are replaced with their α cuts:
| 6 |
| 7 |
If α takes 11 possible values (0, 0.1, …, 1), Equations (6) and (7) must be solved 11⋅ times to derive the α cuts of fuzzy maximal eigenvalue and fuzzy eigenvector as [14]
| 8 |
| 9 |
| 10 |
| 11 |
where * = L or R. , , , and are the results derived from the t-th combination; t = 1~11⋅. To enhance the efficiency of ACO, a GA algorithm is designed as follows.
First, the encoding of a chromosome is illustrated in Fig. 4, where 0 represents selecting the left α cut of a fuzzy pairwise comparison result; 1 represents selecting the right α cut. There are two fitness functions. One is to maximize fuzzy maximal eigenvalue (or fuzzy vector), and the other is to minimize fuzzy maximal eigenvalue (or fuzzy vector):
| 12 |
| 13 |
Fig. 4.
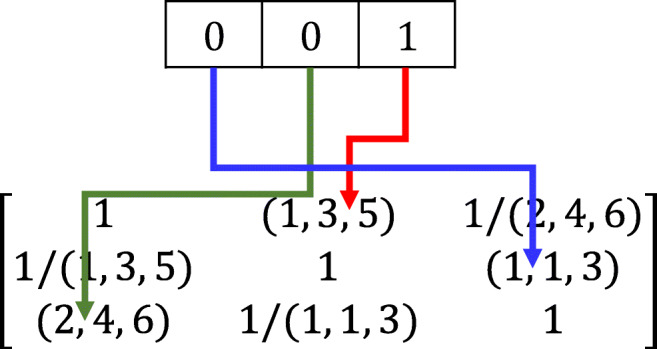
Encoding of a chromosome
The optimization results are used to establish the α cut of fuzzy eigenvalue (or fuzzy vector). To this end, two groups of chromosomes are established. Because the two fitness functions are opposite, chromosomes that perform particularly poorly in one group can be moved to the other.
The roulette wheel method is applied to choose parent chromosomes to be paired based on their fitness values. A crossover point is chosen at random. Offspring chromosomes are generated by exchanging the genes of parents among themselves before or after the crossover point. Finally, FTOPSIS is applied to evaluate the overall performance of a smart and automation technology application as follows.
First, the performance of a smart and automation technology application in optimizing each critical factor is normalized using fuzzy distributive normalization as
| 14 |
where is the performance of the q-th smart and automation technology application in optimizing the i-th critical factor; is the normalized performance. Subsequently, fuzzy prioritized scores are calculated based on the derived fuzzy priorities:
| 15 |
Fuzzy ideal (zenith) point and fuzzy anti-ideal (nadir) point are specified respectively as
| 16 |
| 17 |
The fuzzy distances from the smart and automation technology application to the two reference points are calculated respectively as
| 18 |
| 19 |
Finally, the fuzzy closeness of the smart and automation technology application is obtained as
| 20 |
A smart and automation technology application is more suitable if its fuzzy closeness is higher. To get an absolute ranking, the fuzzy closeness can be defuzzified using the COG method [25]:
| 21 |
Application
The proposed methodology was applied to select a smart and automation technology application to ensure the long-term operation of a machinery works factory in Taichung, Taiwan amid the COVID-19 pandemic. The factory was making metal parts from top-grade raw materials and high-strength alloys using sophisticated manufacturing equipment such as CNC horizontal machining centers, robotic welders, precise scanning probes, and automatic test systems, which laid the foundation for the factory to apply advanced smart and automation technologies.
After reviewing the related literature and practices, the following factors were considered critical to the selection of a suitable smart and automation technology application to ensure the long-term operation of a factory amid the COVID-19 pandemic:
Low estimated total costs
High effectiveness for preventing the spread of COVID-19
Low interference with existing operations
Easiness of adoption
High acceptability to workers
The factory manager first compared the relative priorities of these critical factors with linguistic terms. The results are summarized in Table 2.
Table 2.
Results of pairwise comparisons
| Critical factor no. 1 | Criticalfactor no. 2 | Relative priority of critical factor no. 1 over critical factor no. 2 |
|---|---|---|
| High effectiveness for preventing the spread of COVID-19 | Low estimated total costs | Weakly or strongly more important than |
| Low estimated total costs | Low interference with existing operations | Strongly more important than |
| Low estimated total costs | Easiness of adoption | Weakly or strongly more important than |
| Low estimated total costs | High acceptability to workers | Weakly more important than |
| High effectiveness for preventing the spread of COVID-19 | Low interference with existing operations | Strongly more important than |
| High effectiveness for preventing the spread of COVID-19 | Easiness of adoption | Strongly more important than |
| High effectiveness for preventing the spread of COVID-19 | High acceptability to workers | Weakly or strongly more important than |
| Easiness of adoption | Low interference with existing operations | Weakly or strongly more important than |
| High acceptability to workers | Low interference with existing operations | As equal as or weakly more important than |
| High acceptability to workers | Easiness of adoption | Weakly more important than |
Based on Table 2, the following fuzzy judgment matrix was constructed:
| 22 |
ACO is applied to derive the values of fuzzy priorities and fuzzy maximal eigenvalue with the aid of a GA algorithm from this fuzzy judgment matrix. Both ACO and GA were implemented using MATLAB on a PC with an i7-7700 CPU 3.6-GHz and 8-GB RAM. Without GA, it took 24 s to complete the task. After incorporating GA, the execution time was shortened to less than 5 s. The results are shown in Figs. 5 and 6, respectively. The fuzzy consistency ratio of the fuzzy judgment matrix was around 0.118 with a minimum of 0.013 and a maximum of 0.421, as illustrated in Fig. 7, which was highly consistent.
Fig. 5.
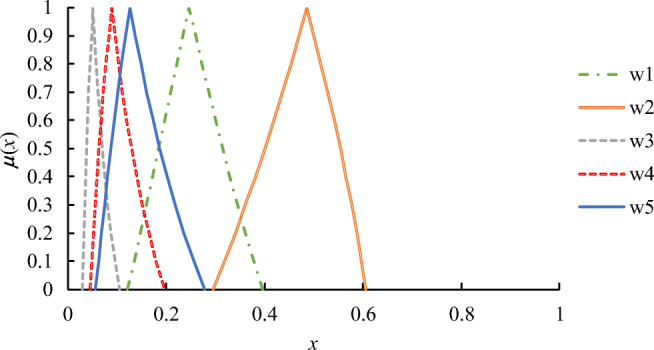
The values of fuzzy priorities derived using ACO+GA
Fig. 6.
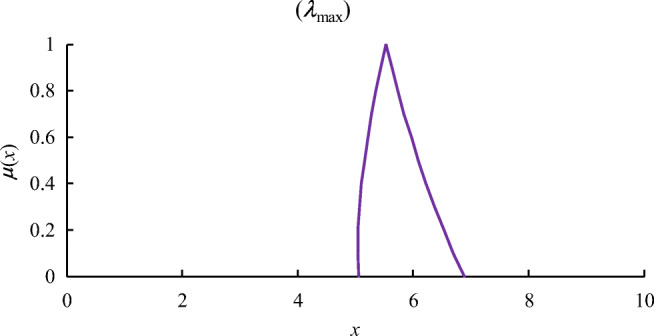
The value of fuzzy maximal eigenvalue derived using ACO+GA
Fig. 7.
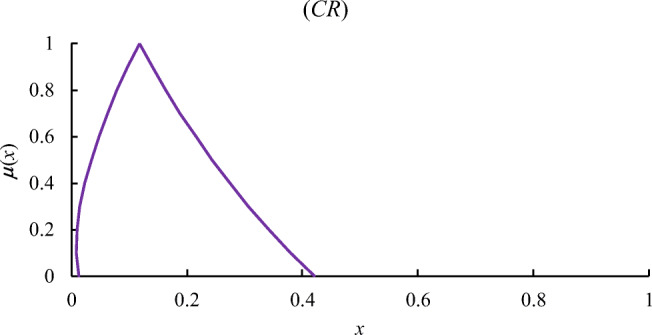
Fuzzy consistency ratio
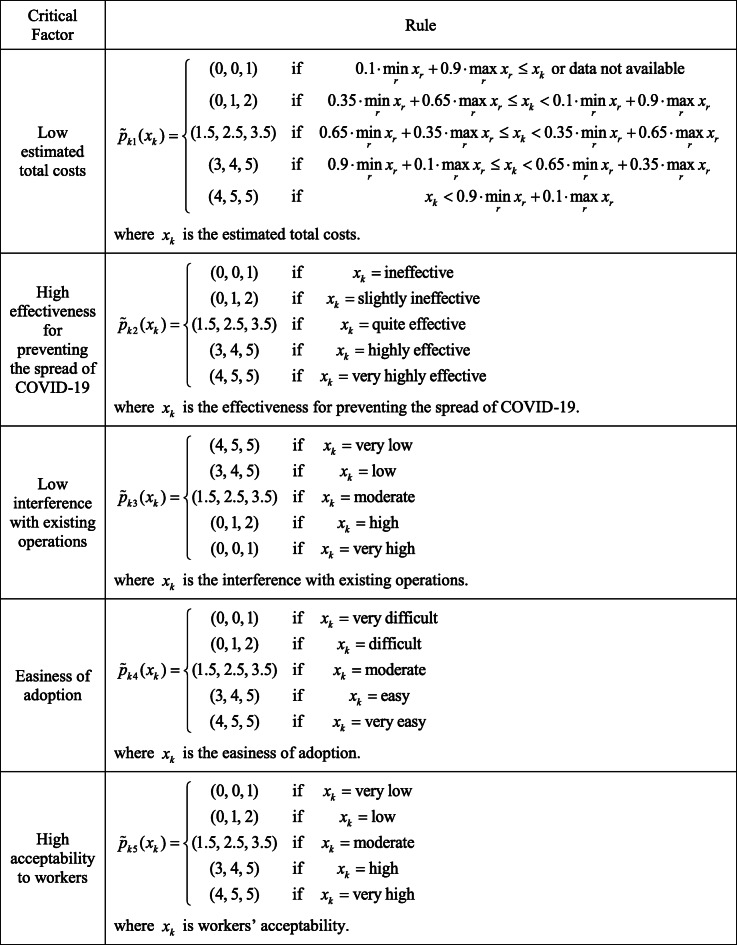
Among the five critical factors, “high effectiveness for preventing the spread of COVID-19,” “easiness of adoption,” and “high acceptability to workers” were the-higher-the-better performances, whereas the others were the-lower-the-better performances. The performances were evaluated according to the rules in Table 3.
Table 3.
Rules for evaluating the performances
Based on the derived fuzzy priorities, four smart and automation technology applications were compared:
Monitoring workers’ health with smart wristbands [43]
Providing workers with smart personal protection equipment (PPE), such as face masks with tiny sensors in them to detect all symptoms of COVID, fatigue, etc. [19]
Smart warehousing with automated guided vehicles and robots [37]
Table 4 presents the evaluation results.
Table 4.
Evaluation results
| k | Application | |||||
|---|---|---|---|---|---|---|
| 1 | Machine remote control | (1.5, 2.5, 3.5) | (4.0, 5.0, 5.0) | (0.0, 1.0, 2.0) | (0.0, 1.0, 2.0) | (3.0, 4.0, 5.0) |
| 2 | Workers’ smart wristbands | (3.0, 4.0, 5.0) | (0.0, 1.0, 2.0) | (4.0, 5.0, 5.0) | (4.0, 5.0, 5.0) | (4.0, 5.0, 5.0) |
| 3 | Worker’s smart PPEs | (1.5, 2.5, 3.5) | (3.0, 4.0, 5.0) | (3.0, 4.0, 5.0) | (3.0, 4.0, 5.0) | (1.5, 2.5, 3.5) |
| 4 | Smart warehouse | (0.0, 1.0, 2.0) | (4.0, 5.0, 5.0) | (0.0, 1.0, 2.0) | (1.5, 2.5, 3.5) | (3.0, 4.0, 5.0) |
Subsequently, the performance of a smart and automation technology application in optimizing each critical factor was normalized using fuzzy distributive normalization. The results are summarized in Table 5.
Table 5.
Normalized performances
| k | Application | |||||
|---|---|---|---|---|---|---|
| 1 | Machine remote control | (0.18, 0.46, 0.72) | (0.48, 0.61, 0.71) | (0.00, 0.15, 0.37) | (0.00, 0.14, 0.36) | (0.36, 0.50, 0.69) |
| 2 | Workers’ smart wristbands | (0.46, 0.74, 1.03) | (0.00, 0.12, 0.28) | (0.54, 0.76, 0.93) | (0.51, 0.72, 0.89) | (0.47, 0.63, 0.69) |
| 3 | Worker’s smart PPEs | (0.23, 0.46, 0.72) | (0.36, 0.49, 0.71) | (0.41, 0.61, 0.93) | (0.38, 0.58, 0.89) | (0.18, 0.31, 0.48) |
| 4 | Smart warehouse | (0.00, 0.18, 0.41) | (0.48, 0.61, 0.71) | (0.00, 0.15, 0.37) | (0.19, 0.36, 0.63) | (0.36, 0.50, 0.69) |
Subsequently, the fuzzy weighted scores of all smart and automation technology applications, in terms of α cuts, were calculated based on the derived fuzzy priorities. The results are summarized in Table 6.
Table 6.
Fuzzy weighted scores
| q | (α:α cut) | (α:α cut) | (α:α cut) | (α:α cut) | (α:α cut) |
|---|---|---|---|---|---|
| 1 |
0.0: [0.02, 0.29] 0.1: [0.03, 0.26] 0.2: [0.04, 0.24] 0.3: [0.04, 0.22] 0.4: [0.05, 0.20] 0.5: [0.06, 0.19] 0.6: [0.07, 0.17] 0.7: [0.08, 0.15] 0.8: [0.09, 0.14] 0.9: [0.10, 0.13] 1.0: [0.11, 0.11] |
0.0: [0.14, 0.43] 0.1: [0.16, 0.42] 0.2: [0.17, 0.40] 0.3: [0.19, 0.39] 0.4: [0.20, 0.38] 0.5: [0.22, 0.37] 0.6: [0.23, 0.35] 0.7: [0.25, 0.34] 0.8: [0.27, 0.32] 0.9: [0.28, 0.31] 1.0: [0.30, 0.30] |
0.0: [0.00, 0.04] 0.1: [0.00, 0.03] 0.2: [0.00, 0.03] 0.3: [0.00, 0.02] 0.4: [0.00, 0.02] 0.5: [0.00, 0.02] 0.6: [0.00, 0.02] 0.7: [0.00, 0.01] 0.8: [0.01, 0.01] 0.9: [0.01, 0.01] 1.0: [0.01, 0.01] |
0.0: [0.00, 0.07] 0.1: [0.00, 0.06] 0.2: [0.00, 0.05] 0.3: [0.00, 0.04] 0.4: [0.00, 0.04] 0.5: [0.00, 0.03] 0.6: [0.01, 0.03] 0.7: [0.01, 0.02] 0.8: [0.01, 0.02] 0.9: [0.01, 0.02] 1.0: [0.01, 0.01] |
0.0: [0.02, 0.19] 0.1: [0.02, 0.17] 0.2: [0.03, 0.15] 0.3: [0.03, 0.14] 0.4: [0.03, 0.12] 0.5: [0.04, 0.11] 0.6: [0.04, 0.10] 0.7: [0.05, 0.09] 0.8: [0.05, 0.08] 0.9: [0.06, 0.07] 1.0: [0.06, 0.06] |
| 2 |
0.0: [0.06, 0.41] 0.1: [0.07, 0.38] 0.2: [0.08, 0.35] 0.3: [0.09, 0.33] 0.4: [0.10, 0.30] 0.5: [0.11, 0.28] 0.6: [0.12, 0.26] 0.7: [0.14, 0.24] 0.8: [0.15, 0.22] 0.9: [0.17, 0.20] 1.0: [0.18, 0.18] |
0.0: [0.00, 0.17] 0.1: [0.00, 0.16] 0.2: [0.01, 0.15] 0.3: [0.01, 0.14] 0.4: [0.02, 0.12] 0.5: [0.02, 0.11] 0.6: [0.03, 0.10] 0.7: [0.04, 0.09] 0.8: [0.04, 0.08] 0.9: [0.05, 0.07] 1.0: [0.06, 0.06] |
0.0: [0.02, 0.10] 0.1: [0.02, 0.09] 0.2: [0.02, 0.08] 0.3: [0.02, 0.07] 0.4: [0.02, 0.06] 0.5: [0.02, 0.06] 0.6: [0.03, 0.05] 0.7: [0.03, 0.05] 0.8: [0.03, 0.05] 0.9: [0.04, 0.04] 1.0: [0.04, 0.04] |
0.0: [0.02, 0.18] 0.1: [0.03, 0.16] 0.2: [0.03, 0.14] 0.3: [0.03, 0.13] 0.4: [0.03, 0.12] 0.5: [0.04, 0.10] 0.6: [0.04, 0.09] 0.7: [0.05, 0.09] 0.8: [0.05, 0.08] 0.9: [0.06, 0.07] 1.0: [0.06, 0.06] |
0.0: [0.03, 0.19] 0.1: [0.03, 0.18] 0.2: [0.03, 0.16] 0.3: [0.04, 0.15] 0.4: [0.04, 0.13] 0.5: [0.05, 0.12] 0.6: [0.05, 0.11] 0.7: [0.06, 0.10] 0.8: [0.07, 0.10] 0.9: [0.07, 0.09] 1.0: [0.08, 0.08] |
| 3 |
0.0: [0.03, 0.29] 0.1: [0.03, 0.26] 0.2: [0.04, 0.24] 0.3: [0.05, 0.22] 0.4: [0.06, 0.20] 0.5: [0.06, 0.19] 0.6: [0.07, 0.17] 0.7: [0.08, 0.15] 0.8: [0.09, 0.14] 0.9: [0.10, 0.13] 1.0: [0.11, 0.11] |
0.0: [0.11, 0.43] 0.1: [0.12, 0.41] 0.2: [0.13, 0.39] 0.3: [0.14, 0.37] 0.4: [0.16, 0.35] 0.5: [0.17, 0.33] 0.6: [0.18, 0.31] 0.7: [0.20, 0.29] 0.8: [0.21, 0.27] 0.9: [0.22, 0.26] 1.0: [0.24, 0.24] |
0.0: [0.01, 0.10] 0.1: [0.01, 0.09] 0.2: [0.01, 0.08] 0.3: [0.02, 0.07] 0.4: [0.02, 0.06] 0.5: [0.02, 0.05] 0.6: [0.02, 0.05] 0.7: [0.02, 0.04] 0.8: [0.03, 0.04] 0.9: [0.03, 0.03] 1.0: [0.03, 0.03] |
0.0: [0.02, 0.18] 0.1: [0.02, 0.15] 0.2: [0.02, 0.14] 0.3: [0.02, 0.12] 0.4: [0.03, 0.11] 0.5: [0.03, 0.10] 0.6: [0.03, 0.08] 0.7: [0.04, 0.07] 0.8: [0.04, 0.07] 0.9: [0.05, 0.06] 1.0: [0.05, 0.05] |
0.0: [0.01, 0.13] 0.1: [0.01, 0.12] 0.2: [0.01, 0.11] 0.3: [0.02, 0.09] 0.4: [0.02, 0.08] 0.5: [0.02, 0.07] 0.6: [0.02, 0.07] 0.7: [0.03, 0.06] 0.8: [0.03, 0.05] 0.9: [0.04, 0.05] 1.0: [0.04, 0.04] |
| 4 |
0.0: [0.00, 0.16] 0.1: [0.00, 0.15] 0.2: [0.01, 0.13] 0.3: [0.01, 0.12] 0.4: [0.01, 0.11] 0.5: [0.02, 0.09] 0.6: [0.02, 0.08] 0.7: [0.03, 0.07] 0.8: [0.03, 0.06] 0.9: [0.04, 0.05] 1.0: [0.05, 0.05] |
0.0: [0.14, 0.43] 0.1: [0.16, 0.42] 0.2: [0.17, 0.40] 0.3: [0.19, 0.39] 0.4: [0.20, 0.38] 0.5: [0.22, 0.37] 0.6: [0.23, 0.35] 0.7: [0.25, 0.34] 0.8: [0.27, 0.32] 0.9: [0.28, 0.31] 1.0: [0.30, 0.30] |
0.0: [0.00, 0.04] 0.1: [0.00, 0.03] 0.2: [0.00, 0.03] 0.3: [0.00, 0.02] 0.4: [0.00, 0.02] 0.5: [0.00, 0.02] 0.6: [0.00, 0.02] 0.7: [0.00, 0.01] 0.8: [0.01, 0.01] 0.9: [0.01, 0.01] 1.0: [0.01, 0.01] |
0.0: [0.01, 0.12] 0.1: [0.01, 0.11] 0.2: [0.01, 0.09] 0.3: [0.01, 0.08] 0.4: [0.02, 0.07] 0.5: [0.02, 0.06] 0.6: [0.02, 0.06] 0.7: [0.02, 0.05] 0.8: [0.03, 0.04] 0.9: [0.03, 0.04] 1.0: [0.03, 0.03] |
0.0: [0.02, 0.19] 0.1: [0.02, 0.17] 0.2: [0.03, 0.15] 0.3: [0.03, 0.14] 0.4: [0.03, 0.12] 0.5: [0.04, 0.11] 0.6: [0.04, 0.10] 0.7: [0.05, 0.09] 0.8: [0.05, 0.08] 0.9: [0.06, 0.07] 1.0: [0.06, 0.06] |
Based on the fuzzy weighted scores, fuzzy ideal point and fuzzy anti-ideal point were defined, as shown in Table 7. Subsequently, the distances from each smart and automation technology application to the two reference points were measured, respectively. The results are summarized in Table 8.
Table 7.
Fuzzy ideal point and fuzzy anti-ideal point
| Reference point | (α:α cut) | (α:α cut) | (α:α cut) | (α:α cut) | (α:α cut) |
|---|---|---|---|---|---|
| Fuzzy ideal point |
0.0: [0.06, 0.41] 0.1: [0.07, 0.38] 0.2: [0.08, 0.35] 0.3: [0.09, 0.33] 0.4: [0.10, 0.30] 0.5: [0.11, 0.28] 0.6: [0.12, 0.26] 0.7: [0.14, 0.24] 0.8: [0.15, 0.22] 0.9: [0.17, 0.20] 1.0: [0.18, 0.18] |
0.0: [0.14, 0.43] 0.1: [0.16, 0.42] 0.2: [0.17, 0.40] 0.3: [0.19, 0.39] 0.4: [0.20, 0.38] 0.5: [0.22, 0.37] 0.6: [0.23, 0.35] 0.7: [0.25, 0.34] 0.8: [0.27, 0.32] 0.9: [0.28, 0.31] 1.0: [0.30, 0.30] |
0.0: [0.02, 0.10] 0.1: [0.02, 0.09] 0.2: [0.02, 0.08] 0.3: [0.02, 0.07] 0.4: [0.02, 0.06] 0.5: [0.02, 0.06] 0.6: [0.03, 0.05] 0.7: [0.03, 0.05] 0.8: [0.03, 0.05] 0.9: [0.04, 0.04] 1.0: [0.04, 0.04] |
0.0: [0.02, 0.18] 0.1: [0.03, 0.16] 0.2: [0.03, 0.14] 0.3: [0.03, 0.13] 0.4: [0.03, 0.12] 0.5: [0.04, 0.10] 0.6: [0.04, 0.09] 0.7: [0.05, 0.09] 0.8: [0.05, 0.08] 0.9: [0.06, 0.07] 1.0: [0.06, 0.06] |
0.0: [0.03, 0.19] 0.1: [0.03, 0.18] 0.2: [0.03, 0.16] 0.3: [0.04, 0.15] 0.4: [0.04, 0.13] 0.5: [0.05, 0.12] 0.6: [0.05, 0.11] 0.7: [0.06, 0.10] 0.8: [0.07, 0.10] 0.9: [0.07, 0.09] 1.0: [0.08, 0.08] |
| Fuzzy anti-ideal point |
0.0: [0.00, 0.16] 0.1: [0.00, 0.15] 0.2: [0.01, 0.13] 0.3: [0.01, 0.12] 0.4: [0.01, 0.11] 0.5: [0.02, 0.09] 0.6: [0.02, 0.08] 0.7: [0.03, 0.07] 0.8: [0.03, 0.06] 0.9: [0.04, 0.05] 1.0: [0.05, 0.05] |
0.0: [0.00, 0.17] 0.1: [0.00, 0.16] 0.2: [0.01, 0.15] 0.3: [0.01, 0.14] 0.4: [0.02, 0.12] 0.5: [0.02, 0.11] 0.6: [0.03, 0.10] 0.7: [0.04, 0.09] 0.8: [0.04, 0.08] 0.9: [0.05, 0.07] 1.0: [0.06, 0.06] |
0.0: [0.00, 0.04] 0.1: [0.00, 0.03] 0.2: [0.00, 0.03] 0.3: [0.00, 0.02] 0.4: [0.00, 0.02] 0.5: [0.00, 0.02] 0.6: [0.00, 0.02] 0.7: [0.00, 0.01] 0.8: [0.01, 0.01] 0.9: [0.01, 0.01] 1.0: [0.01, 0.01] |
0.0: [0.00, 0.07] 0.1: [0.00, 0.06] 0.2: [0.00, 0.05] 0.3: [0.00, 0.04] 0.4: [0.00, 0.04] 0.5: [0.00, 0.03] 0.6: [0.01, 0.03] 0.7: [0.01, 0.02] 0.8: [0.01, 0.02] 0.9: [0.01, 0.02] 1.0: [0.01, 0.01] |
0.0: [0.01, 0.13] 0.1: [0.01, 0.12] 0.2: [0.01, 0.11] 0.3: [0.02, 0.09] 0.4: [0.02, 0.08] 0.5: [0.02, 0.07] 0.6: [0.02, 0.07] 0.7: [0.03, 0.06] 0.8: [0.03, 0.05] 0.9: [0.04, 0.05] 1.0: [0.04, 0.04] |
Table 8.
Distances between each smart and automation technology application and the two reference points
| q | (α:α cut) | (α:α cut) |
|---|---|---|
| 1 |
0.0: [0.00, 0.55] 0.1: [0.00, 0.50] 0.2: [0.00, 0.44] 0.3: [0.00, 0.40] 0.4: [0.00, 0.35] 0.5: [0.01, 0.30] 0.6: [0.02, 0.25] 0.7: [0.03, 0.21] 0.8: [0.04, 0.17] 0.9: [0.06, 0.13] 1.0: [0.09, 0.09] |
0.0: [0.00, 0.55] 0.1: [0.00, 0.52] 0.2: [0.02, 0.49] 0.3: [0.05, 0.45] 0.4: [0.08, 0.42] 0.5: [0.11, 0.39] 0.6: [0.13, 0.36] 0.7: [0.16, 0.33] 0.8: [0.19, 0.30] 0.9: [0.22, 0.28] 1.0: [0.25, 0.25] |
| 2 |
0.0: [0.00, 0.60] 0.1: [0.00, 0.56] 0.2: [0.02, 0.52] 0.3: [0.05, 0.47] 0.4: [0.08, 0.43] 0.5: [0.11, 0.39] 0.6: [0.13, 0.36] 0.7: [0.16, 0.32] 0.8: [0.19, 0.29] 0.9: [0.21, 0.26] 1.0: [0.24, 0.24] |
0.0: [0.00, 0.52] 0.1: [0.00, 0.47] 0.2: [0.00, 0.43] 0.3: [0.00, 0.39] 0.4: [0.00, 0.35] 0.5: [0.02, 0.32] 0.6: [0.04, 0.28] 0.7: [0.07, 0.25] 0.8: [0.10, 0.21] 0.9: [0.13, 0.18] 1.0: [0.15, 0.15] |
| 3 |
0.0: [0.00, 0.56] 0.1: [0.00, 0.51] 0.2: [0.00, 0.46] 0.3: [0.00, 0.41] 0.4: [0.00, 0.37] 0.5: [0.00, 0.32] 0.6: [0.00, 0.27] 0.7: [0.00, 0.23] 0.8: [0.02, 0.19] 0.9: [0.05, 0.14] 1.0: [0.10, 0.10] |
0.0: [0.00, 0.57] 0.1: [0.00, 0.52] 0.2: [0.00, 0.48] 0.3: [0.01, 0.44] 0.4: [0.03, 0.41] 0.5: [0.06, 0.37] 0.6: [0.08, 0.33] 0.7: [0.11, 0.30] 0.8: [0.14, 0.26] 0.9: [0.17, 0.23] 1.0: [0.20, 0.20] |
| 4 |
0.0: [0.00, 0.56] 0.1: [0.00, 0.51] 0.2: [0.00, 0.46] 0.3: [0.00, 0.42] 0.4: [0.00, 0.37] 0.5: [0.02, 0.33] 0.6: [0.04, 0.29] 0.7: [0.07, 0.25] 0.8: [0.09, 0.21] 0.9: [0.12, 0.17] 1.0: [0.14, 0.14] |
0.0: [0.00, 0.51] 0.1: [0.00, 0.48] 0.2: [0.02, 0.45] 0.3: [0.05, 0.42] 0.4: [0.08, 0.39] 0.5: [0.11, 0.37] 0.6: [0.13, 0.34] 0.7: [0.16, 0.31] 0.8: [0.19, 0.29] 0.9: [0.21, 0.26] 1.0: [0.24, 0.24] |
Finally, the fuzzy closeness of each smart and automation technology application was derived. The results are shown in Table 9.
Table 9.
Fuzzy closeness of each smart and automation technology application
| q | (α:α cut) |
|---|---|
| 1 |
0.0: [0.00, 1.00] 0.1: [0.00, 1.00] 0.2: [0.05, 1.00] 0.3: [0.12, 1.00] 0.4: [0.19, 1.00] 0.5: [0.26, 0.98] 0.6: [0.34, 0.95] 0.7: [0.43, 0.92] 0.8: [0.53, 0.88] 0.9: [0.63, 0.81] 1.0: [0.73, 0.73] |
| 2 |
0.0: [0.00, 1.00] 0.1: [0.00, 1.00] 0.2: [0.00, 0.95] 0.3: [0.00, 0.88] 0.4: [0.00, 0.82] 0.5: [0.04, 0.75] 0.6: [0.11, 0.68] 0.7: [0.18, 0.61] 0.8: [0.25, 0.54] 0.9: [0.32, 0.46] 1.0: [0.39, 0.39] |
| 3 |
0.0: [0.00, 1.00] 0.1: [0.00, 1.00] 0.2: [0.00, 1.00] 0.3: [0.02, 1.00] 0.4: [0.08, 1.00] 0.5: [0.15, 1.00] 0.6: [0.23, 1.00] 0.7: [0.32, 1.00] 0.8: [0.42, 0.94] 0.9: [0.54, 0.81] 1.0: [0.66, 0.66] |
| 4 |
0.0: [0.00, 1.00] 0.1: [0.00, 1.00] 0.2: [0.05, 1.00] 0.3: [0.11, 1.00] 0.4: [0.18, 1.00] 0.5: [0.24, 0.96] 0.6: [0.32, 0.89] 0.7: [0.39, 0.83] 0.8: [0.47, 0.76] 0.9: [0.55, 0.69] 1.0: [0.62, 0.62] |
Subsequently, COG was applied to defuzzify the fuzzy closeness of each smart and automation technology application. The results are summarized in Table 10.
Table 10.
Defuzzification results
| q | Defuzzified closeness |
|---|---|
| 1 | 0.668 |
| 2 | 0.403 |
| 3 | 0.627 |
| 4 | 0.603 |
According to the experimental results:
There was significant difference between the overall performances of suitable and unsuitable smart and automation technology applications.
Among the four smart and automation technology applications, “remote control of machines” achieved the highest overall performance, which was obviously due to its high effectiveness for preventing the spread of COVID-19 and high acceptability to workers.
In contrast, “monitoring workers’ health with smart wristbands” was considered the least suitable, owing to its low effectiveness for preventing the spread of COVID-19.
For comparison, two existing methods, FGM-FWA and fuzzy ordered weighted average (fuzzy OWA), were also applied to compare these smart and automation technology applications. In FGM-FWA, the fuzzy priorities of criteria were approximated using FGM. Then, FWA was applied to assess the overall performance of each smart and automation technology application. In fuzzy OWA, the moderately optimistic strategy was adopted. The ranking results obtained using various methods are compared in Fig. 8. Obviously, the ranking result using the proposed methodology was somewhat different from those using existing methods. Existing methods estimated, rather than derived, the fuzzy priorities of critical factors, which led to incorrect decisions.
Fig. 8.
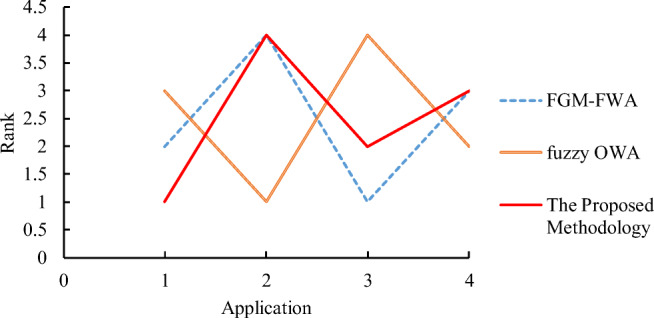
Comparison of the ranking results using various methods
-
5.
The proposed methodology can be implemented in the following industrial applications. Factory managers can apply the proposed methodology to select suitable smart and automation technology applications, plan the required budget, and make purchases. In addition, if the budget is limited, the limited budget can also be allocated effectively based on the conclusions of this study.
Conclusions
The COVID-19 pandemic has severely impacted factories all over the world. Ensuring the long-term operation of a factory amid the COVID-19 pandemic becomes an urgent issue. To address this issue, the application of smart and automation technologies has been considered as a viable means. For this reason, a systematic mechanism is needed to assist factories in selecting the most suitable smart and automation technology application amid the COVID-19 pandemic. For this purpose, the evolving fuzzy approach is proposed in this study. In the proposed methodology, ACO-FAHP is first used to derive the priorities of critical factors found after reviewing the related literature and practices. To enhance the computational efficiency of ACO, a GA is also designed. Subsequently, FTOPSIS is applied to evaluate the overall performance of each smart and automation technology application in optimizing all critical factors. Finally, the top-performing smart and automation technology application is the most suitable application and will be recommended to the factory.
The proposed methodology has been applied to compare four possible smart and automation technology applications for a factory to illustrate its applicability. After analyzing the experimental results, the following conclusions were drawn:
The most important critical factor for ensuring the long-term operation of the factory was “high effectiveness for preventing the spread of COVID-19”.
“Remote control of machines” was evaluated as the most suitable smart and automation technology application, followed by “providing workers with smart PPE,” to the factory manager.
The ranking result using the proposed methodology was different from those using several existing methods, because existing methods did not derive the exact priorities of critical factors.
The contribution of this study includes the following:
Several smart and automation technology applications to ensure the long-term operation of a factory amid the COVID-19 pandemic have been proposed.
A systematic and quantitative procedure was established for comparing these smart and automation technology applications amid the COVID-19 pandemic.
It is difficult to know for how long the COVID-19 pandemic will last. Therefore, the same analysis needs to be performed again to see whether the experimental results obtained in this study are still applicable.
Footnotes
Publisher’s note
Springer Nature remains neutral with regard to jurisdictional claims in published maps and institutional affiliations.
Contributor Information
Toly Chen, Email: tolychen@ms37.hinet.net.
Chi-Wei Lin, Email: cwlin@fcu.edu.tw.
References
- 1.Al-Refaie A, Chen T, Judeh M. Optimal operating room scheduling for normal and unexpected events in a smart hospital. Oper Res. 2018;18(3):579–602. [Google Scholar]
- 2.An Z, Wang Y, Zheng L, Liu X. Adaptive recognition of intelligent inspection system for cable brackets in multiple assembly scenes. Int J Adv Manuf Technol. 2020;108(11-12):3373–3389. doi: 10.1007/s00170-020-05591-5. [DOI] [Google Scholar]
- 3.Bhaya AG (2020) COVID-19: ‘World’s factory’ is springing back to life. https://news.cgtn.com/news/2020-03-10/COVID-19-World-s-Factory-is-springing-back-to-life-OKjy54uWic/index.html. Accessed 30 Jun 2020
- 4.Bloomberg News (2020). What doctors treating Covid-19 in Wuhan say about coronavirus. https://www.bloomberg.com/news/articles/2020-03-05/what-doctors-treating-covid-19-in-wuhan-say-about-the-virus. Accessed 12 Jun 2020
- 5.Borak M (2020) Chinese police now have AI helmets for temperature screening. https://www.msn.com/en-sg/news/world/chinese-police-now-have-ai-helmets-for-temperature-screening/ar-BB10vUiN. Accessed 29 Jun 2020
- 6.Canadian Plastics (2020) Will COVID-19 create a boom in factory automation? https://www.canplastics.com/features/will-covid-19-create-a-boom-in-factory-automation/. Accessed 27 Jun 2020
- 7.Chen T. Assessing factors critical to smart technology applications to mobile health care− the fgm-fahp approach. Health Policy Technol. 2020;9:194–203. doi: 10.1016/j.hlpt.2020.02.005. [DOI] [PMC free article] [PubMed] [Google Scholar]
- 8.Chen T, Lin YC. Feasibility evaluation and optimization of a smart manufacturing system based on 3D printing: a review. Int J Intell Syst. 2017;32(4):394–413. doi: 10.1002/int.21866. [DOI] [Google Scholar]
- 9.Chen TCT, Lin YC. Diverse three-dimensional printing capacity planning for manufacturers. Robot Comput Integr Manuf. 2021;67:102052. doi: 10.1016/j.rcim.2020.102052. [DOI] [Google Scholar]
- 10.Chen T, Wang YC. Estimating simulation workload in cloud manufacturing using a classifying artificial neural network ensemble approach. Robot Comput Integr Manuf. 2016;38:42–51. doi: 10.1016/j.rcim.2015.09.011. [DOI] [Google Scholar]
- 11.Chen T, Wang YC. An advanced IoT system for assisting ubiquitous manufacturing with 3D printing. Int J Adv Manuf Technol. 2019;103(5-8):1721–1733. doi: 10.1007/s00170-019-03691-5. [DOI] [Google Scholar]
- 12.Chen T, Wang YC (2020) An evolving fuzzy planning mechanism for a ubiquitous manufacturing system. 108 2337–2347
- 13.Chen D, Schudeleit T, Posselt G, Thiede S. A state-of-the-art review and evaluation of tools for factory sustainability assessment. Procedia CIRP. 2013;9:85–90. doi: 10.1016/j.procir.2013.06.173. [DOI] [Google Scholar]
- 14.Chen T, Lin YC, Chiu MC. Approximating alpha-cut operations approach for effective and efficient fuzzy analytic hierarchy process analysis. Appl Soft Comput. 2019;85:105855. doi: 10.1016/j.asoc.2019.105855. [DOI] [Google Scholar]
- 15.Chiu MC, Chen TCT. Assessing sustainable effectiveness of the adjustment mechanism of a ubiquitous clinic recommendation system. Health Care Manag Sci. 2020;23(2):239–248. doi: 10.1007/s10729-019-09473-5. [DOI] [PubMed] [Google Scholar]
- 16.Costa PJ, Moreira N, Campos D, Gonçalves J, Lima J, Costa PL. Localization and navigation of an omnidirectional mobile robot: The robot@ factory case study. IEEE Revista Iberoamericana de Tecnologias del Aprendizaje. 2016;11(1):1–9. doi: 10.1109/RITA.2016.2518420. [DOI] [Google Scholar]
- 17.Davidson J, Davidson JP (1991) Breathing Space: Living and Working at a Comfortable Pace in a Sped-Up Society. Breathing Space Institute
- 18.Elshenawi DM, Wang Y. How to protect factory workers from COVID-19? BioResources. 2020;15(4):1–4. [Google Scholar]
- 19.Farabaugh K (2020) COVID-19 sparks technology innovation. https://www.voanews.com/covid-19-pandemic/covid-19-sparks-technology-innovation. Accessed 25 Jun 2020
- 20.Fox J (2020) What prepares a country for a pandemic? An epidemic helps. https://www.bloomberg.com/opinion/articles/2020-03-18/covid-19-response-better-in-countries-with-sars-mers-coronavirus. Accessed 11 Jun 2020
- 21.Ghomi EJ, Rahmani AM, Qader NN. Cloud manufacturing: Challenges, recent advances, open research issues, and future trends. Int J Adv Manuf Technol. 2019;102(9-12):3613–3639. doi: 10.1007/s00170-019-03398-7. [DOI] [Google Scholar]
- 22.Gleason M (2020) COVID-19 drives PC market supply down, demand up. https://searchenterprisedesktop.techtarget.com/news/252481747/COVID-19-drives-PC-market-supply-down-demand-up. Accessed 17 Jun 2020
- 23.Hamstra M (2020) Pandemic trend: Seeking efficiency and safety, businesses accelerate warehouse automation. https://www.uschamber.com/co/good-company/launch-pad/warehouse-robotic-automation-coronavirus-pandemic. Accessed 19 Jun 2020
- 24.Hesse KA, O’Neill N (2020) Steps to reduce workers’ risk of COVID-19 exposure. https://blog.ifebp.org/index.php/reduce-workers-covid-19-exposure. Accessed 20 Jun 2020
- 25.Huang D, Chen T, Wang, & M.-J. J (2001) A fuzzy set approach for event tree analysis. Fuzzy Sets Syst 118:153–165
- 26.Huang S, Ishikawa M, Yamakawa Y. A coarse-to-fine framework for accurate positioning under uncertainties—from autonomous robot to human–robot system. Int J Adv Manuf Technol. 2020;108(9-10):2929–2944. doi: 10.1007/s00170-020-05376-w. [DOI] [Google Scholar]
- 27.Hollis F (2015) What is smart technology? https://incontrol-uk.com/what-is-smarttechnology/
- 28.Ibrahim N (2020) Is it dangerous to wear a COVID-19 protective mask for too long? Prolonged usage of certain masks can cause some health concerns. https://www.snopes.com/fact-check/masks-dangerous-health/. Accessed 21 Jun 2020
- 29.Ikoba JJ (2020) Lenovo leads the notebook market’s positive Q1 2020 results despite COVID-19. https://www.gizmochina.com/2020/05/11/lenovo-leads-the-notebook-markets-positive-q1-2020-results-despite-covid-19/. Accessed 25 Jun 2020
- 30.Ilchi L (2020) How the coronavirus is impacting the fashion, beauty and retail industries. https://wwd.com/fashion-news/fashion-scoops/coronavirus-impact-fashion-beauty-retail-fashion-week-store-closures-1203541123/. Accessed 18 Jun 2020
- 31.International Labour Organization (2020) In the Face of a Pandemic: Ensuring Safety and Health at Work. https://www.ilo.org/wcmsp5/groups/public/%2D%2D-ed_protect/%2D%2D-protrav/%2D%2D-safework/documents/publication/wcms_742463.pdf. Accessed 12 Jun 2020
- 32.Isidore C (2020) Ford forced to halt production at two plants after employees test positive for Covid-19. https://edition.cnn.com/2020/05/20/business/ford-chicago-positive-covid-19-test/index.html. Accessed 17 Jun 2020
- 33.Kao CY, Fahn CS. A human-machine interaction technique: hand gesture recognition based on hidden Markov models with trajectory of hand motion. Procedia Eng. 2011;15:3739–3743. doi: 10.1016/j.proeng.2011.08.700. [DOI] [Google Scholar]
- 34.Kuremoto T, Yamane T, Feng L, Kobayashi K, Obayashi M (2011) A human-machine interaction system: A voice command learning system using PL-G-SOM. International Conference on Management and Service Science, pp 1-4
- 35.Laili Y, Zhang L, Tao F (2011) Energy adaptive immune genetic algorithm for collaborative design task scheduling in cloud manufacturing system. 2011 IEEE International Conference on Industrial Engineering and Engineering Management, pp 1912-1916
- 36.Lee J, Bagheri B, Kao HA. A cyber-physical systems architecture for industry 4.0-based manufacturing systems. Manuf Lett. 2015;3:18–23. doi: 10.1016/j.mfglet.2014.12.001. [DOI] [Google Scholar]
- 37.Li Z, Li W, Jiang L (2015) Research on the task assignment problem of warehouse robots in the smart warehouse. 12th International Symposium on Operations Research and its Applications in Engineering, Technology and Management, pp 29-33
- 38.Lima Junior FR, Osiro L, Carpinetti LCR. A comparison between Fuzzy AHP and Fuzzy TOPSIS methods to supplier selection. Appl Soft Comput. 2014;21:194–209. doi: 10.1016/j.asoc.2014.03.014. [DOI] [Google Scholar]
- 39.Lin YC, Chen T. A ubiquitous manufacturing network system. Robot Comput Integr Manuf. 2017;45:157–167. doi: 10.1016/j.rcim.2015.10.009. [DOI] [Google Scholar]
- 40.Lin CW, Chen T. 3D printing technologies for enhancing the sustainability of an aircraft manufacturing or MRO company—a multi-expert partial consensus-FAHP analysis. Int J Adv Manuf Technol. 2019;105(10):4171–4180. doi: 10.1007/s00170-019-03998-3. [DOI] [Google Scholar]
- 41.Lin YC, Wang YC, Chen TCT, Lin HF. Evaluating the suitability of a smart technology application for fall detection using a fuzzy collaborative intelligence approach. Mathematics. 2019;7(11):1097. doi: 10.3390/math7111097. [DOI] [Google Scholar]
- 42.Masondo S (2020) Covid-19 lockdown: calls for staggered working hours to get economy going. https://www.timeslive.co.za/sunday-times/news/2020-05-24-covid-19-lockdown-calls-for-staggered-working-hours-to-get-economy-going/. Accessed 20 Jun 2020
- 43.Masood A, Khan KB, Younas T, Khalid AR. International Conference on Intelligent Technologies and Applications. 2019. Design of wearable prototype smart wristband for remote health monitoring using Internet of things; pp. 3–13. [Google Scholar]
- 44.McKenna T (2020) While Singapore touts its COVID-19 success, migrant workers face the greatest risk. https://www.cbc.ca/news/investigates/singapore-covid-19-1.5564641. Accessed 22 Jun 2020
- 45.Miller J (2020) Basketball tech used to fight Covid-19 on factory floor. https://www.ft.com/content/ffa5e644-e0b4-4656-b3d6-3069e16774ef. Accessed 19 Jun 2020
- 46.Parga C, Li X, Yu W. 2013 IEEE International Conference on Systems, Man, and Cybernetics. 2013. Smartphone-based human machine interface with application to remote control of robot arm; pp. 2316–2321. [Google Scholar]
- 47.Ramirez VB (2020) Coronavirus may mean automation is coming sooner than we thought. https://singularityhub.com/2020/03/19/coronavirus-may-mean-automation-is-coming-sooner-than-we-thought/. Accessed 23 Jun 2020
- 48.Ren L, Zhang L, Wang L, Tao F, Chai X. Cloud manufacturing: key characteristics and applications. Int J Comput Integr Manuf. 2017;30(6):501–515. doi: 10.1080/0951192X.2014.902105. [DOI] [Google Scholar]
- 49.Roberge RJ, Kim JH, Benson SM. Absence of consequential changes in physiological, thermal and subjective responses from wearing a surgical mask. Respir Physiol Neurobiol. 2012;181(1):29–35. doi: 10.1016/j.resp.2012.01.010. [DOI] [PubMed] [Google Scholar]
- 50.Rodger JA, George JA. Triple bottom line accounting for optimizing natural gas sustainability: A statistical linear programming fuzzy ILOWA optimized sustainment model approach to reducing supply chain global cybersecurity vulnerability through information and communications technology. J Clean Prod. 2017;142:1931–1949. doi: 10.1016/j.jclepro.2016.11.089. [DOI] [Google Scholar]
- 51.Saaty TL. Decision making with the analytic hierarchy process. Int J Serv Sci. 2008;1(1):83–98. [Google Scholar]
- 52.Sabitoni AE (2019) Identifying and reducing worker fatigue in construction, https://www.lhsfna.org/index.cfm/lifelines/august-2019/identifying-and-reducing-worker-fatigue-in-construction. Accessed 24 Jun 2020
- 53.Stylos N, Vassiliadis C. Differences in sustainable management between four-and five-star hotels regarding the perceptions of three-pillar sustainability. J Hosp Mark Manag. 2015;24(8):791–825. [Google Scholar]
- 54.Tao F, Zuo Y, Da Xu L, Zhang L. IoT-based intelligent perception and access of manufacturing resource toward cloud manufacturing. IEEE Trans Ind Inform. 2014;10(2):1547–1557. doi: 10.1109/TII.2014.2306397. [DOI] [Google Scholar]
- 55.Thramboulidis K, Christoulakis F. UML4IoT—A UML-based approach to exploit IoT in cyber-physical manufacturing systems. Comput Ind. 2016;82:259–272. doi: 10.1016/j.compind.2016.05.010. [DOI] [Google Scholar]
- 56.Tobin G (2020) Coronavirus fires up production at Australia's only medical mask factory. https://www.abc.net.au/news/2020-03-27/inside-australias-only-medical-mask-factory/12093864. Accessed 11 Jun 2020
- 57.van Doorn M (2015) What does SMART technology actually mean? http://labs.sogeti.com/wat-smart-technology-actually-mean/. Accessed 20 Jun 2020
- 58.Velásquez RA, Lara JM (2016) Robot unit for cost and time balance using automatic inspection on overhead lines. IEEE ANDESCON, pp 1-4
- 59.Wang YC, Chen TCT. An FNLP approach for planning energy-efficient manufacturing: Wafer fabrication as an example. Procedia Manuf. 2019;38:439–446. doi: 10.1016/j.promfg.2020.01.056. [DOI] [Google Scholar]
- 60.Wang YC, Chen T, Chiang H, Pan HC. A simulation analysis of part launching and order collection decisions for a flexible manufacturing system. Simul Model Pract Theory. 2016;69:80–91. doi: 10.1016/j.simpat.2016.09.006. [DOI] [Google Scholar]
- 61.Wang XV, Wang L, Mohammed A, Givehchi M. Ubiquitous manufacturing system based on Cloud: A robotics application. Robot Comput Integr Manuf. 2017;45:116–125. doi: 10.1016/j.rcim.2016.01.007. [DOI] [Google Scholar]
- 62.Wang YC, Chen T, Yeh YL. Advanced 3D printing technologies for the aircraft industry: A fuzzy systematic approach for assessing the critical factors. Int J Adv Manuf Technol. 2019;105(10):4059–4069. doi: 10.1007/s00170-018-1927-8. [DOI] [Google Scholar]
- 63.Wang YC, Chiu MC, Chen T. A fuzzy nonlinear programming approach for planning energy-efficient wafer fabrication factories. Appl Soft Comput. 2020;95:106506. doi: 10.1016/j.asoc.2020.106506. [DOI] [Google Scholar]
- 64.Wee D (2020) How to ensure agility on factory floor during COVID-19. https://www.industryweek.com/covid19/article/21129302/how-to-ensure-agility-on-factory-floor-during-covid19. Accessed 19 Jun 2020
- 65.Wilson S, Jacob CJ, Powell D. Behavior-change interventions to improve hand-hygiene practice: a review of alternatives to education. Crit Public Health. 2011;21(1):119–127. doi: 10.1080/09581591003786122. [DOI] [Google Scholar]
- 66.Wu HC, Chen TCT. Quality control issues in 3D-printing manufacturing: A review. Rapid Prototyp J. 2018;24(3):607–614. doi: 10.1108/RPJ-02-2017-0031. [DOI] [Google Scholar]
- 67.Yildiz AS, Davut K, Koc B, Yilmaz O. Wire arc additive manufacturing of high-strength low alloy steels: Study of process parameters and their influence on the bead geometry and mechanical characteristics. Int J Adv Manuf Technol. 2020;108(11-12):3391–3404. doi: 10.1007/s00170-020-05482-9. [DOI] [Google Scholar]
- 68.Yu E (2020) Singapore issues COVID-19 contact tracing wearables to ‘vulnerable seniors’. https://www.zdnet.com/article/singapore-issues-covid-19-contact-tracing-wearables-to-vulnerable-seniors/. Accessed 22 Jun 2020
- 69.Zheng G, Zhu N, Tian Z, Chen Y, Sun B. Application of a trapezoidal fuzzy AHP method for work safety evaluation and early warning rating of hot and humid environments. Saf Sci. 2012;50(2):228–239. doi: 10.1016/j.ssci.2011.08.042. [DOI] [Google Scholar]


