

Abstract
The novel coronavirus (COVID-19) pneumonia has become a serious health challenge in countries worldwide. Many radiological findings have shown that X-ray and CT imaging scans are an effective solution to assess disease severity during the early stage of COVID-19. Many artificial intelligence (AI)-assisted diagnosis works have rapidly been proposed to focus on solving this classification problem and determine whether a patient is infected with COVID-19. Most of these works have designed networks and applied a single CT image to perform classification; however, this approach ignores prior information such as the patient’s clinical symptoms. Second, making a more specific diagnosis of clinical severity, such as slight or severe, is worthy of attention and is conducive to determining better follow-up treatments. In this paper, we propose a deep learning (DL) based dual-tasks network, named FaNet, that can perform rapid both diagnosis and severity assessments for COVID-19 based on the combination of 3D CT imaging and clinical symptoms. Generally, 3D CT image sequences provide more spatial information than do single CT images. In addition, the clinical symptoms can be considered as prior information to improve the assessment accuracy; these symptoms are typically quickly and easily accessible to radiologists. Therefore, we designed a network that considers both CT image information and existing clinical symptom information and conducted experiments on 416 patient data, including 207 normal chest CT cases and 209 COVID-19 confirmed ones. The experimental results demonstrate the effectiveness of the additional symptom prior information as well as the network architecture designing. The proposed FaNet achieved an accuracy of 98.28% on diagnosis assessment and 94.83% on severity assessment for test datasets. In the future, we will collect more covid-CT patient data and seek further improvement.
Keywords: Fast assessment network, COVID-19, 3D CT image sequences, Clinical symptoms
Introduction
The novel coronavirus (COVID-19) is an infectious disease that has spread rapidly to most countries worldwide. To date (May 27, 2020), over 5,543,761 confirmed cases have been reported, and the disease has caused over 150,159 deaths. This situation has attracted concerns about serious public health emergencies from many health organizations. The current tests and diagnosis methods available for COVID-19 are based primarily on reverse transcription polymerase chain reaction (RT-PCT) [1, 2]; consequently, obtaining test and diagnosis results requires a minimum of 4–6 h. Considering the rate at which COVID-19 spreads, 4–6 hh is a long time to obtain the results. In addition, a shortage of RT-PCR test kits has been a huge challenge for many countries.
An alternative solution for clinical assessment of COVID-19 is to adopt computed tomography (CT) or X-ray scans, which are both faster and cheaper than RT-PCR. In addition, CT images are readily available and show an accuracy similar to that of RT-PCT. Thus, CT medical imaging could play a vital role in assessing patients who are positive for COVID-19. Several works [3–5] have demonstrated promising results regarding the effectiveness of using CT scans for COVID-19. On the other hand, there is a high demand for rapid severity assessments of COVID-19 using CT scans during the early stage of the disease because such assessments are beneficial for determining follow-up treatments. Generally, clinical severity assessments for patients include 2 categories: slight and severe, which leads to different treat plans. Figure 1 shows CT image examples from 3 cases with normal assessment and another slight or severe COVID-19 assessments. Compared with normal cases, the severe ones represent more obvious abnormal lesion areas in a larger scale. Besides, the symptoms of these three patients are given in Table 1. Shi et al. [6] conducted descriptive studies on 81 patients with COVID-19 in Wuhan, China. Pan et al. [7] reported on lung changes over time from chest CT images during COVID-19 recovery. Based on these radiological findings, chest CT images and clinical symptoms, including fever, cough and dyspnoea, of patients with COVID-19 can be beneficial for clinical assessments. Zhao et al. [8] compiled a COVID-CT dataset1 and proposed a deep learning method to predict whether a patient is affected with COVID-19. Although this method achieves promising performance based on this open public dataset, it cannot predict specific severity assessments. Currently, many AI (artificial intelligence)-assisted diagnosis works have been proposed that focus on solving this classification task to determine whether a patient has been infected with COVID-19. However, most of these networks are designed to perform classification based on a single CT image, and they ignore prior information, such as a patient’s clinical symptoms. As shown in Fig. 2a, the workflows of these networks typically consist of feature extraction from a single CT image followed by classification prediction for disease assessment. However, more specific diagnosis of clinical severity, including slight and severe assessments, is worthy of attention and is beneficial for determining follow-up treatments.
Fig. 1.

CT image examples of three patients with COVID-19. The images in the first row are from a normal patient; the images in the second row are from a patient classified as slight; and the images in the third row are patient classified as severe. The red arrows denote several potential abnormal lesion areas
Table 1.
Symptoms of three patient cases in Fig. 1
| Symptoms | Fever | Cough | Muscle ache | Fatigue | Headache | Nausea | Diarrhoea | Stomachache | Dyspnea |
|---|---|---|---|---|---|---|---|---|---|
| Patient 1 | – | – | – | – | – | – | – | – | – |
| Patient 2 | √ | √ | – | – | – | – | – | – | – |
| Patient 3 | – | √ | – | – | – | – | – | – | – |
“√” denotes the patient is with the certain symptom, for instance fever
Fig. 2.

The workflows of classification frameworks based on a a single CT image and b our proposed network (FaNet)
In this paper, we explore a fast assessment method for both diagnosis and severity assessments based on 3D CT imaging and clinical symptoms. The workflow is shown in Fig. 2b. First, to consider additional spatial tomography information, we apply 3D CT image sequences instead of single CT images. This may make the operation more convenient for radiologists, who can simply input continual chest CT image sequences from patients without having to select a specific single CT image in advance. Second, the clinical symptoms from patients can function as additional prior information to improve assessment performance. Such clinical symptoms are easily and rapidly accessible compared with laboratory results. By employing both 3D CT image sequences and clinical symptoms, we are able to achieve rapid both diagnosis and severity assessment in the early stage of COVID-19 disease, which can act as a point of reference to assist radiologists in determining follow-up treatments.
The remainder of this paper is organized as follows: Related works are shown in Section. 2. We describe our method in Section 3. First, we describe the details of 3D CT image sequences and clinical symptoms and then present the network workflow details, where four modules are introduced. In the next section, we describe the COVID-19 datasets and the network training implementation and present the experimental results. In Section 5, we highlight several discussion points regarding our work and future research directions. Finally, we conclude the paper in Section 6.
Related works
Because of their fast data acquisition, X-ray and CT scans are widely applied to acquire imaging evidence for radiologists. Because COVID-19 shows quite similar manifestations in images, AI-assisted diagnosis is in high demand in medical imaging. In this section, we introduce several works based on X-ray and CT-based scans intended to perform COVID-19 diagnosis.
X-ray-based screening of COVID-19
Although the sensitivity of X-ray images is less than that of CT images for chest sites, it is usually employed as the typical first-line imaging modality. Via a chest X-ray, patients infected with COVID-19 frequently exhibit bilateral low-zone consolidation that peaks 10–12 days from symptom onset [9]. Several approaches to COVID-19 classification have been explored. Narin et al. [10] proposed three different classical CNN-based models, ResNet50 [11], InceptionV3 [12] and InceptionResNetV2 [13], to predict COVID-10-infected patients from chest X-ray radiographs. Apostolopoulos et al. [14] introduced transfer learning [15] with CNNs for automatic detection of COVID-19 using a collection of 1,427 X-ray images. Zhang et al. [16] studied a deep learning method with anomaly detection using 14 public chest X-ray datasets and achieved an accuracy of 96% for COVID-19 cases. Hemdan et al. [17] compared the classification performances of 7 deep models, including VGG19 [18], DenseNet201 [19], ResNetV2, Inception V3, InceptionResNetV2, Xception [20] and MobileNetV2 [21] and found that VGG19 and DenseNetV2 achieved better accuracy, while MobileNetV2 obtained the fastest testing time. Sethy et al. [22] conducted statistical analysis and showed that ResNet30 plus SVM achieved a superior classification performance; their best model achieved an accuracy of 95.3% for COVID-19 detection. Zhang et al. [16] developed detection models using 1,531 X-ray images that detected COVID-19 cases with 96% accuracy and non-COVID-19 cases with an accuracy of 70.65%.
CT-based screening of COVID-19
Because characteristic CT imaging patterns are employed in the diagnosis of COVID-19 patients in Hubei, China, CT findings have been gradually become recommended because they supply major evidence for early diagnosis and for assessing the course of the disease [23]. Li et al. [24] proposed CT visual quantitative analysis to explore the latent relationship between COVID-19 classification and imaging manifestations. Wang et al. [5] proposed an Inception migration-learning method and achieved an overall accuracy of 73.1% on the testing dataset. Song et al. [25] developed a deep learning-based CT diagnosis system to identify patients infected with COVID-19 that achieved an excellent AUC of 0.99. Barstugan et al. [26] applied support vector machines (SVMs) [27] and several feature extraction methods, including the grey level co-occurrence matrix (GLCM) [28, 29], local directional pattern (LDP) [30–32], grey level run length matrix (GLRLM) [33, 34], grey level size zone matrix (GLSZM) [35], and discrete wavelet transform (DWT) [36] algorithms, and obtained a classification accuracy of 99.68%.
Methods
In this section, we first introduce 3D CT image sequences and clinical symptoms. Then, we provide an overview of the model framework of FaNet. Finally, the parameter selection details are elaborated.
3D CT image sequences and clinical symptoms
We applied both 3D CT image sequences and clinical symptoms from COVID-19 patients to obtain fast clinical assessments. Instead of selecting single CT images to accomplish prediction, we considered that image sequences could provide more spatial information. In addition, in practice, this approach allows radiologists to process the CT image directly without having to select a specific single image. The usage of CT image sequences can also improve fault tolerance for clinical assessment. Similar to video classification [37, 38] or action recognition [39–41], we output specific classes based on the image sequences. In terms of clinical symptoms, several works [42, 43] have shown that latent relationships exist between the ultimate clinical assessment and COVID-19 patient symptoms. Meanwhile, the clinical symptoms are easily accessible, which helps in acquiring fast clinical assessment when clinical symptoms are treated as auxiliary information for CT image sequences. Figure 3 shows the statistical distribution of clinical symptoms for clinical severity assessment based on 209 COVID-19 patients (194 slight cases and 15 severe cases). Based on observation, cough and severe assessment are closely related. Among these patients, some of them expressed no obvious symptoms. For these non-symptomatic patients, the CT image sequence could be the critical discriminatory information. By introducing information from both CT images and symptoms, we are able to perform a fast clinical assessment for COVID-19.
Fig. 3.

The statistical distribution of clinical symptoms (fever, cough, muscle ache, fatigue, headache, nausea, diarrhea, stomachache and dyspnea) for clinical severity assessments was based on confirmed cases for COVID-19
A CT image sequence with a data shape of h × w × c × k first needs to be processed into a 3D matrix with a data shape of h × w × k, where h, w and c represent the height, width and channels of a CT image, respectively, and k represents the length of the image sequence. Because the number of channels for the CT image is 1, this process can be considered as dimensionality reduction, unlike in natural images, where the number of channels in the processed matrix must be considered as k. Thus, this task can be considered as a problem similar to the image classification [11, 18, 19, 44–46].
For the clinical symptoms, we adopted 11 symptoms to act as prior information, including fever, cough, muscle ache, fatigue, headache, nausea, diarrhoea, stomachache and dyspnea. If the patients is with the certain symptom, the certain symptoms are encoded as 1. Otherwise, the responding symptoms are set as 0. In addition, we adopted patient gender and age as parts of the extra information joined the symptoms. Then, we converted this prior information into a vector for each COVID-19 patient.
Fast assessment network (FaNet)
To enable fast and accurate diagnosis and severity assessments for COVID-19, we designed our networks based on both CT image sequences x and clinical symptoms y from patients. As shown in Fig. 2b, the model framework consists of 4 modules: encoding for symptoms, feature extraction from CT image sequences, fusion, and prediction. The symptom and feature extraction modules use two feature streams—the clinical symptoms and the CT image sequences, respectively. Next, the fusion module fuses the outputs of these two streams into a single fused feature. Finally, the prediction module predicts the clinical assessment based on the fused feature. As shown in Fig. 4, more framework details are given. Note that our network could conduct two tasks, including diagnosis and severity assessment. The entire framework can be formulated as follows:
| 1 |
where G(⋅) represents our network. “Task 1” is related to the diagnosis assessment for COVID-19. Similar to “Task 1”, the severity assessment of COVID-19 is represents as “Task 2” as follows:
| 2 |
where G(⋅) represents our network.
Fig. 4.

Network structure details of the proposed FaNet. “×” denotes element-wise product operation and “ + ” denotes element-wise add operation. Symptoms, so as genders and ages of patients, are shared in feature extraction as the pattern of prior information. The channel average pooling and max pooling are used to shrink the multi-dimensional tenor into a vector, which replaces fully-connection layers to predict the certain diagnosis and severity assessments
Symptom-fused channel attention modules
To fuse symptom prior information, we combine the shared symptoms information during the feature extraction. Inspired by channel attention [47, 48] and self-attention [49, 50], the symptom-fused channel attention module (SCAM) is designed. Firstly, two convolution layers in SCAM are employed to extract shallow feature Fs. The image size reduces half through max pooling and The channel average pooling is used to gain channel-wise feature Fc.
| 3 |
where Hcap denotes the channel average pooling operation. For the shared symptoms, a convolution layer with filter size 1 × 1 is used to keep the length of expanded symptom vector Fe same with Fc.
| 4 |
where He denotes the convolution operation and y denotes the original symptom vector. In terms of channel attention FCA for Fs, it could be formulated as follows:
| 5 |
where Hca denotes the convolution layer with filter size 1 × 1 and Sigmoid(⋅) denotes the activation functions to map value into [0,1]. “*” denotes element-wise product operation. To avoid information loss, the skip connection is utilized. At last, the output of i-th SCAM is formulated as follows.
| 6 |
where denotes the input information for i-th SCAM and “*” denotes element-wise product operation.
Prediction module
In our prediction module, the channel pooling operations are introduced to replace fully connection layers to shrink parameters. For better performance, the channel average and max pooling are both employed in prediction module. To combine these channel-wise features, concatenation are used. Then, a convolution with filter size to squeeze the combined channel-wise features half. Finally, a convolution is used to predict the diagnosis assessment and another convolution for predicting severity assessment. This prediction processes could be formulated as follows:
| 7 |
where FSK denotes the shrink channel-wise features. HSK denotes the convolution to shrink combined channel-wise features. Hcap and Hcmp denotes the channel average pooling and channel max pooling. Mn denotes the output data of the last SCAM. Based on FSK, the prediction outcome of diagnosis assessment z1 is formulated as
| 8 |
where Hd denotes the convolution layer with filter size 1 × 1. Similar to z1, the prediction output of severity assessment z2 is formulated as:
| 9 |
where Hs denotes the convolution layer with filter size 1 × 1.
Parameter selection
In this part, the parameter selection details are illustrated. For the input data, the input CT image data shape are set as 512 × 512 × 160, where h = 512, w = 512 and h = 160. Due to the CT image slice thickness is 1mm, the length of sequences could cover most of the lung sites for patients. The convolution before SCAM is fixed with kernel size 1 × 1 × 160 × 32, which shrink the channel number from 160 to 32. As is shown in Tables 2 and 3, the network parameter details are described. In terms of the number of SCAM, we set this parameter as 5, which is validated to gain best performance in Section 4.4.
Table 2.
Network parameter details for symptom-fuse channel attention module (SCAM)
| Component | Kernel size |
|---|---|
| Convolution layer 1 | 3 × 3 × 32 × 16 |
| Convolution layer 2 | 3 × 3 × 16 × 32 |
| Convolution layer 3 (He) | 1 × 1 × 11 × 32 |
| Convolution layer 4 (Hca) | 1 × 1 × 32 × 32 |
Table 3.
Network parameter details for prediction module
| Component | Kernel size |
|---|---|
| Convolution layer 1 (HSK) | 1 × 1 × 64 × 32 |
| Convolution layer 2 (Hd) | 1 × 1 × 32 × 2 |
| Convolution layer 2 (Hs) | 3 × 3 × 32 × 3 |
Experiments
In this section, we evaluate the performance of our method. First, we describe the datasets, which include data from 209 COVID-19 patients and 207 normal patients. Next, the data augmentation and network training implementation details are elaborated. Finally, we report the experimental results and ablation studies.
Patient data studies
We acquired 209 COVID-19 patient data and 207 normal patient data from Guizhou General People’s Hospital and the second Xiangya Hospital. The ages of the patients ranged from 8 to 84. The lengths of the CT image sequences ranged from 202 to 653. We split the data into groups, with 300 patients for training and 116 for testing. Because one input to our method consists of CT image sequences, these patient data were cut into multiple sequences of the same length 160 with uniform sampling, which covers the most parts of lung site. The other input is the vector of clinical symptoms for each corresponding image sequence. The CT images were obtained using a Siemens CT scanner with a slice thickness of 1.0 mm and a reconstruction matrix size of 512 × 512. The scan voltage ranges from 110 to 130 KeV. In addition, the distances from the source to the detector and to the patient were set to 940 and 535, respectively. To reduce file number of CT images, the patient data was exported as video files with an image size of 512 × 512 using Radiant software.
Data augmentation and network training implementation
We conducted data augmentation for our collected patient data. For patient data testing, we randomly selected 116 image sequences total patient’s data, which would not exist in training datasets. Regarding the training data, we randomly selected the initial index of the image sequence from the patient data during each epoch, which can improve the data diversity. Regarding data augmentation, we conducted horizontal flip, vertical flip, and rotation (90∘, 180∘ and 270∘) operations to acquire richer samples.
The Adam optimizer [51] with an initial learning rate of 0.001 was adopted to minimize the loss function. We trained the entire network using 1,000 epochs during the ablation studies and to conduct parameter selection. The network was implemented in PyTorch on a computer equipped with a TITAN 2080Ti GPU. The runing time on the test dataset for each clinical assessment was less than 104 s.
Experimental results
To validate the effectiveness of our proposed method, we design several versions based on our proposed method shown in Table 4. Inspired by deep neural networks for image classification in natural domain, we design our proposed methods in 3D CT image sequences and introducing the clinical symptom prior information. Thus, we compare our method with several methods, including AlexNet [52], ResNet [11], MobileNet [21], VGG [18], SeNet [53] and DenseNet [19], to evaluate the performance. Due to the new scene in CT images for these comparison methods, we redesign these methods with similar parameter counts (shown in Table 5) and adopt the fully connection layers for prediction outcomes. Note that the application of both channel average and max pooling avails the significant reduction of the amount of network parameters compared to fully connection layers. After training models for the same number of epochs, the accuracy both on diagnosis assessment and severity assessment of FaNet was considerably better than that of the other methods on the test datasets (shown in Table 6).
Table 4.
Several methods based on FaNet and their descriptions
| Methods | Descriptions |
|---|---|
| FaNet-Random | FaNet with random symptoms input; |
| FaNet-Res | FaNet with only skip connection in SCAMs; |
| FaNet-Rca | FaNet with only residual channel attention in SCAMs; |
| FaNet-WA | FaNet without channel average pooling in prediction module; |
| FaNet-WM | FaNet without channel max pooling in prediction module. |
Table 5.
Parameter counts for different methods
| Methods | AlexNet | ResNet | MobileNet | Vgg | SeNet | DenseNet | FaNet |
|---|---|---|---|---|---|---|---|
| Parameter Counts | 3.365 × 10⁷ | 3.366 × 10⁷ | 3.361 × 10⁷ | 3.365 × 10⁷ | 3.366 × 10⁷ | 3.370 × 10⁷ | 1.020 × 10⁵ |
Table 6.
Accuracy on diagnosis and severity assessments for different methods
| Methods | AlexNet | ResNet | MobileNet | Vgg | SeNet | DenseNet | FaNet |
|---|---|---|---|---|---|---|---|
| Diagnosis assessment | 46.55.17% | 66.38% | 53.45% | 55.17% | 56.03% | 53.45% | 98.28% |
| Severity assessment | 45.69.86% | 66.38.93% | 53.45% | 50.86% | 54.31% | 45.69% | 94.83% |
Ablation studies
We conducted an ablation study to compare model performances under different number of symptom-fused channel attention module and validate the effectiveness of introducing symptom information.
The number of symptom-fused channel attention module
The ablation studies are conducted to compare the performance under different number (3, 4, 5, 6, 7) of SCAM. As is shown in Fig. 5, we find the accuracy on both diagnosis assessment and severity assessment is best under 5 SCAMs when same training epochs are adopted. Besides, the networks parameter counts increases when applying more SCAMs. While, the more parameter counts may lead to worse fitting results under limit datasets.
Fig. 5.

Accuracy for different parameter selection on the number of symptom-fused channel attention module (SCAM)
The effectiveness of clinical symptom prior information
We design two version methods, including FaNet-Res and FaNet-Rca, which are not fused with symptom prior information under same training epochs. As is shown in Fig. 6, FaNet achieves obviously better performance than other two methods. The simple channel attention may not leads to improve the accuracy. While, the self-attention introduced the symptom could avail the performance, which proves the effectiveness of clinical symptom prior information. Besides, we directly input random symptom information for trained FaNet and it leads worse performance (shown in Table 7), which also proves the symptom plays an important role in improving performance.
Fig. 6.
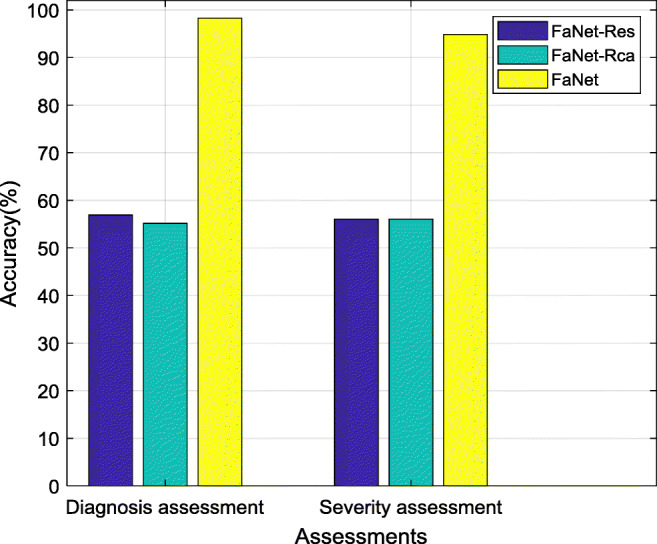
Accuracy comparison among FaNet-Res, FaNet-Rca and FaNet
Table 7.
Accuracy comparison between FaNet-Random and FaNet
| Methods | FaNet-Random | FaNet |
|---|---|---|
| Diagnosis assessment | 46.55% | 98.28% |
| Severity assessment | 45.69% | 94.83% |
The effectiveness of channel pooling in prediction module
The prediction module in FaNet are equipped with both channel average and max pooling operations to shrink the feature maps so as to help following two prediction tasks. Based on this original version, we design another two versions, including FaNet-WA and WM, which only adopt only channel average pooling or channel max pooling operation. To validate the effectiveness of channel pooling, we train these three models under same epochs. As is shown in Fig. 7, FaNet gains better performance than other models, which demonstrates that the both employing channel average and max pooling operations in our proposed network could achieve better performance rather than applying only one channel pooling operation.
Fig. 7.
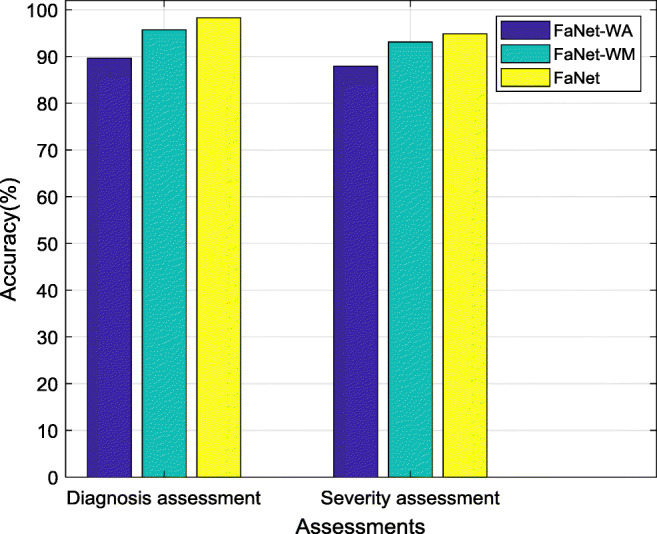
Accuracy comparison among FaNet-WA, FaNet-WM and FaNet
Limitations and future works
We first discuss the setting regarding the length of the CT image sequences. To cover the lung site, we set the length of CT sequence k as 160. A longer length would require more time to process the CT image sequence; thus, a tradeoff exists between accuracy and running time. Second, motivated by the need for fast clinical assessments of COVID-19, we introduced the clinical symptoms from patients as prior information based on CT image sequences because that symptom information is quickly and readily accessible. However, we note that other prior information could also be considered that might achieve better performance, such as the laboratory results from real-time RT-PCR and sequencing of nucleic acids from the virus [54]. In future works, this problem could be explored by introducing other network technologies such as recurrent neural networks [55] to extract more latent spatial information. What’s more, the total amount of data is somewhat limited since the experiment in this work involved the data of only 416 patients with or without COVID-19. In future work, we will collect more patient data and seek to further improve these results. Due to the addition of new data, we would consider more strategies to avoid potential overfitting, such as cross validation or introducing the weight regularization.
Conclusion
In conclusion, this paper proposed a fast assessment network for both diagnosis and severity assessment of COVID-19. Based on previous findings for patients with COVID-19, CT image scans can form an effective solution for rapid clinical assessments. On the other hand, patient clinical symptoms also show a latent relationship with the final assessment. Thus, we explored a fast severity assessment network that considers both 3D CT image sequences and clinical symptoms. The CT image sequences are much simpler for radiologists to use because they do not need to select a specific individual CT image and the data of the symptoms can be easily accessed. Ablations studies validate the effectiveness of introducing symptom prior information and network designing. The experimental results illustrate that FaNet achieves fast clinical assessment for COVID-19 with an accuracy of 98.28% on diagnosis assessment and 94.83% on severity assessment. In future work, we will seek to further improve current results.
Acknowledgements
The authors would like to thank the editor and anonymous reviewers for their constructive comments and suggestions.
Biographies
Zhenxing Huang
received his B.S. degree in network engineering from the South-Central University for Nationalities in 2016. He is currently pursuing a Ph.D. degree at Huazhong University of Science and Technology (HUST). He is engaged in research as a visiting student at the Shenzhen Institutes of Advanced Technology, Chinese Academy of Sciences. His research interests include CT imaging and image processing.
Xinfeng Liu
received the M.S. degree in medical imaging from Zunyi Medical University, China, in 2012. He is currently an attending physician at the Guizhou Provincial People’s Hospital of China. His research interests include cardiovascular disease diagnosis, medical image processing and segmentation.

Rongpin Wang
received a Ph.D. degree in medical imaging from Southern Medical University, China, in 2010. He is currently a chief physician at the Guizhou Provincial People’s Hospital of China. His research interests include diffusion tensor imaging of fetal brain development and developmental disorders.

Mudan Zhang
received the M.S. degree in clinical medicine from DaLi University, China, in 2015. She is now working on her Ph. D. on Medical Information Engineering at Guizhou University of China. Her research interests include medical artificial intelligence and radiomics applied in tumor.
Xianchun Zeng
received the M.D. degree in medical image from Third Military Medical University, China, in 2018. He is currently a chief physician at Guizhou Provincial People’s Hospital of China. His research interests include abdominal imaging.

Jun Liu
received his M.S. degree in medical imaging and Ph.D. degree in psychologic medicine from the Central South University, China, respectively in 2002 and 2009. He is currently the director of the Department of Radiology at the Second Xiangya Hospital of Central South University. His research interests include neuroimaging and medical big data analyzing.

Yongfeng Yang
received his Ph.D. degree in nuclear physics from Kyushu University, Japan, in 2001. He is currently a professor at the Shenzhen Institutes of Advanced Technology, Chinese Academy of Sciences. His research interests include PET molecular imaging instruments.

Xin Liu
received his Ph.D. degree in imaging and nuclear medicine from PLA General Hospital, China, in 2006. He is currently a professor at the Shenzhen Institutes of Advanced Technology, Chinese Academy of Sciences. His research interests include magnetic resonance imaging technology.

Hairong Zheng
received his Ph.D. degree in biomedical engineering from the University of Colorado, United States, in 2006. He is currently a professor at the Shenzhen Institutes of Advanced Technology, Chinese Academy of Sciences. His research interests include medical imaging technology and instruments.

Dong Liang
received his Ph.D. degree in pattern recognition and intelligent systems from Shanghai Jiaotong University, China, in 2006. He is currently a professor at the Shenzhen Institutes of Advanced Technology, Chinese Academy of Sciences. His research interests include signal processing, machine learning and biomedical imaging.

Zhanli Hu
received his Ph.D. degree in computer application technology from the Chinese Academy of Sciences University, China, in 2014. He is currently an Associate Professor at the Shenzhen Institutes of Advanced Technology, Chinese Academy of Sciences. His research interests include CT and PET imaging and medical artificial intelligence.

Footnotes
The COVID-CT dataset is available at https://github.com/UCSD-AI4H/COVID-CT
This article belongs to the Topical Collection: Artificial Intelligence Applications for COVID-19, Detection, Control, Prediction, and Diagnosis
This work was supported by the Guangdong Special Support Program of China (2017TQ04R395), the National Natural Science Foundation of China (3202204281871441), the Shenzhen International Cooperation Research Project of China (GJHZ20180928115 824168), the Guangdong International Science and Technology Cooperation Project of China (2018A050506064), the Natural Science Foundation of Guangdong Province in China (2020A1515010733), the Chinese Academy of Sciences Key Laboratory of Health Informatics in China (2011DP173015), the Guizhou Science and Technology Project (QKHZC[2020]4Y002), and the Guiyang Science and Technology Project (ZKXM [2020]).
Zhenxing Huang and Xinfeng Liu these authors as the co-first author contributed equally to this work.
Publisher’s note
Springer Nature remains neutral with regard to jurisdictional claims in published maps and institutional affiliations
Contributor Information
Rongpin Wang, Email: wangrongpin@126.com.
Dong Liang, Email: dong.liang@siat.ac.cn.
Zhanli Hu, Email: zl.hu@siat.ac.cn.
References
- 1.Fang Y, Zhang H, Xu Y, et al. CT manifestations of two cases of 2019 novel coronavirus (2019-nCoV) pneumonia[J] Radiology. 2020;295(1):208–209. doi: 10.1148/radiol.2020200280. [DOI] [PMC free article] [PubMed] [Google Scholar]
- 2.Huang C, Wang Y, Li X, Ren L, Zhao J, Hu Y, Zhang L, Fan G, Xu J, Gu X, et al. Clinical features of patients infected with 2019 novel coronavirus in Wuhan, China. Lancet. 2020;395(10223):497–506. doi: 10.1016/S0140-6736(20)30183-5. [DOI] [PMC free article] [PubMed] [Google Scholar]
- 3.Li L, Qin L, Xu Z, et al. Using artificial intelligence to detect COVID-19 and community-acquired pneumonia based on pulmonary CT: evaluation of the diagnostic accuracy. Radiology. 2020;296(2):E65–E71. doi: 10.1148/radiol.2020200905. [DOI] [PMC free article] [PubMed] [Google Scholar]
- 4.Xu X, Jiang X, Ma C, Du P, Li X, Lv S, Yu L, Chen Y, Su J, Lang G et al (2020) Deep learning system to screen coronavirus disease 2019 pneumonia. arXiv preprint arXiv:2002.09334 [DOI] [PMC free article] [PubMed]
- 5.Wang S, Kang B, Ma J, Zeng X, Xiao M, Guo J, Cai M, Yang J, Li Y, Meng X et al (2020) A deep learning algorithm using ct images to screen for corona virus disease (covid-19). medRxiv [DOI] [PMC free article] [PubMed]
- 6.Shi H, Han X, Jiang N, Cao Y, Alwalid O, Gu J, Fan Y, Zheng C (2020) Radiological findings from 81 patients with covid-19 pneumonia in Wuhan, China: a descriptive study. The Lancet Infectious Diseases [DOI] [PMC free article] [PubMed]
- 7.Pan F, Ye T, Sun P, et al. Time course of lung changes at chest CT during recovery from coronavirus disease 2019 (COVID-19) Radiology. 2020;295(3):715–721. doi: 10.1148/radiol.2020200370. [DOI] [PMC free article] [PubMed] [Google Scholar]
- 8.Zhao J, Zhang Y, He X, Xie P (2020) Covid-ct-dataset: a ct scan dataset about covid-19. arXiv preprint arXiv:2003.13865
- 9.Wong HYF, Lam HYS, Fong AH, Leung ST, Chin TW, Lo CSY, Lui MM, Lee JCY, Chiu KW, Chung TW, Lee EYP, Wan EYF, Hung IFN, Lam TPW, Kuo MD, Ng MY. Frequency and distribution of chest radiographic findings in patients positive for COVID-19. Radiology. 2020;296(2):E72–E78. doi: 10.1148/radiol.2020201160. [DOI] [PMC free article] [PubMed] [Google Scholar]
- 10.Narin A, Kaya C, Pamuk Z (2020) Automatic detection of coronavirus disease (covid-19) using x-ray images and deep convolutional neural networks. arXiv preprint arXiv:2003.10849 [DOI] [PMC free article] [PubMed]
- 11.He K, Zhang X, Ren S, Sun J (2016) Deep residual learning for image recognition. In: Proceedings of the IEEE conference on computer vision and pattern recognition, pp 770– 778
- 12.Szegedy C, Vanhoucke V, Ioffe S, Shlens J, Wojna Z (2016) Rethinking the inception architecture for computer vision. In: Proceedings of the IEEE conference on computer vision and pattern recognition, pp 2818–2826
- 13.Szegedy C, Ioffe S, Vanhoucke V, Alemi A A (2017) Inception-v4, inception-resnet and the impact of residual connections on learning. In: Thirty-first AAAI conference on artificial intelligence
- 14.Apostolopoulos ID, Mpesiana TA. Covid-19: automatic detection from x-ray images utilizing transfer learning with convolutional neural networks. Phys Eng Sci Med. 2020;43(2):635–640. doi: 10.1007/s13246-020-00865-4. [DOI] [PMC free article] [PubMed] [Google Scholar]
- 15.Tan C, Sun F, Kong T, Zhang W, Yang C, Liu C (2018) A survey on deep transfer learning. In: International conference on artificial neural networks, pp 270–279
- 16.Zhang J, Xie Y, Li Y, Shen C, Xia Y (2020) Covid-19 screening on chest x-ray images using deep learning based anomaly detection. arXiv preprint arXiv:2003.12338
- 17.Hemdan E E -D, Shouman M A, Karar M E (2020) Covidx-net: a framework of deep learning classifiers to diagnose covid-19 in x-ray images. arXiv preprint arXiv:2003.11055
- 18.Simonyan K, Zisserman A (2014) Very deep convolutional networks for large-scale image recognition. arXiv preprint arXiv:1409.1556
- 19.Huang G, Liu Z, Van Der Maaten L, Weinberger K Q (2017) Densely connected convolutional networks. In: Proceedings of the IEEE conference on computer vision and pattern recognition, pp 4700–4708
- 20.Chollet F (2017) Xception: deep learning with depthwise separable convolutions. In: Proceedings of the IEEE conference on computer vision and pattern recognition, pp 1251–1258
- 21.Sandler M, Howard A, Zhu M, Zhmoginov A, Chen L -C (2018) Mobilenetv2: inverted residuals and linear bottlenecks. In: Proceedings of the IEEE conference on computer vision and pattern recognition, pp 4510–4520
- 22.Sethy P K, Behera S K (2020) Detection of coronavirus disease (covid-19) based on deep features. Preprints vol 2020030300, p 2020
- 23.Zu ZY, Jiang MD, Xu PP, Chen W, Ni QQ, Lu GM, Zhang LJ. Coronavirus disease 2019 (covid-19): a perspective from China. Radiology. 2020;296(2):E15–E25. doi: 10.1148/radiol.2020200490. [DOI] [PMC free article] [PubMed] [Google Scholar]
- 24.Li K, Fang Y, Li W, et al. CT image visual quantitative evaluation and clinical classification of coronavirus disease (COVID-19) Eur Radiol. 2020;30:4407–4416. doi: 10.1007/s00330-020-06817-6. [DOI] [PMC free article] [PubMed] [Google Scholar]
- 25.Song Y, Zheng S, Li L, Zhang X, Zhang X, Huang Z, Chen J, Zhao H, Jie Y, Wang R et al (2020) Deep learning enables accurate diagnosis of novel coronavirus (covid-19) with ct images. medRxiv [DOI] [PMC free article] [PubMed]
- 26.Barstugan M, Ozkaya U, Ozturk S (2020) Coronavirus (covid-19) classification using ct images by machine learning methods. arXiv preprint arXiv:2003.09424
- 27.Hearst MA, Dumais ST, Osuna E, Platt J, Scholkopf B. Support vector machines. IEEE Intell Syst Appl. 1998;13(4):18–28. doi: 10.1109/5254.708428. [DOI] [Google Scholar]
- 28.Marceau DJ, Howarth PJ, Dubois J-MM, Gratton DJ, et al. Evaluation of the grey-level co-occurrence matrix method for land-cover classification using spot imagery. IEEE Trans Geosci Remote Sens. 1990;28(4):513–519. doi: 10.1109/TGRS.1990.572937. [DOI] [Google Scholar]
- 29.Gebejes A, Huertas R. Texture characterization based on grey-level co-occurrence matrix. Databases. 2013;9:10. [Google Scholar]
- 30.Jabid T, Kabir M H, Chae O (2010) Local directional pattern (ldp)—a robust image descriptor for object recognition. In: 2010 7th IEEE international conference on advanced video and signal based surveillance, pp 482–487
- 31.Jabid T, Kabir M H, Chae O (2010) Gender classification using local directional pattern (ldp). In: 2010 20th International conference on pattern recognition, pp 2162–2165
- 32.Jabid T, Kabir MH, Chae O. Robust facial expression recognition based on local directional pattern. ETRI J. 2010;32(5):784–794. doi: 10.4218/etrij.10.1510.0132. [DOI] [Google Scholar]
- 33.Albregtsen F, Nielsen B, Danielsen H E (2000) Adaptive gray level run length features from class distance matrices. In: Proceedings 15th international conference on pattern recognition. ICPR-2000, vol 3, pp 738–741
- 34.Dasarathy BV, Holder EB. Image characterizations based on joint gray level—run length distributions. Pattern Recognit Lett. 1991;12(8):497–502. doi: 10.1016/0167-8655(91)80014-2. [DOI] [Google Scholar]
- 35.Altazi BA, Zhang GG, Fernandez DC, Montejo ME, Hunt D, Werner J, Biagioli MC, Moros EG. Reproducibility of f18-fdg pet radiomic features for different cervical tumor segmentation methods, gray-level discretization, and reconstruction algorithms. J Appl Clin Med Phys. 2017;18(6):32–48. doi: 10.1002/acm2.12170. [DOI] [PMC free article] [PubMed] [Google Scholar]
- 36.Shensa MJ. The discrete wavelet transform: wedding the a trous and mallat algorithms. IEEE Trans Signal Process. 1992;40(10):2464–2482. doi: 10.1109/78.157290. [DOI] [Google Scholar]
- 37.Karpathy A, Toderici G, Shetty S, Leung T, Sukthankar R, Fei-Fei L (2014) Large-scale video classification with convolutional neural networks. In: Proceedings of the IEEE conference on computer vision and pattern recognition, pp 1725–1732
- 38.Abuelhaija S, Kothari N, Lee J, Natsev A, Toderici G, Varadarajan B, Vijayanarasimhan S (2016) Youtube-8m: a large-scale video classification benchmark. arXiv: Computer vision and pattern recognition
- 39.Tran D, Bourdev L, Fergus R, Torresani L, Paluri M (2015) Learning spatiotemporal features with 3d convolutional networks. In: Proceedings of the IEEE international conference on computer vision, pp 4489–4497
- 40.Simonyan K, Zisserman A (2014) Two-stream convolutional networks for action recognition in videos, pp 568–576
- 41.Ji S, Xu W, Yang M, Yu K. 3d convolutional neural networks for human action recognition. IEEE Trans Pattern Anal Mach Intell. 2013;35(1):221–231. doi: 10.1109/TPAMI.2012.59. [DOI] [PubMed] [Google Scholar]
- 42.Chung M, Bernheim A, Mei X, Zhang N, Huang M, Zeng X, Cui J, Xu W, Yang Y, Fayad ZA, et al. Ct imaging features of 2019 novel coronavirus (2019-ncov) Radiology. 2020;295(1):202–207. doi: 10.1148/radiol.2020200230. [DOI] [PMC free article] [PubMed] [Google Scholar]
- 43.Wang D, Hu B, Hu C, Zhu F, Liu X, Zhang J, Wang B, Xiang H, Cheng Z, Xiong Y, et al. Clinical characteristics of 138 hospitalized patients with 2019 novel coronavirus-infected pneumonia in Wuhan, China. JAMA. 2020;323(11):1061–1069. doi: 10.1001/jama.2020.1585. [DOI] [PMC free article] [PubMed] [Google Scholar]
- 44.Han D, Kim J, Kim J (2017) Deep pyramidal residual networks. In: Proceedings of the IEEE conference on computer vision and pattern recognition, pp 5927–5935
- 45.Wang F, Jiang M, Qian C, Yang S, Li C, Zhang H, Wang X, Tang X (2017) Residual attention network for image classification. In: Proceedings of the IEEE conference on computer vision and pattern recognition, pp 3156–3164
- 46.Gao S, Cheng M -M, Zhao K, Zhang X -Y, Yang M -H, Torr P H (2019) Res2net: a new multi-scale backbone architecture. In: IEEE transactions on pattern analysis and machine intelligence [DOI] [PubMed]
- 47.Zhang Y, Li K, Li K, Wang L, Zhong B, Fu Y (2018) Image super-resolution using very deep residual channel attention networks. In: Proceedings of the European conference on computer vision (ECCV), pp 286–301
- 48.Braun S, Neil D, Anumula J, Ceolini E, Liu S-C (2018) Multi-channel attention for end-to-end speech recognition. In: 2018 Interspeech
- 49.Zhang H, Goodfellow I, Metaxas D, Odena A (2019) Self-attention generative adversarial networks. In: International conference on machine learning, pp 7354–7363
- 50.Shen T, Zhou T, Long G, Jiang J, Pan S, Zhang C (2018) Disan: directional self-attention network for rnn/cnn-free language understanding. In: Thirty-second AAAI conference on artificial intelligence
- 51.Kingma DP, Ba J (2014) Adam: a method for stochastic optimization. arXiv preprint arXiv:1412.6980
- 52.Krizhevsky A, Sutskever I, Hinton G E (2012) Imagenet classification with deep convolutional neural networks. In: Advances in neural information processing systems, pp 1097–1105
- 53.Hu J, Shen L, Sun G (2018) Squeeze-and-excitation networks. In: Proceedings of the IEEE conference on computer vision and pattern recognition, pp 7132–7141
- 54.Chu DKW, Pan Y, Cheng SMS, Hui KPY, Krishnan P, Liu Y, Ng DYM, Wan CKC, Yang P, Wang Q, Peiris M, Poon LLM. Molecular diagnosis of a novel coronavirus (2019-nCoV) causing an outbreak of pneumonia. Clin Chem. 2020;01(4):549–555. doi: 10.1093/clinchem/hvaa029. [DOI] [PMC free article] [PubMed] [Google Scholar]
- 55.Chung J, Gulcehre C, Cho K, Bengio Y (2014) Empirical evaluation of gated recurrent neural networks on sequence modeling. arXiv: Neural and evolutionary computing