Abstract
Objects can be characterized according to a vast number of possible criteria (e.g. animacy, shape, color, function), but some dimensions are more useful than others for making sense of the objects around us. To identify these “core dimensions” of object representations, we developed a data-driven computational model of similarity judgments for real-world images of 1,854 objects. The model captured most explainable variance in similarity judgments and produced 49 highly reproducible and meaningful object dimensions that reflect various conceptual and perceptual properties of those objects. These dimensions predicted external categorization behavior and reflected typicality judgments of those categories. Further, humans can accurately rate objects along these dimensions, highlighting their interpretability and opening up a way to generate similarity estimates from object dimensions alone. Collectively, these results demonstrate that human similarity judgments can be captured by a fairly low-dimensional, interpretable embedding that generalizes to external behavior.
Introduction
We live in a world full of objects that we can identify, place into different categories, communicate and reason about, and act on in a meaningful manner. These abilities are remarkable, given that our ever-changing environment requires us to constantly map unique sensory information from the things around us to our internal representations of objects, categories, and concepts. In order to carry out this mapping and make sense of our world, we therefore need to determine the similarity between the sensory information emanating from the environment and our internal mental representations. Not surprisingly, similarity has been suggested to play an important role in elucidating the structure of our mental representations and can help explain how we recognize objects1,2, form categories3–5, structure our conceptual knowledge6–8, and predict the behavior of our visual world based on our experience9. Moreover, representational similarities offer a useful tool to relate behavior, computational models, and brain activity patterns10.
Despite the success of similarity and the wide use of similarity judgments for studying mental representations of objects, similarities alone offer only an indirect and mostly descriptive view of the format of our mental representations. They can inform us about the degree with which two or more representations are similar, but are agnostic as to what properties – or dimensions – each representation is made up of and what dimensions are shared between those representations. For example, most people would agree that a dog and a cow are more similar than a dog and a car, probably because dogs and cows share more relevant dimensions, such as being animate or natural, or soft. To understand the structure of our mental representations of objects, we need to identify those core dimensions that form the basis of our similarity judgments. These dimensions need to fulfill two criteria. First, they should be predictive of behavior and thus able to characterize the mental representational space. Second, to move beyond description and provide understanding, we need to identify a set of dimensions from the infinite number possible, that can be interpreted meaningfully.
Here, we present a computational model of mental representations of objects based on a large-scale assessment of human similarity judgments for natural object images. Prior experimental, neuropsychological, and neuroimaging evidence have led to the proposal of object dimensions such as animacy, manipulability, or real-world size11–13, but they only describe a selective and largely incomplete portion of our mental representational space. In contrast to traditional small-scale experimental approaches that often use artificial stimuli or words14, we collected a large number of similarity judgments for images of 1,854 different objects, capturing both visual and conceptual mental representations for a wide, representative range of natural objects. Rather than relying on explicit verbal reports of what object features are perceived as being relevant15,16, the model learns those dimensions directly from these similarity judgments.
Using this data-driven approach, we identify 49 dimensions underlying similarity judgments that lead to excellent prediction of both single trial behavior and similarity scores between pairs of objects. We demonstrate that the dimensions are meaningful and characterize the large-scale structure of our mental representations of objects. The model allows for the accurate prediction of categorization behavior, while within categories individual dimensions reflect object typicality. Finally, we demonstrate that human participants can use these dimensions directly to provide good predictions of similarity judgments, underscoring the interpretability of dimensions and offering a first step towards a generative model of perceived similarity of natural objects.
Results
To characterize the representational space of natural objects, we had to overcome several obstacles. First, we needed to identify a set of objects that is representative of the objects encountered in the real world. For that purpose, we chose the 1,854 objects in the THINGS database17, which we developed to provide a comprehensive list of living and non-living things according to their everyday use in the American English language. For each object, we chose a representative image that had been shown to be named consistently during the creation of this database. The advantage of using images rather than words is that they may provide additional purely perceptual information that is relevant for judging the similarity of objects and that might not come to mind immediately when using words.
Second, we needed to identify a task that would allow us to best quantify the similarity between pairs of objects. Ideally, this task would highlight all relevant dimensions contributing to the similarity of pairs of objects and would be independent of the context in which these objects appear3,18,19. While pairwise similarity ratings on a Likert scale are one of the most popular approaches, this task implicitly assumes that all dimensions relevant to judging the similarity of pairs of objects are always and immediately available to the observer, even when the objects are very dissimilar and may seem to have nothing in common. Here we chose a different approach, in which we concurrently presented three object images i, j and k in a triplet odd-one-out task (Fig. 1a). By choosing the odd-one-out object, participants indicate which pair of objects (i,j), (i,k), or (j,k) is the most similar among this set. The key benefit of this task is that the third object always serves as a context for the other two objects, thus highlighting the relevant dimensions that make two objects most similar. By repeatedly varying the third object for a given pair of objects, we are thereby implicitly sampling across a wide range of contexts in which the objects might be encountered. We can then express similarity as an approximation of the probability p(i,j) of participants choosing objects i and j together, irrespective of context. In addition, since the similarity of objects is determined with respect to all other objects, this naturally constrains the number of possible dimensions to those relevant for discriminating among objects20.
Fig. 1 |.
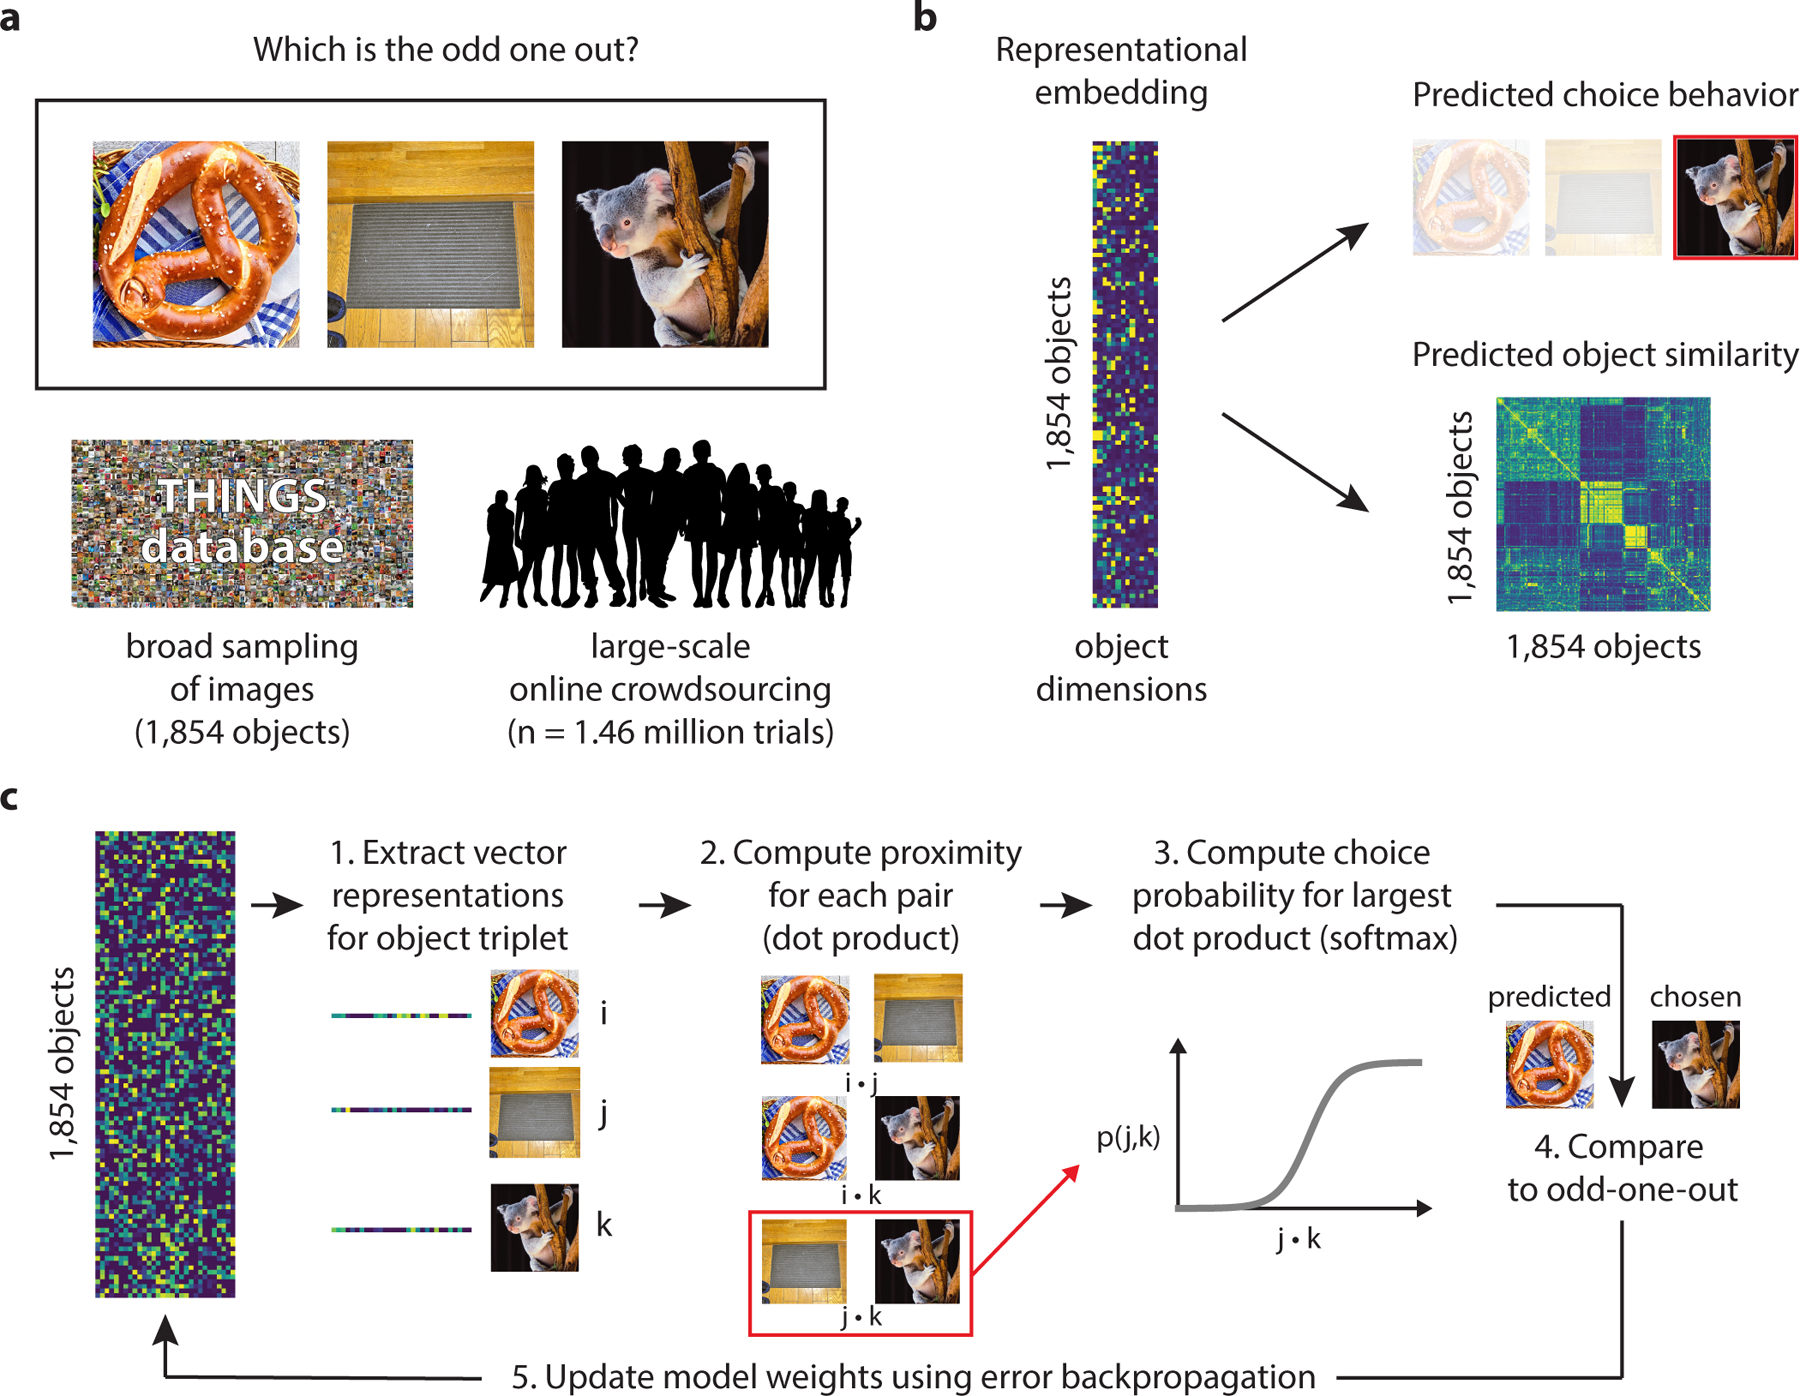
Task and modeling procedure for large-scale identification of mental object representations. For this figure, all images were replaced by images with similar appearance from the public domain. a We applied a triplet odd-one-out similarity task to images of the 1,854 objects in the THINGS database17 and collected a large number of ratings (1.46 million) using online crowdsourcing. The triplet odd-one-out task measures object similarity as the probability of choosing two objects together. This task evokes different minimal contexts as a basis for grouping objects together, which in turn emphasizes the relevant dimensions. b The goal of the modeling procedure was to learn an interpretable representational embedding that captures choice behavior in the odd-one-out task and predicts object similarity across all pairs of objects. Since only a subset of all possible triplets had been sampled (0.14 % of 1.06 billion possible combinations), this model additionally served to complete the sparsely sampled similarity matrix. c The model reflects the assumed cognitive process underlying the odd-one-out task. The embedding was initialized with random weights and would carry out predictions for which object pair was the most similar, based on the dot product. The prediction of the most similar pair is equivalent to predicting the remaining object as the odd-one-out. Model predictions were initially at chance (see example for a prediction that deviates from the choice) but learned gradually to predict behavioral choices. To allow for error backpropagation to the weights, the model was implemented as a shallow neural network.
Third, we needed to collect sufficient data with these objects and this task. While the odd-one-out task provides a principled approach for investigating similarity across contexts, for 1,854 objects it would require ~1.06 billion combinations of triplet judgments for a single estimate of the full similarity matrix. This would make conducting the odd-one-out task at this scale not feasible. However, if similarity depends only on a small number of independent dimensions, it should be possible to approximate the entire similarity matrix with only a fraction of those judgments. In this study, we sampled 1.46 million unique responses from 5,301 workers using the online platform Amazon Mechanical Turk (Fig. 1a), pooling all responses across workers (median number of responses per worker: 60). This corresponded to 0.14% of possible unique trials.
Our goal was to build a computational model that is capable of predicting behavior in the odd-one-out task, that captures the similarity between all pairs of objects, and that provides interpretable object dimensions. At the center of this model is a representational embedding, which is a quantitative characterization of objects as vectors in a multidimensional representational space. This embedding can be described as a matrix X, in which each column corresponds to a dimension and each row to an object vector across all dimensions (Fig. 1b). In the context of our model, this embedding should allow us to (1) predict behavior for individual trials not included in the training data and (2) generate the entire similarity matrix between all pairs of objects.
To create this embedding, we made two key assumptions. First, we assumed that dimensions are sparse, which is a reasonable assumption, given that not all dimensions are expressed in all objects. For example, for a putative dimension of animacy, a cardboard box would likely have a value of 0. Second, we assumed that dimensions are continuous and positive. Accordingly, the numeric value of an object for a given dimension could then be interpreted as the degree to which the dimension is expressed in the object, which should support interpretability21,22.
The modeling procedure was as follows (Fig. 1c). We initialized the model with 90 random dimensions, assuming that after model fitting, sparsity would reduce the dimensionality of the embedding to a smaller number. For a given triplet (i, j, k) for which we had collected a behavioral judgment, we then calculated the dot product between the embedding vectors of all three pairs of objects (i, j), (i, k), and (j, k). Accordingly, when two objects express high values for many dimensions, this measure yields a large number, while when one object expresses high values in dimensions for which the other object expresses low values, this measure yields a small number. Next, based on those three dot products, we estimated the probability of choosing one of the three pairs of objects in this context, which is equivalent to the third object being the odd-one-out. To this end, we used the softmax function which has been demonstrated to be suitable for relating representational proximity to similarity in the context of choice models and for estimating generalization behavior20,23. Finally, the difference between the predicted choice probability and the actual choice served as a model prediction error, which allowed us to adapt the model dimensions in proportion to this error (see Methods for details on this optimization procedure). The model was trained on 90% of the available trials, and the remaining 10% were later used for an independent assessment of model performance (see below).
A stable and predictive model of behaviorally measured similarity
As expected, due to the sparsity constraint, many of the 90 initial dimensions revealed values close to 0 and were discarded, leaving us with 49 dimensions. We then sorted the dimensions based on the sum of all dimension values across all objects, in descending order. Due to the stochastic nature of the modeling procedure, fitting the model repeatedly may lead to a different embedding and a slightly different number of dimensions. To estimate the stability of the model, we re-ran it 20 times with different random initializations (see Methods). Across those models, most dimensions exhibited high reproducibility (Pearson r > 0.9 in 34/49 dimensions, Pearson r > 0.6 in 46/49 dimensions), demonstrating that the procedure generated a highly stable and reproducible embedding (see Extended Data Figure 1 for a plot of the reproducibility of all dimensions). There was a strong correlation between the ranks of the dimensions and the dimension reproducibility (Spearman’s ρ: 0.75, p < 0.001, randomization test, 95% CI: 0.61–0.85), indicating that reproducibility of individual dimensions was driven mostly by their overall importance in the model.
Having demonstrated the reproducibility of the model dimensions, we next tested the predictive performance of the model. First, we estimated how well we could predict individual choices in the odd-one-out task using trials from the independent test set. To gain an understanding of the best possible prediction any model could achieve for these 1,854 objects given the variation present in the data (“noise ceiling”), we additionally sampled 1,000 randomly-chosen triplets 25 times and estimated the consistency of choices for each triplet across participants. Averaged across those triplets, the upper limit in fitting individual trial behavior from the data was 67.22% (± 1.04%). Overall, the model correctly predicted 64.60% (± 0.23%) of individual trials in the independent test data (Fig. 2a). This means that the model achieved 92.25% (± 1.50%) of the best possible accuracy at predicting behavior, demonstrating excellent predictive performance at the individual trial level given the noise in the data.
Fig. 2 |.

Predictiveness of the computational model for single trial behavioral judgments and similarity. a Model performance was evaluated by predicting choice behavior at the individual trial level. The noise ceiling denotes the maximal performance any model could achieve given the noise in the data and is determined by the consistency in participants’ responses to the same triplet. The performance of the model in predicting independent test data approached noise ceiling, demonstrating excellent predictive performance. Error bars and shaded areas denote 95% confidence intervals. b To estimate how well the model predicted behavioral similarity, a model-generated similarity matrix was compared to a fully-sampled behavioral similarity matrix for 48 diverse objects. Results reveal a close fit (Pearson r = 0.90, p < 0.001, randomization test, 95% CI: 0.88–0.91), demonstrating that most explainable variance was captured by the model.
To evaluate how well the model could predict behaviorally measured similarity, we next generated a fully-sampled similarity matrix of 48 diverse objects and compared it to the similarity matrix predicted by our model. Since we had sampled only a fraction of the 1,854 ⨉ 1,854 similarity matrix, the test data were insufficient for addressing how well the model could predict behaviorally measured similarity. To this end, we used online crowdsourcing to collect between two and three behavioral responses for each possible triplet of those 48 objects (43,200 choices) and calculated choice probabilities for each pair of objects as a measure of their similarity. To estimate the noise in the fully-sampled matrix, we calculated the reliability by splitting behavioral data in half and generating two split-half similarity matrices. Then, we computed a predicted similarity matrix using our computational model and compared it to both the full similarity matrix and each split. The predicted and measured similarity matrices are depicted in Fig. 2b. Both matrices were highly correlated (Pearson r = 0.90, p < 0.001, randomization test, 95% CI: 0.88–0.91), with the fit of each half again approaching noise ceiling (first half: r = 0.87, second half: r = 0.88, reliability: r = 0.91), demonstrating that the model was able to accurately reproduce behaviorally measured similarity even with very sparsely sampled data. This result highlights that despite the large number of objects and the complexity of natural stimuli, most of the large-scale representational structure of objects measured through human similarity judgments can be captured by a fairly low-dimensional embedding.
Are the model’s dimensions interpretable?
The results so far establish that the model dimensions are reproducible, can be used to accurately generate similarities between pairs of objects, and predict individual behavior close to the noise ceiling. However, they leave open the degree to which individual model dimensions can be interpreted meaningfully. If the dimensions are interpretable, then the objects with the highest weight in a given dimension should share certain properties that are easy to identify. In Fig. 3, we illustrate the interpretability for a subset of dimensions by displaying the object images with the largest weights in those dimensions.
Fig. 3 |.
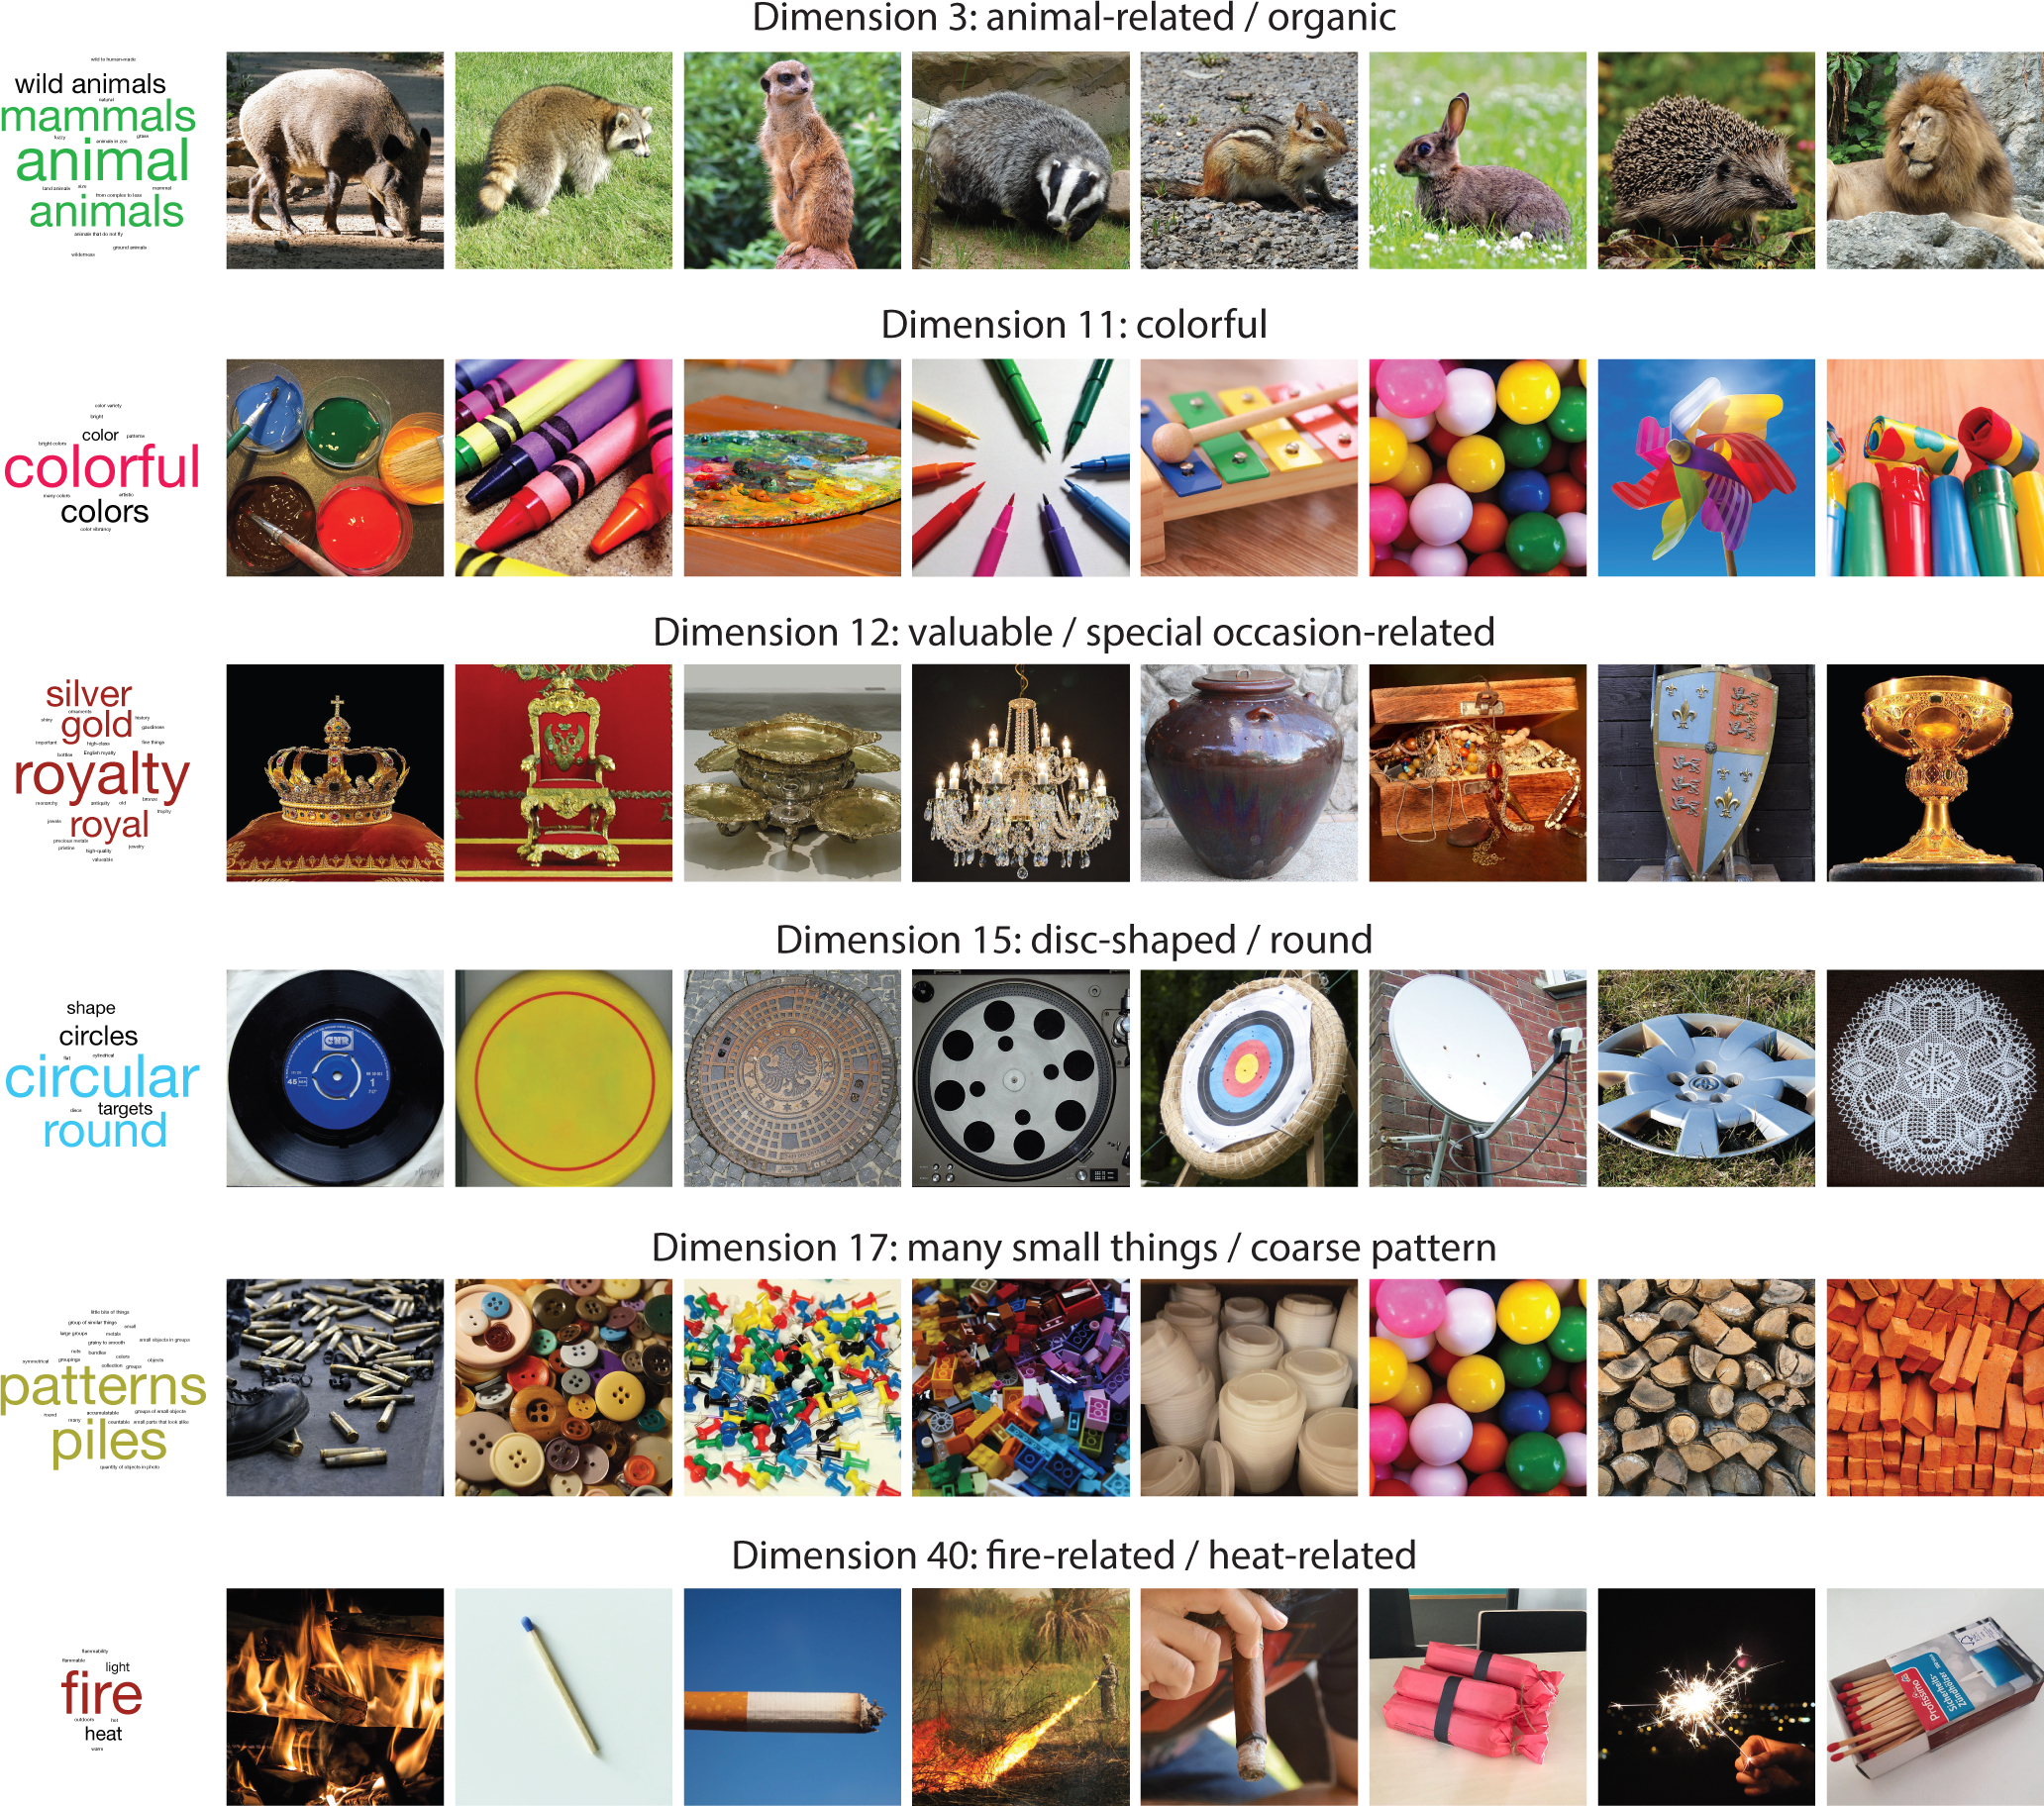
Example object dimensions illustrating their interpretability. The images reflect the objects with the highest weights along those dimensions. Word clouds illustrate the labels provided by 20 participants to visual exposure of those dimensions, weighted by their naming frequency. While responses tended to focus more on extreme examples, they generally exhibited a close correspondence to the dimension labels we generated, which are shown above each set of images (see Extended Data Figure 2 for labels and word clouds of all dimensions). For this figure, all images were replaced by images with similar appearance from the public domain.
Visual inspection of the dimensions suggests they are interpretable and reflect conceptual and perceptual properties of those objects. Among others, the model identified dimensions that appear to reflect the semantic membership of those objects, such as dimensions related to food, animals, furniture, vehicles, or tools. In addition, a number of dimensions appear to reflect other conceptual properties, such as being metallic or hard, valuable, disgusting, heat-related or water-related. Finally, some dimensions appear to reflect perceptual properties, such as the roundness of objects, their elongation, flatness, color, shininess, or patterned texture. For later use throughout this manuscript, we assigned intuitive labels to each dimension (e.g. “animal-related/organic”, “colorful”).
To explicitly test this interpretability in naïve observers, we asked 20 laboratory participants (15 female, 5 male) to provide labels for those dimensions, based on viewing objects sorted by their numeric value along each dimension. Since interpretability need not be limited to a single label, we visualized the naming results using word clouds, for which more frequently provided labels are displayed with a larger font. While participants’ descriptions varied and tended to focus more on extreme examples of a dimension, they exhibited a remarkably close correspondence to the labels we had assigned to the dimensions (see Extended Data Figure 2 for naming of all 49 dimensions).
Having established the interpretability of object dimensions, we can explore what dimensions a given object is composed of. For that purpose, in Fig. 4 we visualize a range of different objects using circular bar plots (“rose plots”), where the angle and color of a petal reflect the object dimension and the length of the petal reflects the degree to which the dimension is expressed in that object. For example, the image of noodles is characterized mostly by being food-related, repetitive and stringy. In contrast, the image of a rocket is characterized mostly by being transportation-related, flying-related, fire-related, artificial and shiny. This visualization demonstrates that some dimensions indeed reflect perceptual properties, since they are specific for the chosen object images: They may not show up for a different image of the same object and might have been missed completely if words had been chosen instead of images. In addition, the visualization demonstrates that objects are indeed characterized by a rather small number of dimensions (see below for a quantification).
Fig. 4 |.
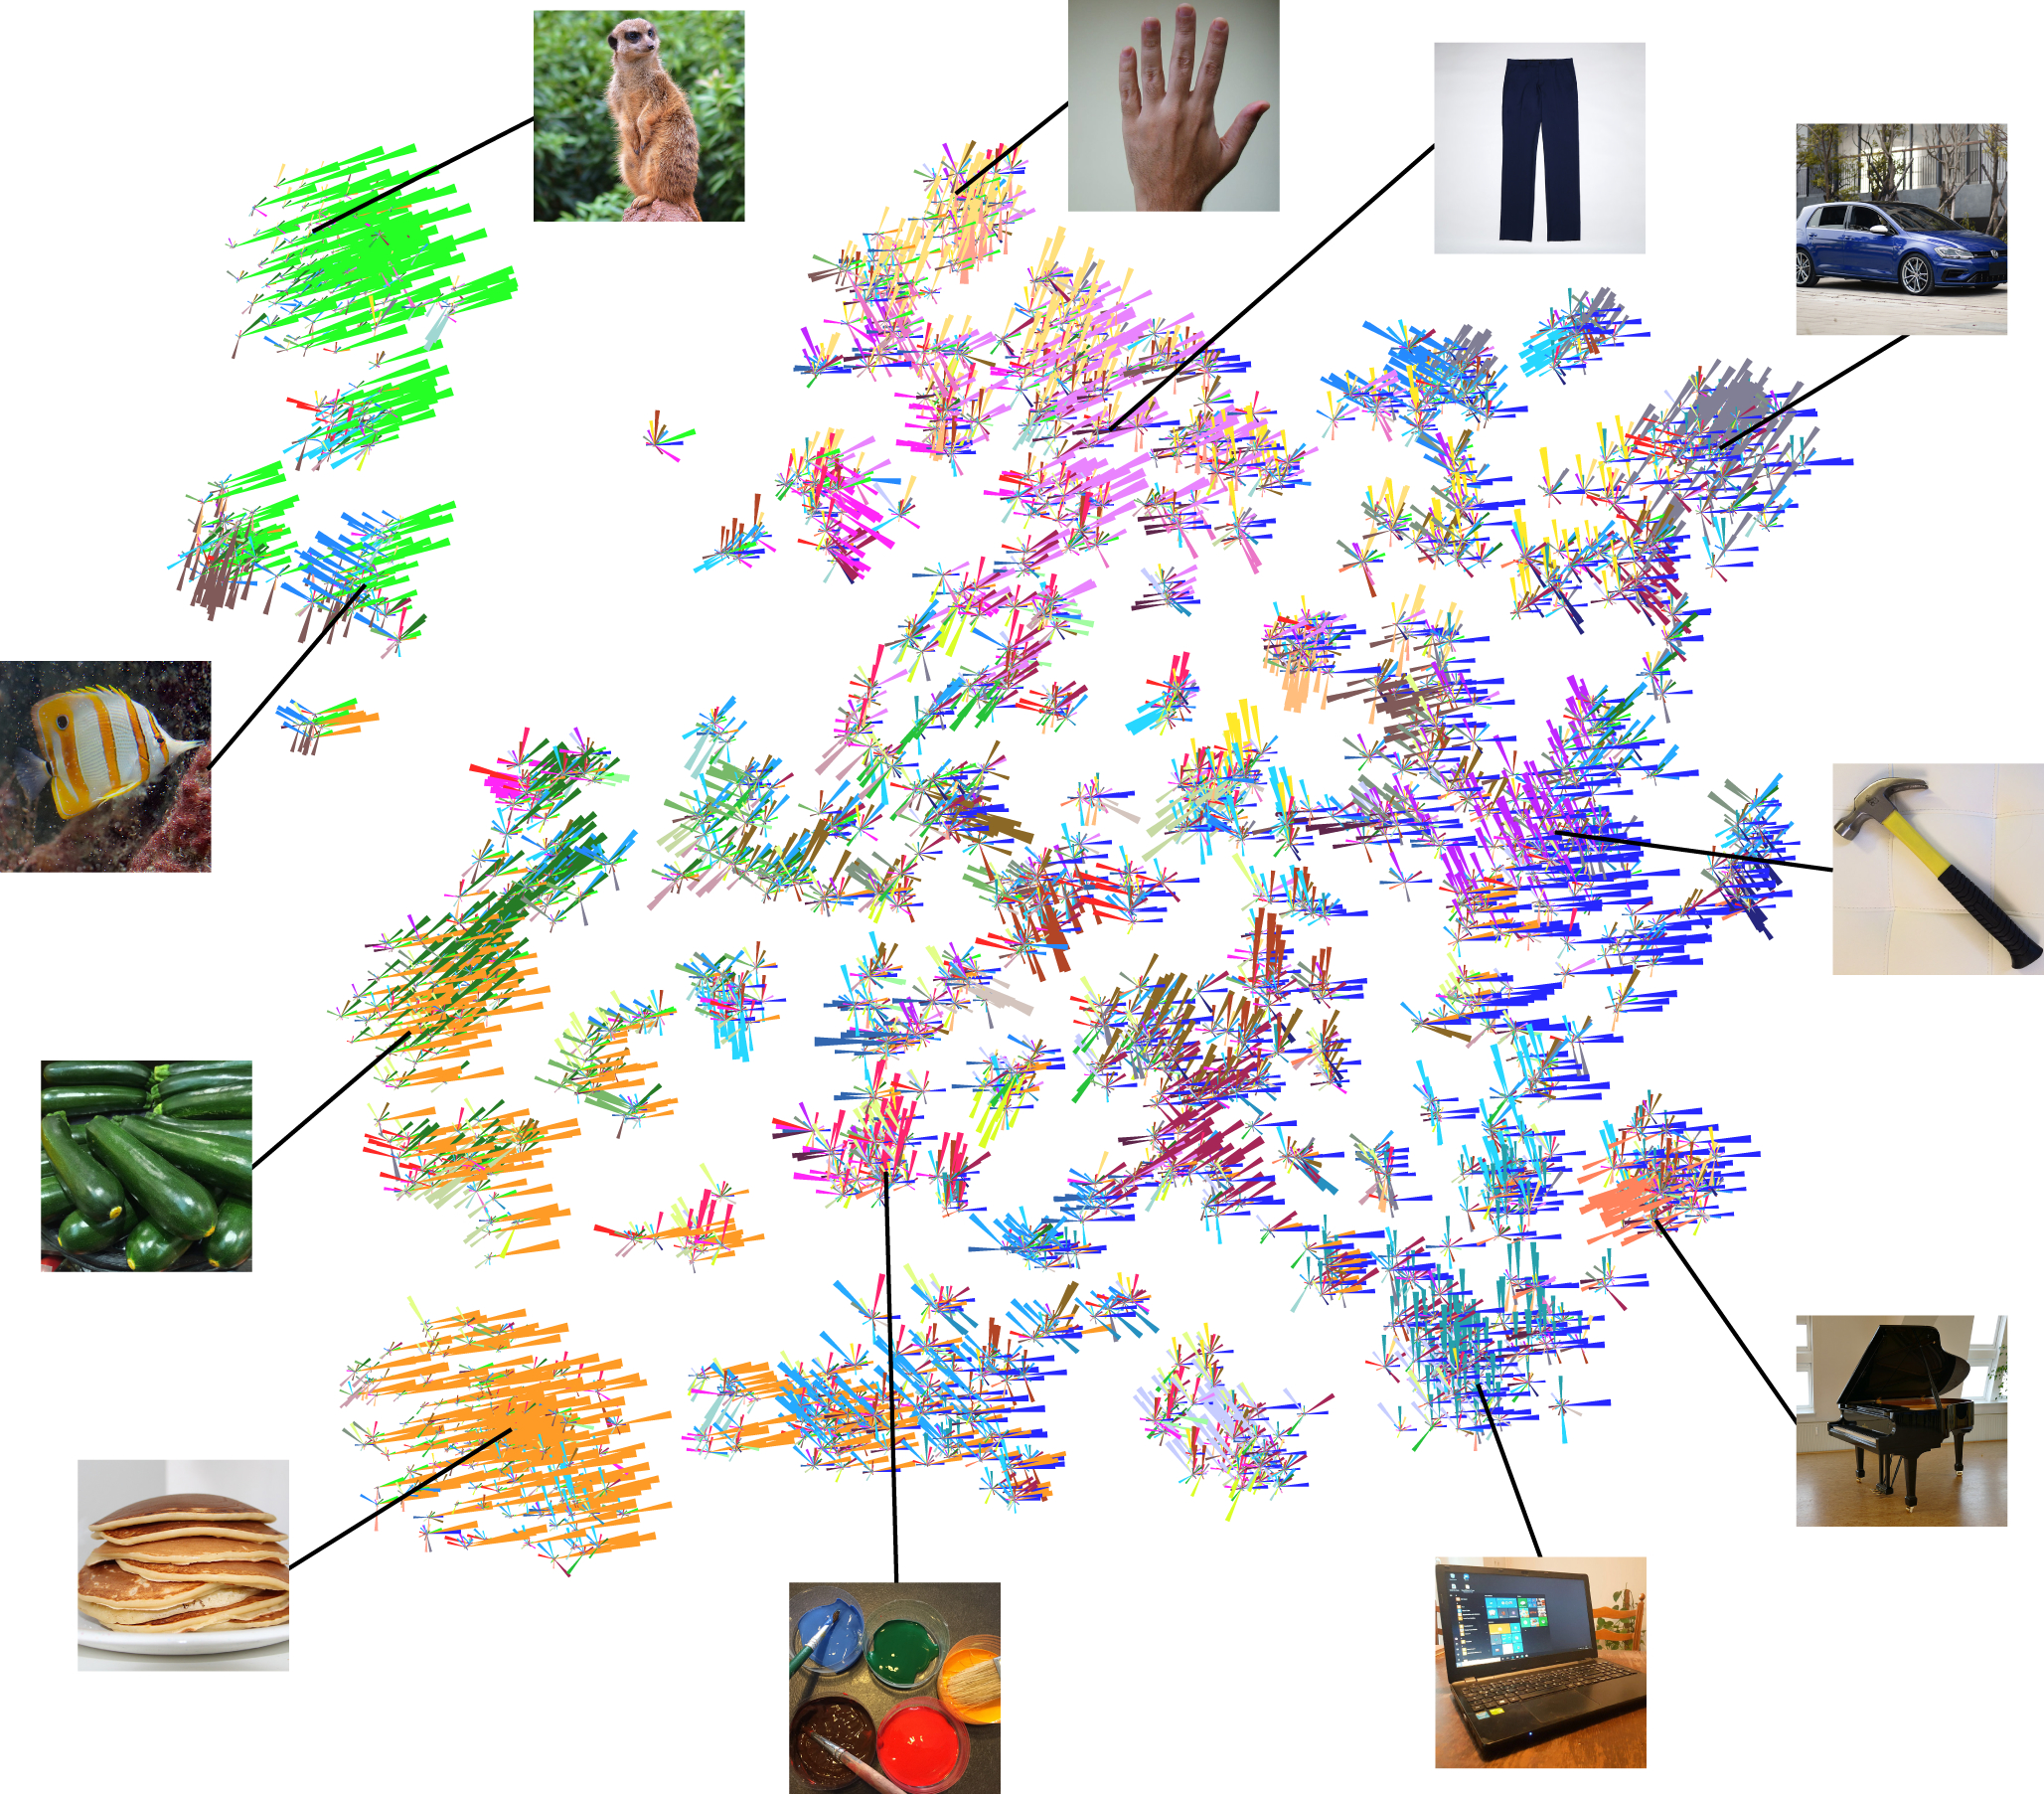
Illustration of example objects with their respective dimensions, using circular bar plots (“rose plots”). The length of each petal reflects the degree to which an object dimension is expressed for the image of a given object. For display purposes, dimensions with small weights are not labeled. For this figure, all images were replaced by images with similar appearance from the public domain.
Natural object categories as emergent property of similarity embedding
To characterize the relative similarity of objects to each other and explore the distribution of dimensions across objects, we combined two common visualization tools. First, we projected the 49-dimensional similarity embedding to 2 dimensions using t-distributed stochastic neighborhood embedding (t-SNE, dual perplexity: 5 and 30), initialized using metric multidimensional scaling. This approach has been shown to preserve the global similarity structure while providing a higher degree of interpretability at the local similarity level than multidimensional scaling alone24. Second, in this two-dimensional plot we visualized each object using rose plots (as in Fig. 4).
The resulting visualization (Fig. 5) reveals several interesting features of the similarity embedding. The global similarity structure seems to highlight the well-known distinctions between “animate - inanimate” and “natural - man-made”, but also reveals three differences. First, representations of humans and human body parts are largely separate from animals and closer to the man-made objects, in line with neuropsychological findings11,25 and demonstrating an important limitation of simply applying taxonomic relationships for studying mental representations26. Second, processed food was found to be more closely related to living and natural objects, acting as an exception to the universality of naturalness as a critical dimension of object representations, again in line with patient data27. Third, the weights of dimensions do not reflect binary membership to the categories of e.g. “natural - man-made” objects. For example, focusing on the dimension “artificial / hard” (dark blue, rightward-oriented bars), this dimension was most strongly expressed on the right of the graph but became weaker when moving to the left, towards animals, food, and natural objects.
Fig. 5 |.
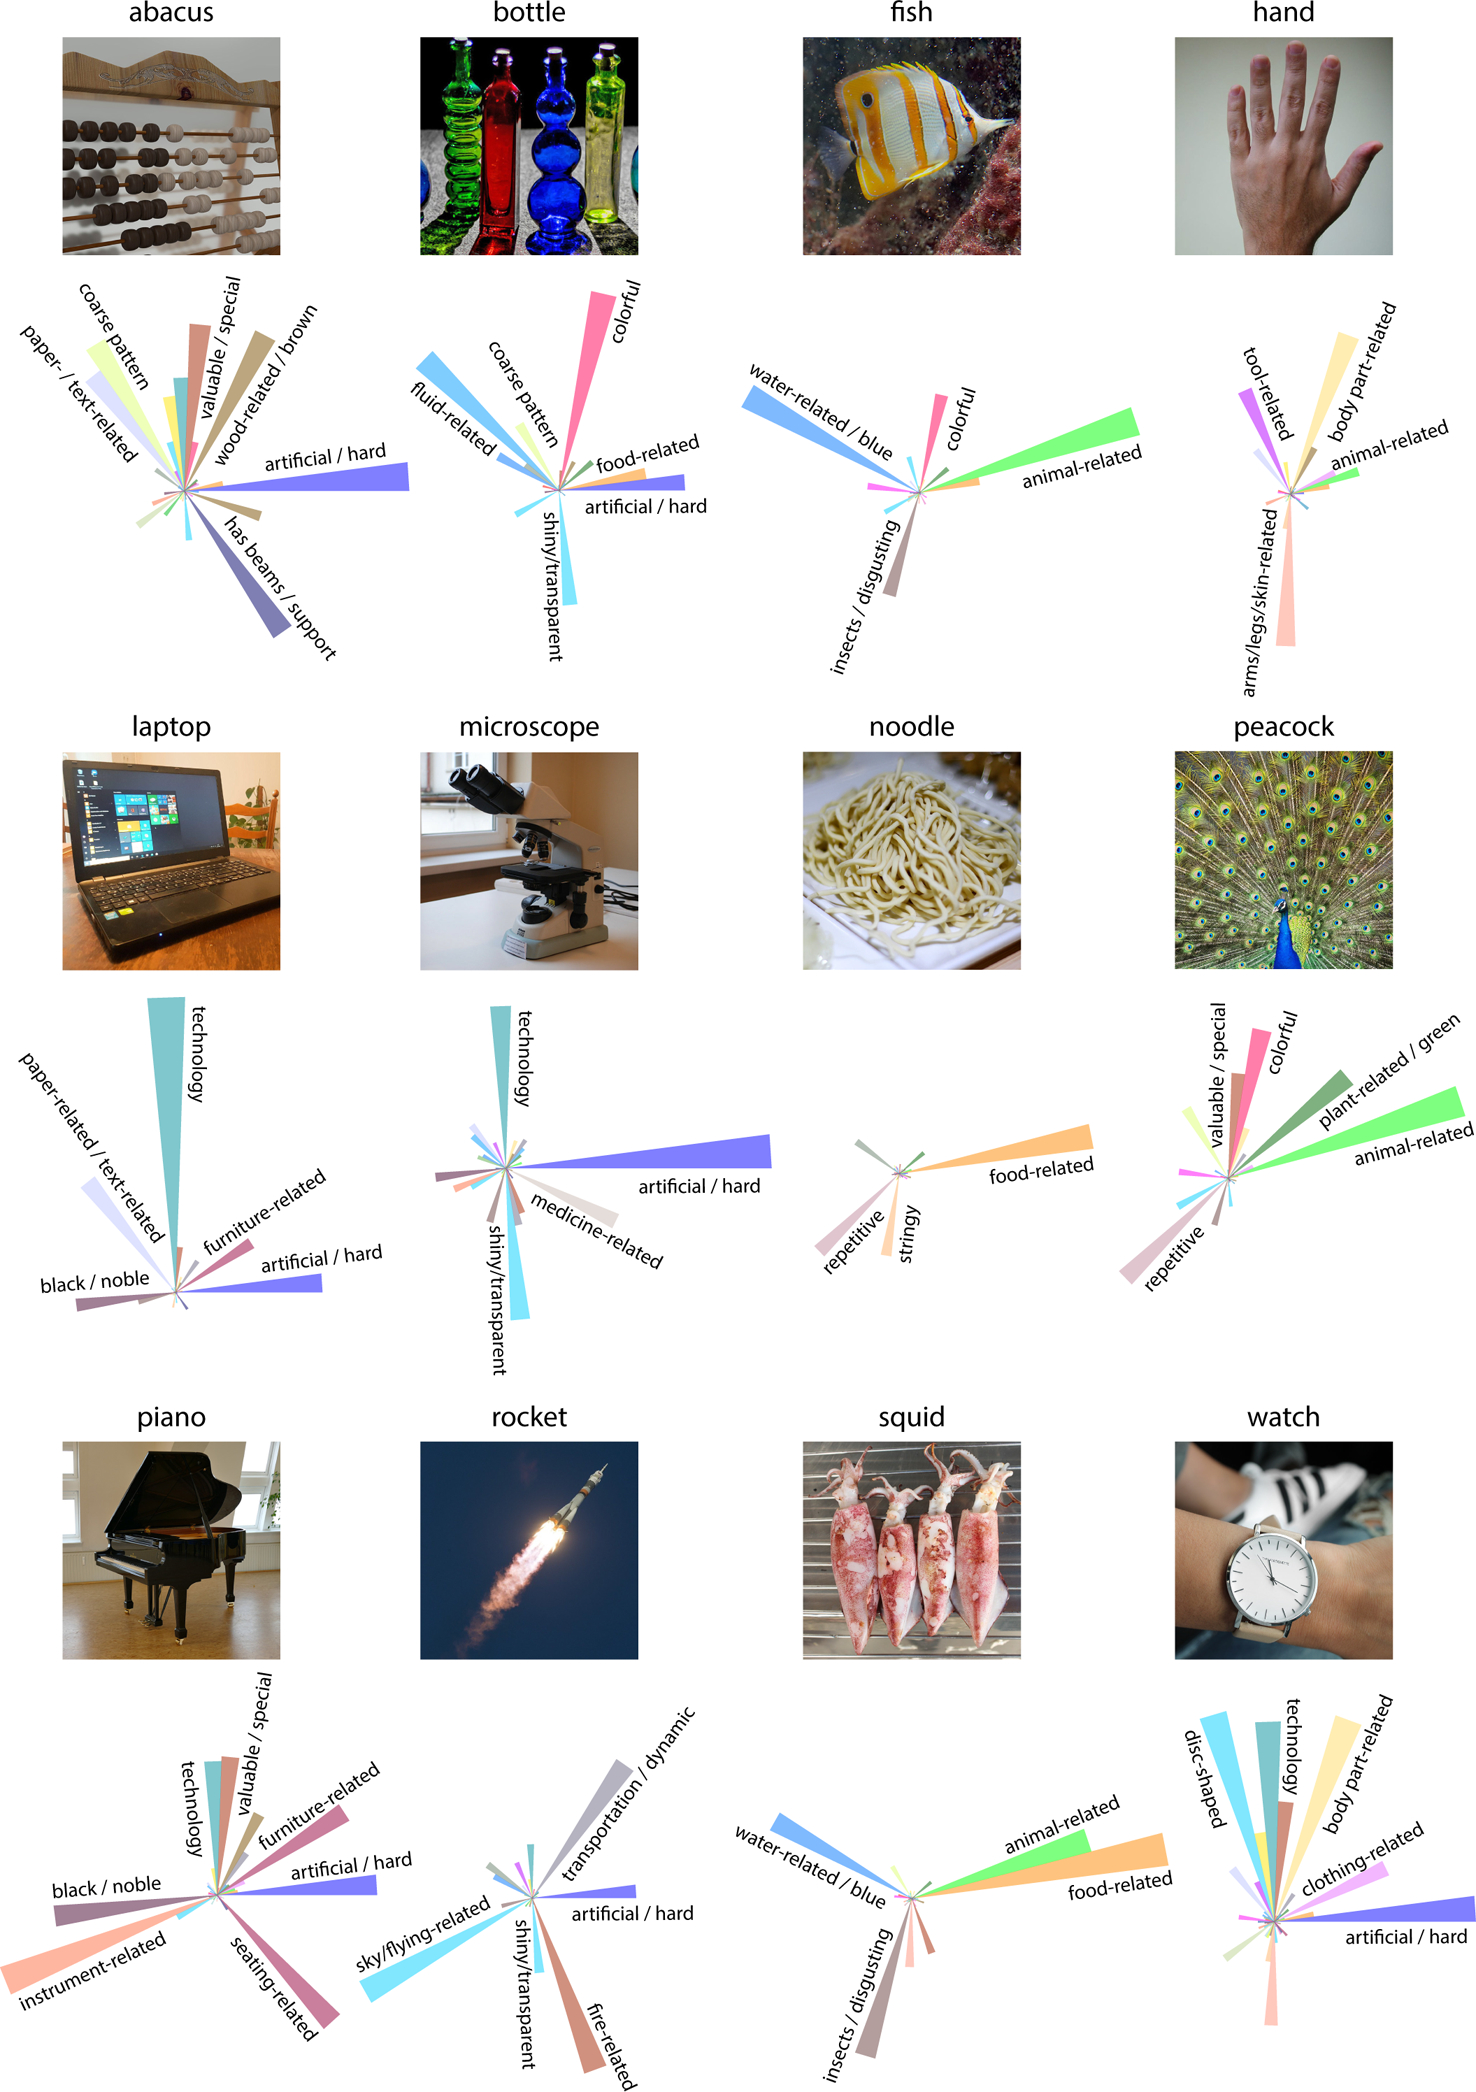
Two-dimensional visualization of the similarity embedding, combining dimensionality reduction (MDS-initialized t-SNE, dual perplexity: 5 and 30, 1,000 iterations) with rose plots for each object (see Fig. 4). At the global structure level, the results confirm the well-known distinction between “animate - inanimate” or “man-made - natural” objects, with some exceptions (see main text). In addition, the different clusters seem to reflect broader object categories which emerge naturally from object similarity judgments. However, dimensions are not restricted to those clusters but are expressed to different degrees throughout this representational space. For this figure, all images were replaced by images with similar appearance from the public domain.
In addition to this global structure, many objects formed clusters related to high-level categories (e.g. animals, tools, vehicles, musical instruments). This indicates that categorization behavior for many categories may be accounted for by the similarity of objects, a property which has been discussed previously28,29 but which had not been tested on a large set of natural objects. To test how well natural categories could be predicted by the similarity embedding, we used 18 unique high-level categories identified in the THINGS database17 and used a cross-validated nearest centroid classifier to predict category membership for each of the 1,112 objects of those categories. The classifier performed at 86.42% (chance performance: 5.56%), on par with a recent semantic embedding of object meaning30 (85.97%) that had been trained on billions of words, demonstrating that the dimensions we identified allow the prediction of categorization behavior for a large number of natural categories.
Finally, the visualization reveals that certain combinations of dimensions are critical for forming different types of categories. Indeed, many subcategories can be explained by defining features: objects with large weights in “animal-related” and “water-related” dimensions are likely sea creatures, while objects with large weights in “plant-related” and “food-related” dimensions are likely vegetables. For example, an abacus can be explained as a combination of several dimensions, such as “artificial / hard”, “wood-related”, “valuable / special”, and “coarse pattern”.
How many dimensions for an object?
The visualizations in Figs. 4 and 5 suggest that some objects are easy to characterize with a relatively small number of dimensions. This indicates that, while all 49 dimensions are useful for some objects, individual odd-one-out judgments of objects may be predicted accurately with a smaller number of dimensions. Since the model performs close to the noise ceiling at predicting behavior, we should be able to produce a lower bound estimate for the number of relevant object dimensions for characterizing individual behavior and the global similarity structure. To this end, we carried out a dimension elimination approach. The reasoning behind this approach is that if a dimension does not matter for behavior, then setting it to 0 should not affect predictive performance of the model. Therefore, for each object, we set the dimension with the lowest weight to 0, predicted behavior in the test set, recomputed the similarity matrix, and compared how this affected the predictive performance of the model. We then repeated this elimination process until only one dimension was left. Importantly, this procedure eliminates not entire dimensions from all objects, but eliminates different dimensions for each object. If behavior is driven by a larger number of dimensions than retained, this would be reflected in reduced model performance. The results of these analyses demonstrate that in order to achieve 95–99% of the performance of the full model in explaining behavioral judgments in the odd-one-out task, a total of 6 to 11 dimensions are required (Fig. 6a), and to explain 95–99% of the variance in the similarity matrix, a total of 9 to 15 dimensions are required (Fig. 6b). Thus, while the representational space of objects can be captured by a comparably low-dimensional embedding, for judging the similarity of objects, on average humans indeed seem to integrate across a larger number of those dimensions.
Fig. 6 |.
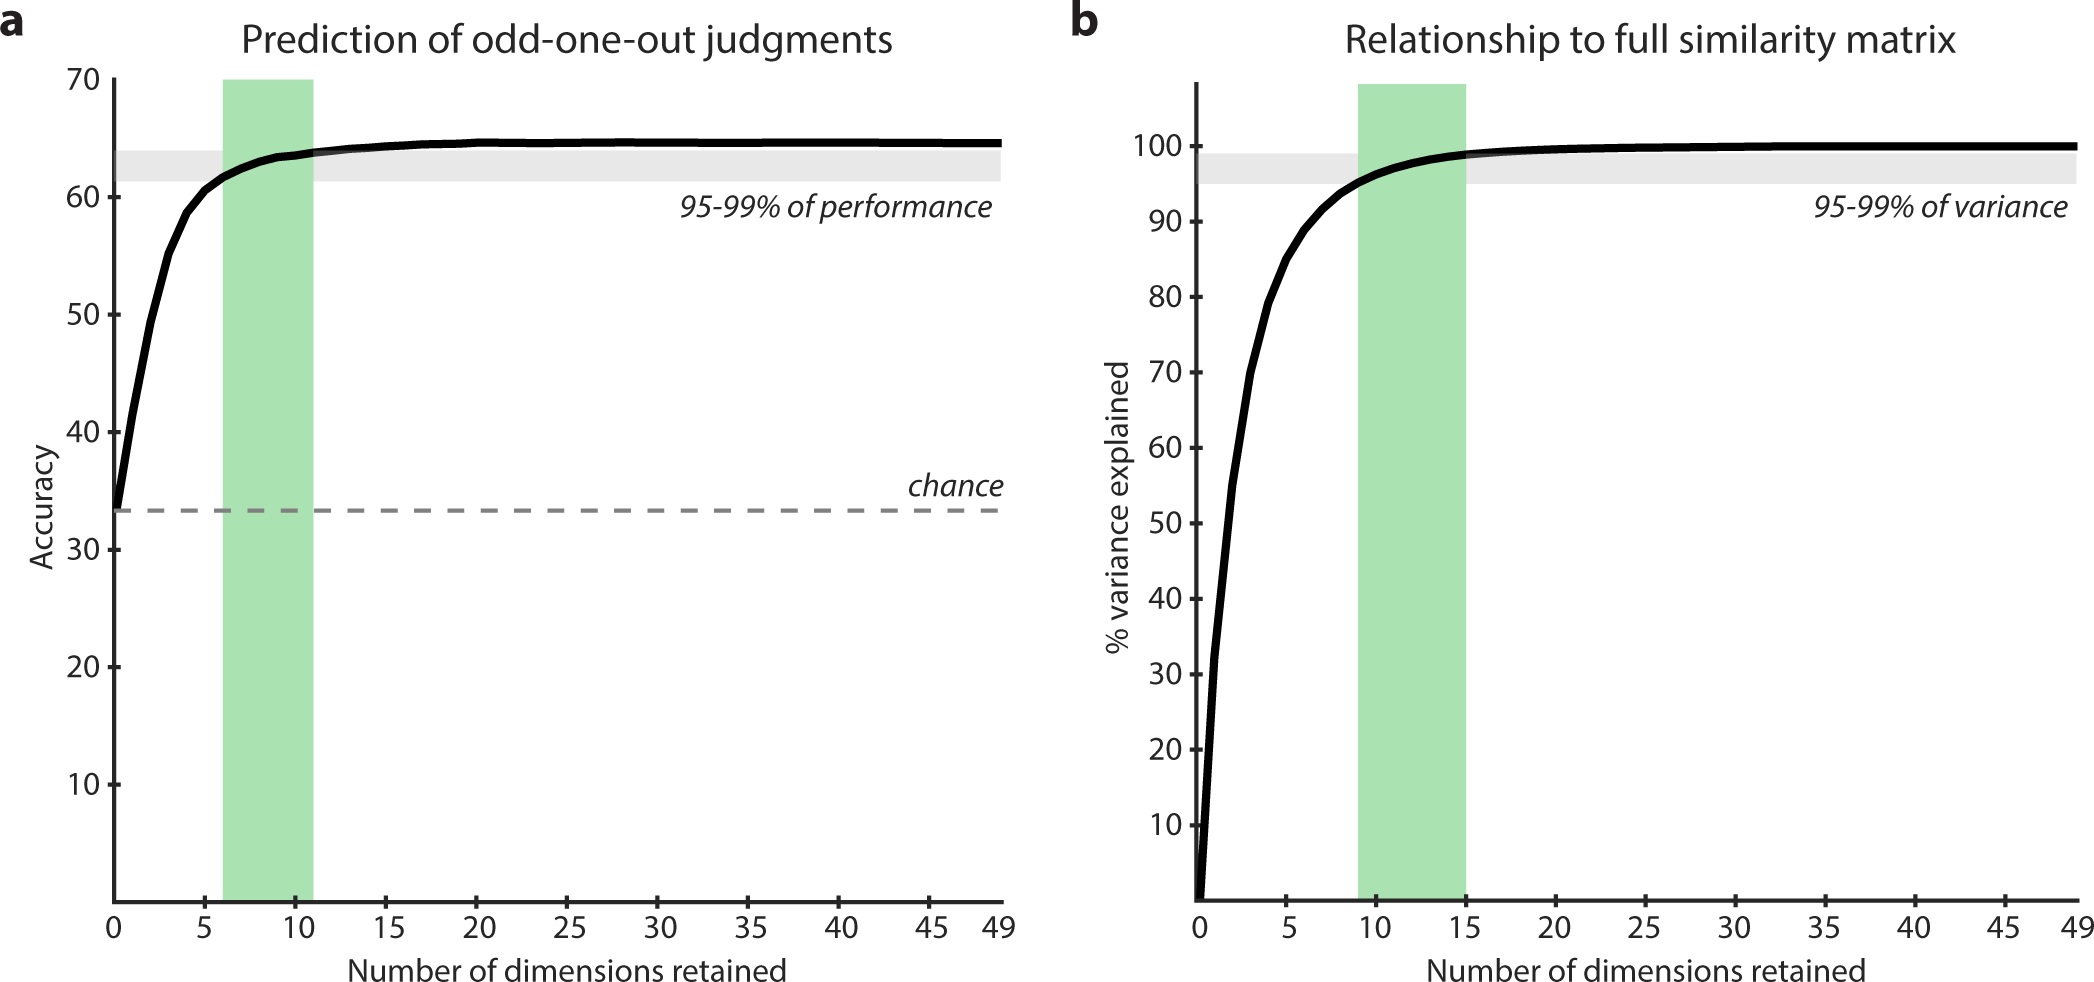
How many dimensions are required to capture behavioral judgments and object similarity? By iteratively setting the dimensions with the smallest numeric value to 0, we estimated the effect of eliminating those dimensions from judgments. A drop in model performance indicates behavioral relevance of those dimensions. For explaining 95 to 99% of the predictive performance in behavior, between 6 and 11 dimensions are required, while for explaining 95 to 99% of the variance in similarity, between 9 and 15 dimensions are required.
Typicality as emergent property of similarity embedding
While objects are characterized by several different dimensions, it is unclear to what degree these dimensions merely reflect binary properties of the objects (e.g. “is an animal”, “is a tool”, “is a vehicle”) or rather the degree to which they are present in an object (e.g. “animacy”, “manipulability”, “utility for transportation”). While we were able to predict the high-level category of objects from the embedding, we did not test whether the continuous nature of the dimensions was informative about the degree to which a dimension is expressed in an object. The continuous nature of dimensions may be reflected in the typicality of objects within their corresponding category. Interestingly, this would demonstrate that not only object categories, but also typicality can be described as an emergent property of object similarity. To test whether the numeric value of a dimension reflected typicality, we used online crowdsourcing to collect typicality ratings for words of the 27 high-level categories in the THINGS database. Of those categories, 17 could be related to dimensions of our embedding according to their dimension labels, and consequently, we tested their correspondence with typicality. The results of these analyses are shown in Fig. 7 and Extended Data Figure 3. Despite the typicality ratings being based on words and the dimensions on images, 14 out of 17 dimensions revealed a significant positive relationship with typicality scores (Spearman’s ρ: 0.26–0.62, all p < 0.05, one-sided, FDR-corrected for multiple comparisons). These results demonstrate that typicality may indeed be an emergent property of the object dimensions. However, the results also reveal that some dimensions with a weaker relationship do not seem to reflect a purely category-related semantic code but may incorporate other, perhaps perceptual aspects.
Fig. 7 |.
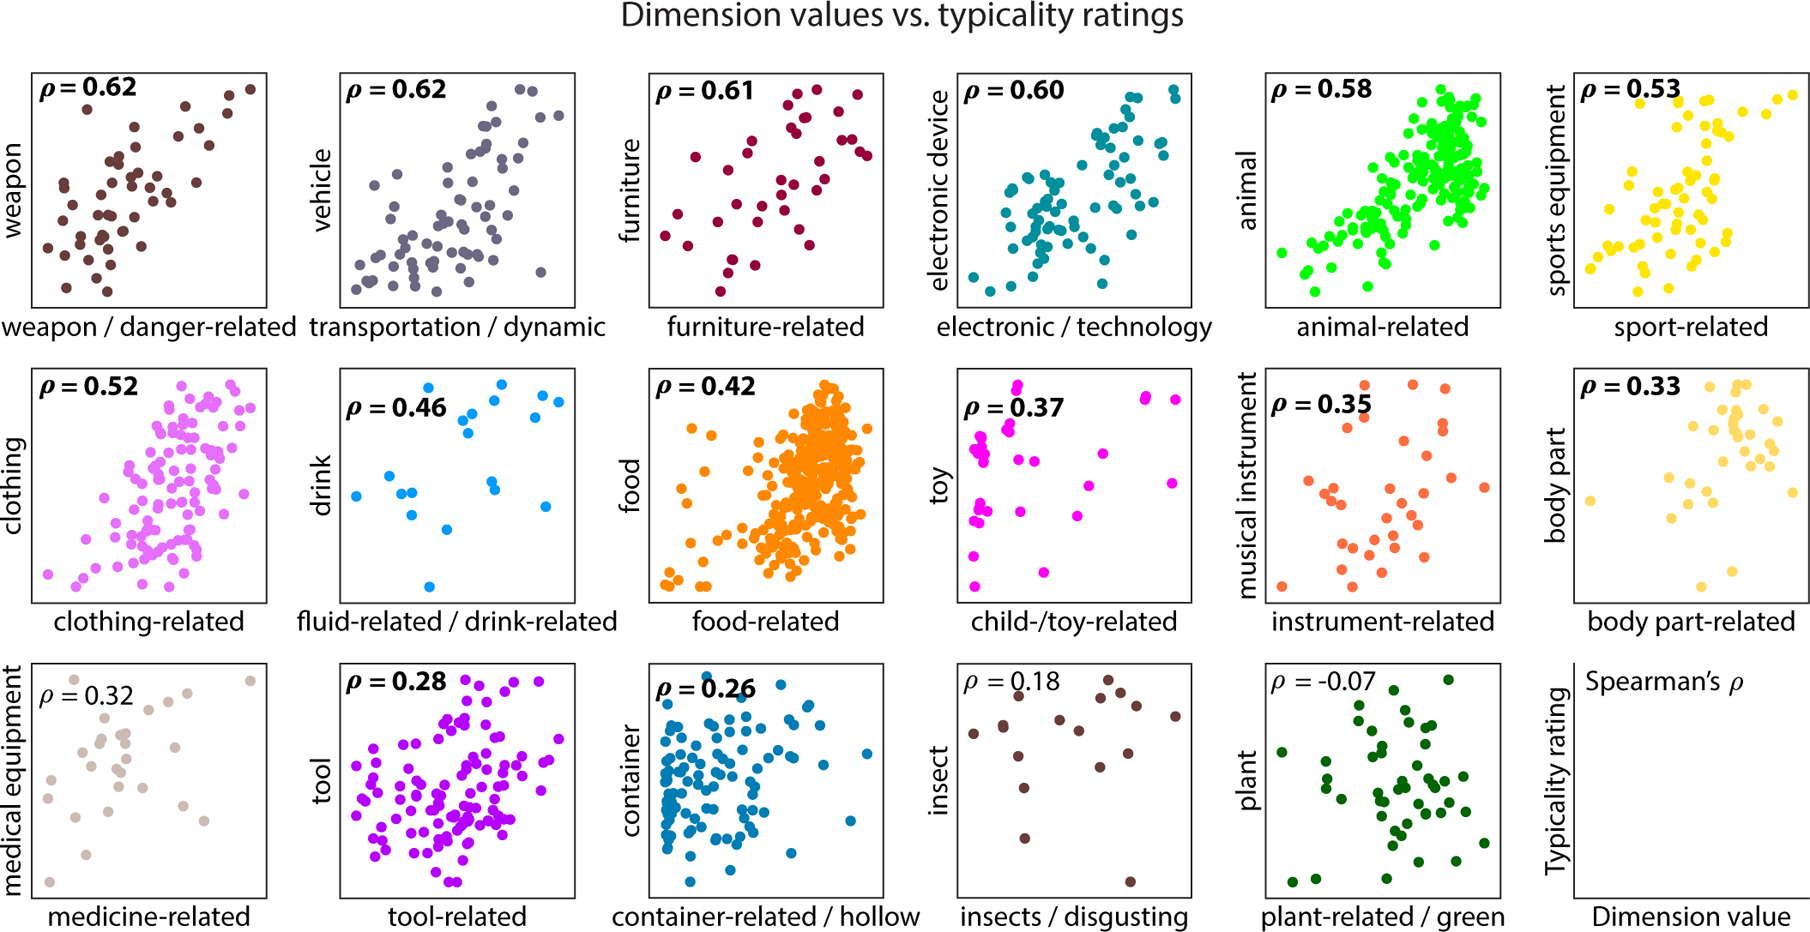
The relationship between seemingly categorical dimensions and typicality ratings of those categories. Many of these dimensions exhibited a positive relationship between the numeric value of objects along that dimension and the typicality of category membership. This demonstrates that even seemingly categorical dimensions reflect the graded nature of the underlying dimensions and that typicality may be an emergent property of those dimensions. All results were min-max scaled for better comparability. Significant relationships between both variables are displayed in bold typeface (p < 0.05 one-sided, FDR-corrected for multiple comparisons). See Extended Data Figure 3 for individual inferential statistical results.
Human ratings along model dimensions allow generating similarity scores for arbitrary object images
A generative model of object similarity would open the possibility to directly operate on the dimensions rather than having to collect similarity judgments. To what degree can the representational embedding identified from the odd-one-out judgments act as a generative model of object similarity? A simple way to test this idea is to ask participants to provide direct ratings of objects along the dimensions of the embedding31. If it is possible to generate similarity from human ratings of dimensions, this would also serve as a stricter test of their interpretability.
For a set of 20 object images selected at random from the 1,854 objects, we asked 20 laboratory participants (15 female, 5 male) to rate those objects along the 49 object dimensions of the representational embedding (Fig. 8a). Rather than providing them with semantic labels for the dimensions, participants were shown example images along a continuous rating scale and were asked where along that scale they would place those objects. In the next step, responses for each dimension were averaged across participants and used in place of the model dimensions to generate a human-predicted similarity matrix. Importantly, since the focus here was to provide proof-of-concept for the usefulness of dimensions, participants had not been trained on this task.
Fig. 8 |.
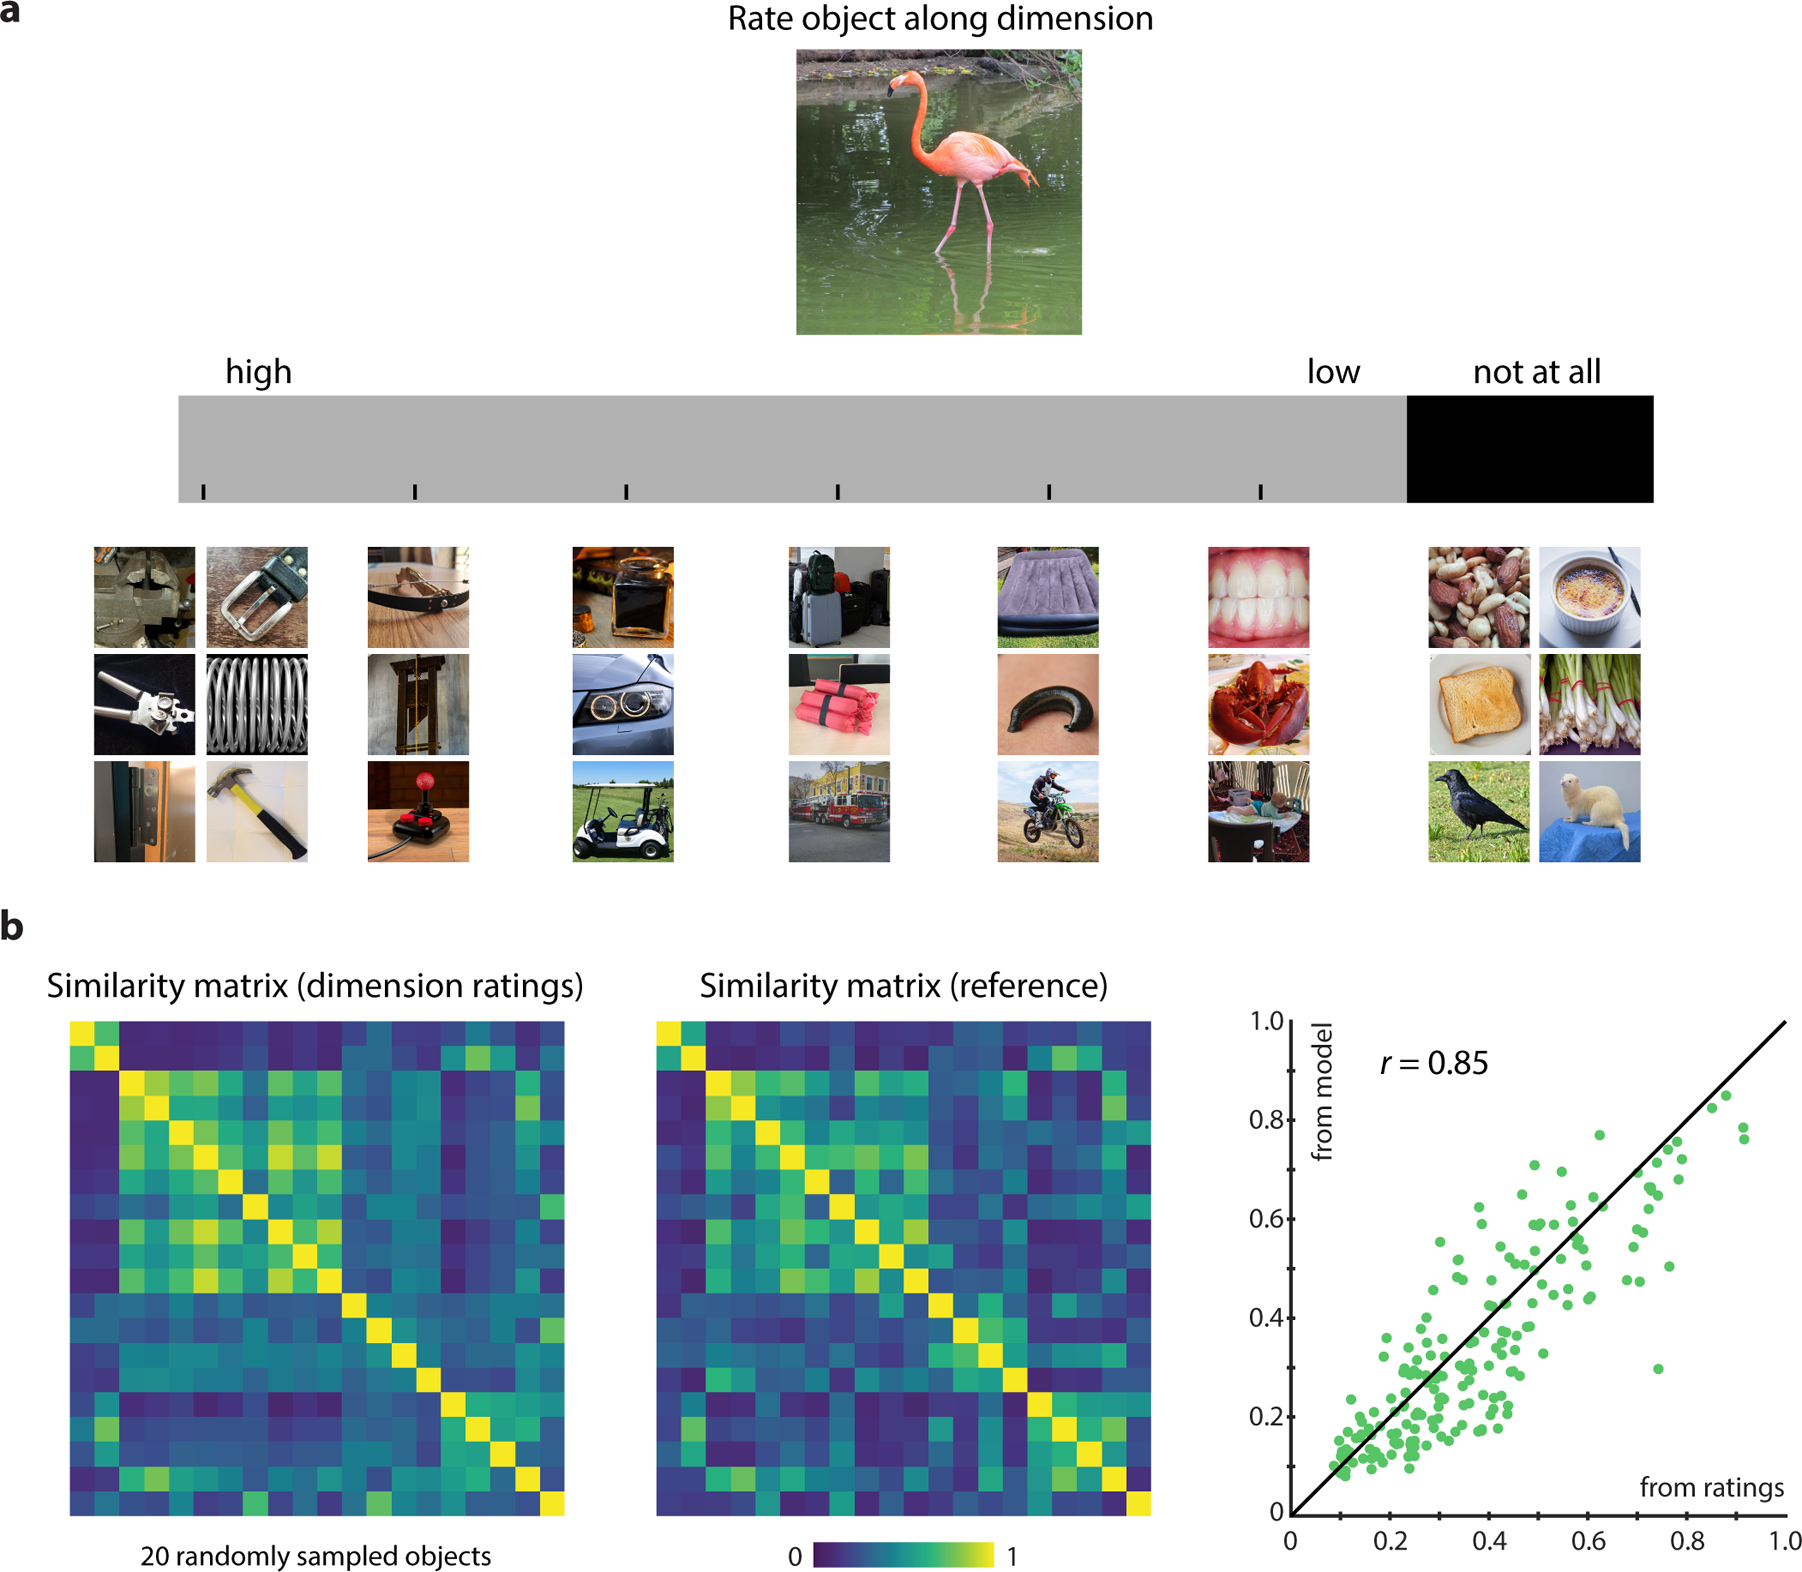
Task and results of direct ratings of dimensions. a 20 participants were asked to indicate with a mouse click where they believed objects would fall along all 49 model dimensions. Rather than providing participants with dimension labels, the rating scale was spanned by example images along the currently rated dimension (in this example, dimension 1, “artificial/hard”). b Results for the 20 tested objects revealed a good reconstruction of object similarity by dimension ratings when comparing it to the similarity predicted from the embedding that served as a reference (Pearson r = 0.85, p < 0.001, randomization test, 95% CI: 0.80–0.89). These results further support the idea that dimensions are interpretable and that they can be used to directly generate object similarities. For this figure, all images were replaced by images with similar appearance from the public domain.
The comparison of similarity from direct dimension ratings and the reference similarity matrix from the model embedding (Fig. 8b) revealed a generally close correspondence between the two matrices (Pearson r = 0.85, p < 0.001, randomization test, 95% CI: 0.80–0.89). This result demonstrates that humans are able to judge dimensions for objects to allow for a good reconstruction of similarity from dimension ratings. Importantly, since this task was carried out with participants that were not trained on the use of the rating scale and were not instructed regarding the interpretation of the dimensions, this result underscores the interpretability and usefulness of the dimensions.
Discussion
Identifying the structure of our internal mental representations is a central goal in the cognitive sciences. For the domain of natural objects, this may seem particularly challenging, given the high complexity of our visual world that contains thousands of objects with a seemingly countless number of possible object properties. Here, using a triplet odd-one-out task on a wide range of object images, we demonstrated that it is possible to characterize the similarity structure and individual human behavioral judgments with a low-dimensional representational embedding learned directly from human choice behavior. The model revealed 49 meaningful object dimensions, each being interpretable with respect to the perceptual and conceptual properties of those objects, reflecting both basic perceptual properties of shape, color, texture as well as more high level properties such as taxonomic membership, function, or value. The embedding allowed the prediction of other forms of behavior, including high-level categorization and typicality judgments. By demonstrating that participants can use these dimensions to generate object similarity scores, these results open the avenue towards a generative model of object similarity judgments. Importantly, the resulting large-scale similarity matrix based on our representational embedding can act as a basis for testing formal computational models of categorization and category learning in the domain of natural objects31.
Being able to characterize mental representations of objects with a low-dimensional embedding is surprising, given their high degree of perceptual variability and our broad semantic knowledge of them32. Indeed, popular semantic feature production norms15,16 have revealed thousands of binary features that participants name when asked about their explicit knowledge of objects. Rather than attempting to capture all details of our semantic knowledge of objects with binary properties, our results demonstrate that it is possible to achieve high predictive performance using only a small number of interpretable, continuous dimensions. It may be possible to generate these binary properties from the continuous dimensions in our model, which would demonstrate that the implicit judgments in the odd-one-out task capture much of the explicit semantic knowledge of objects, but a general test of this idea would require the creation of feature production norms for the 1,854 objects used in the creation of the embedding. However, even if such norms were created, there are two reasons that their predictions may be limited. First, the dimensions revealed in this work are focused around the properties most relevant for discriminating among different objects, while feature production norms would likely contain much more - often idiosyncratic - information than required for those distinctions. Second, when using object words and an explicit feature naming task, participants often omit critical features14,34. By using object images and an implicit, non-verbal task, it is possible to capture perceptual dimensions of objects with a representational embedding that might otherwise be missed.
In contrast to traditional data-driven approaches that identify multidimensional feature spaces using dimensionality reduction techniques such as multidimensional scaling35,36, factor analysis37,38, or additive clustering39, for the present model we made two assumptions that support the interpretability of dimensions, motivated by the observation of how objects are typically characterized21,22: (1) dimensions are sparse, i.e. each object carries only some dimensions but not others, and (2) dimensions are positive, i.e. each object is characterized by a combination of dimensions that are present to a certain degree and that add up without canceling each other out. By incorporating these assumptions, our model not only yields interpretable dimensions, but also reflects a blend between two common model families used to characterize objects: dimensional models that assume continuous dimensions, and featural models that assume the presence and absence of, mostly binary, object properties9,40. Analyses of category-related typicality judgments demonstrate that the continuous nature of the dimensions is informative as to the degree to which these dimensions are expressed in objects, demonstrating that continuous dimensions allow us to generalize beyond binary categorical assignment of semantic attributes (e.g. “is animate”)41. In addition, while traditional pairwise assessment of similarity typically neglects the importance of object context3,42, by using a triplet odd-one-out task this type of embedding in principle allows generating object similarity for arbitrary contexts imposed by focusing on a chosen subset of objects (e.g. animals). The degree to which the embedding carries such fine-grained information will need to be tested in future studies.
While mathematically, there are an infinite number of possible ways in which object representations can be characterized by a set of dimensions, identifying a broad range of meaningful and predictive dimensions with a bottom-up, data-driven model offers a systematic approach for the identification of meaningful dimensions, complementing traditional top-down, theory-driven approaches. Ultimately, however, further studies are required to validate the specificity of different dimensions in this model and link them to representations in the human brain. One intriguing prediction of our model is that specific deficits in recognizing objects found in patients with focal lesions may be tied more to specific dimensions identified in this study or regions in representational space than to specific object categories25,27. For example, given the prominence of the dimension “shiny / transparent”, one might expect to find specific deficits associated with surface materials of objects. Likewise, based on the representational proximity of clothing and body parts, one might expect a deficit in one to be associated with a deficit with the other.
While we demonstrated that most dimensions were highly reproducible across different random initializations of the model, using a smaller subset of the data for building the embedding revealed a smaller number of dimensions (Extended Data Figure 4), indicating that the dimensionality of the embedding is a function on the amount of data used. Further, while the sparsity constraint is an important feature of the model, one limitation is that it may lead to very similar dimensions being merged (e.g. “plant-related and green”). Ultimately, additional data will be required to test the degree to which these dimensions remain stable or whether further dimensions will appear. However, since the model performed close to noise ceiling at predicting similarity judgments and yielded interpretable dimensions, this demonstrates that the representational embedding already provides a useful description of behavioral judgments and object similarity.
Finally, the prediction of similarity from direct ratings of dimensions was based on 20 objects that were part of creating the original embedding, which may slightly overestimate the ability to generate similarity from dimension ratings. However, given the large number of objects used in this study, we believe it to be unlikely that those ~1% of the objects would strongly bias the results, and collecting ratings from a different set of objects would have required generating, characterizing and testing a different model, which was prohibitive in the context of this study. Future studies with the goal of training participants to generate dimension ratings could rely on a separate set of objects for relating predicted with measured similarity.
The approach proposed in this study opens the avenue for many related questions: To what degree are the dimensions shared between different individuals43,44, and how are they affected by gender, age, culture, education, other sociodemographic factors, and individual familiarity with the objects? To what extent do the representations depend on the exact task, and can other similarity tasks evoke similarly fine-grained representations45,46? What are the representational dimensions in other domains, such as words, faces, places, or actions? Finally, what makes those representations similar to those found in deep convolutional neural network models of vision47, semantic embeddings learned on word co-occurrence statistics in large text corpora22,30,48, or brain activity in humans49–53? Addressing these questions will be important for a comprehensive understanding of mental representations of objects across people and different domains.
Methods
Participants
A total of 5,983 workers from the online crowdsourcing platform Amazon Mechanical Turk participated in the triplet odd-one-out experiments, which consisted of the creation of the fully-sampled matrix of 48 objects (121 workers, after exclusion 100; 46 female, 54 male), the data for training and testing the computational model (5,526 workers, after exclusion 5,301; 3,159 female, 2,092 male, 19 other, 31 not reported), and the 1,000 randomly chosen triplets used for the estimation of a noise ceiling (336 workers, after exclusion 325; 156 female, 103 male, 66 not reported). In addition, a total of 337 workers (no exclusions; 198 female, 131 male, 8 not reported) participated in the creation of the typicality norms. All workers were located in the United States, and worker age was not assessed. For the odd-one-out task, workers were excluded if they exhibited overly fast responses in at least 5 sets of 20 trials (speed cutoff: 25% or more responses <800 ms and 50% or more responses <1100 ms) or if they carried out at least 200 trials and showed overly deterministic responses (> 40% of responses in one of the three odd-one-out positions, expected value: 33%). All workers provided informed consent. The number of trials – and consequently the sample size – was determined based on feasibility and available resources. The online research was approved by the Office of Human Research Subject Protection (OHSRP) and conducted following all relevant ethical regulations, and workers were compensated financially for their time.
In addition, 20 laboratory participants (15 female, 5 male, mean age: 26.25, std: 6.39, range 19–41) took part in the dimension labeling and the dimension rating experiment. All laboratory participants provided written informed consent and were compensated financially for their time. No statistical methods were used to pre-determine sample sizes. The laboratory experiments were carried out following all relevant ethical regulations and rules of the National Institutes of Health (NIH) Institutional Review Board (NCT00001360).
Object images and odd-one-out task procedure
The 1,854 images of objects used in this study were the reference images that had been used previously for validating the concepts of the THINGS database17. The images depict objects embedded in a natural background and were all cropped to square size, with the exception of a small number of images that didn’t fit into a square and that were padded with white background on both sides. Importantly, the validation task of the THINGS database demonstrated that the objects in the 1,854 images were generally nameable, i.e. it can be assumed that most participants were sufficiently familiar with the objects to be able to name them. The triplet odd-one-out task was carried out in sets of 20 trials, and workers could choose how many sets they would like to carry out. On each trial, workers were shown three object images side by side in a browser window and were asked to report the image that was the least similar to the other two. Workers were told that they should focus their judgment on the object, but to minimize bias they were not given additional constraints as to the strategy they should use. In addition, participants were instructed that in case they did not recognize the object, they should base their judgment on their best guess of what the object could be. Participants responded with a mouse click on the respective image, which initiated the next trial after an intertrial interval of 500 ms. Each object triplet and the order of stimuli was chosen randomly, but in a way that after data collection each cell in the 1,854 × 1,854 similarity matrix had been sampled at least once.
To yield a diverse set of objects for the fully sampled similarity reference dataset, the 48 objects were chosen by carrying out spectral clustering on publicly-available 300-dimensional sense vectors of all 1,854 objects30 with 48 clusters and by choosing one object per cluster randomly.
Details of computational modeling procedure
The model and preliminary results were presented previously at a conference33. The model was implemented as a computational graph in TensorFlow (Version 1)54. Each triplet was encoded using three one-hot vectors (length: 1,854), and each vector was linked to 90 latent dimensions, but with weights replicated across all three vectors. The 1,854 × 90 weights were initialized randomly (range 0–1). Note that initializing the model with 200 dimensions led to very similar model performance and final number of dimensions (prediction accuracy of test set odd-one-out choices: 64.70%, dimensions: 50). The dot product was chosen as a basis for proximity for computational reasons, but using Euclidean distance led to similar performance (prediction accuracy of test set odd-one-out choices: 64.69%, dimensions: 57). The objective of the model optimization consisted of the cross-entropy, which was the logarithm of the softmax function, and a regularization term based on the L-1 norm to encourage sparsity,
where x corresponds to an object vector, i, j, and k to the indices of the current triplet, n the number of triplets, and m the number of objects. The regularization parameter λ that controls the trade-off between sparsity and model performance was determined using cross-validation on the training set (λ = 0.008). In addition to sparsity, the optimization was constrained by strictly enforcing weights in the embedding X to be positive. Minimization of this objective was carried out using stochastic gradient descent as implemented in the Adam algorithm55 using default parameters and a minibatch size of 100 triplets. After optimization was complete, dimensions for which weights of all objects were smaller than 0.1 were removed, leaving us with 49 dimensions. Empirically, the largest maximum weight of all excluded dimensions was 0.03, while the smallest maximum weight of all included dimensions was 1.38. The dimensions were sorted in descending order by the sum of their weights across objects.
Computation of similarity matrix from embedding
We defined object similarity in the triplet odd-one-out task as the probability p(i,j) of participants choosing objects i and j to belong together, irrespective of context. Therefore, to compute similarity from the learned embedding for all 1,854 objects, we created all predicted choices for all possible ~1.06 billion triplets and calculated the mean choice probability for each pair of objects. For the fully-sampled similarity matrix of 48 objects used for testing the performance of the model at predicting object similarity (Fig. 2), we created a different similarity matrix that was constrained only by this subset of 48 objects.
Reproducibility of embedding dimensions
Due to the stochasticity of the optimization algorithm, each time the model is re-run, we will likely end up with a different set of dimensions. To determine the stability of each dimension in our 49-dimensional embedding, we re-ran the model 20 times, each time with a different random initialization. Next, we correlated each of the 49 original dimensions with all dimensions of one of the 20 reference embeddings and chose the best-fitting dimension across all correlations as the closest match. Then, we applied a Fisher z-transform to the correlations, averaged them across all 20 reference embeddings and inverted the Fisher z-transform to get a mean reliability for each dimension across all 20 embeddings. While the resulting comparison may exhibit a slightly positive bias due to choosing the best fit, a split-half cross-validation between all objects demonstrates nearly indistinguishable results (maximum difference r = 0.01).
Category prediction
The categorization performance of the representational embedding was tested on 18 of the 27 categories in the THINGS database. Objects that were members of multiple categories were removed. Of the 9 categories that were removed, 7 were subcategories of other categories (e.g. “vegetable” in “food”) or had fewer than 10 objects after removal of non-unique objects. The remaining 18 categories were as follows: animal, body part, clothing, container, electronic device, food, furniture, home decor, medical equipment, musical instrument, office supply, part of car, plant, sports equipment, tool, toy, vehicle, and weapon. These categories comprised 1,112 objects. Classification was carried out using leave-one-object-out cross-validation. For training, Centroids for all 18 categories were computed by averaging the 49-dimensional vectors of all objects in each category, excluding the left-out object. The membership of this remaining object was then predicted by the smallest Euclidean distance to each centroid. This procedure was repeated for all 1,112 objects, and prediction accuracy was averaged. For the corresponding analysis with a semantic embedding, we used publicly-available 300-dimensional sense vectors30.
Typicality ratings
Typicality ratings were collected for all 27 object categories in the THINGS database, with the goal of including them as metadata for the database. However, for the purpose of this study, we focused on the 17 categories for which the labels indicated a relationship of dimensions with specific object categories. Typicality ratings were collected by asking workers to rate the typicality of an object as belonging to a given category, using a Likert scale from 0 to 10. Each rating was collected 40 times. To improve comparability of the use of the Likert scale, each workers’ responses were z-scored before they were merged with other responses.
Dimension naming task and construction of word clouds
In the dimension naming task, laboratory participants were asked to provide labels for different dimensions after inspecting them. This was achieved by showing them example object images along a continuous scale for a given dimension, comparable to the display in Fig. 8a. Participants could further inspect dimensions by clicking on example objects, which would reveal more object images in this range. The exact object images shown varied between dimensions. Participants were instructed not to focus exclusively on the top of the scale but to take the entire distribution of objects into account. After having studied a dimension, they were allowed to provide up to three verbal labels for the dimension. Word clouds displaying participants’ responses according to the frequency of provided object labels were constructed using the function wordcloud in MATLAB (Mathworks, Natick, MA), using default parameters.
Object dimension rating task
The object dimension rating task was carried out after the dimension naming task. Participants were shown a reference image on the top and were asked to rate where they would place the object along a Likert scale, according to the meaning of the dimensions explored previously (Fig. 8a). Participants were recommended to take two of the 7 shown levels (demarcated by the object images), and for the given object judge if it was better characterized by one or the other level. The rating task was carried out for all 49 dimensions sequentially, on images of the following 20 objects chosen randomly from the set of 1,854 objects: bazooka, bib, crowbar, crumb, flamingo, handbrake, hearse, keyhole, palm tree, scallion, sleeping bag, spider web, splinter, staple gun, suitcase, syringe, tennis ball, woman, workbench, and wreck. Since many dimensions were at or close to 0, the scale included a short range with all zero values (“not at all”). Further, to improve the discriminatory power of the scale, dimension values were converted to percentiles, with all percentiles lower than 20% set to 0.2. After ratings had been collected, percentiles were converted back to their respective continuous values along the dimensions and averaged across participants. Further, for better comparability to the original dimensions, dimension values were scaled in a way that their minimum rating corresponded to 0. Then, the object dimensions were treated as new embedding dimensions for the 20 objects, and object similarity was calculated for them according to the procedure described above. Finally, the similarity matrix generated from the object ratings was compared to the similarity matrix from the full model.
Statistical analyses and confidence intervals
Unless indicated otherwise in the text, statistical analyses were conducted using classical parametric statistical tests and, when required, corrected for multiple comparisons using false discovery rate (FDR). Data distribution was assumed to be normal but this was not formally tested. All tests were two-tailed unless denoted otherwise. Non-parametric randomization tests on correlations between predicted and measured similarity matrices were conducted by creating 100,000 similarity matrices based on randomly shuffling object labels, re-running the correlation with the measured similarity matrix, and calculating p-values as the percentage of permutations reaching or exceeding the true similarity. Error bars reflect 95% confidence intervals and were created based on the standard error of the mean or - when no distribution was available - based on the standard deviation of 1,000 bootstrap samples.
Extended Data
Extended Data Fig. 1. Reproducibility of dimensions.
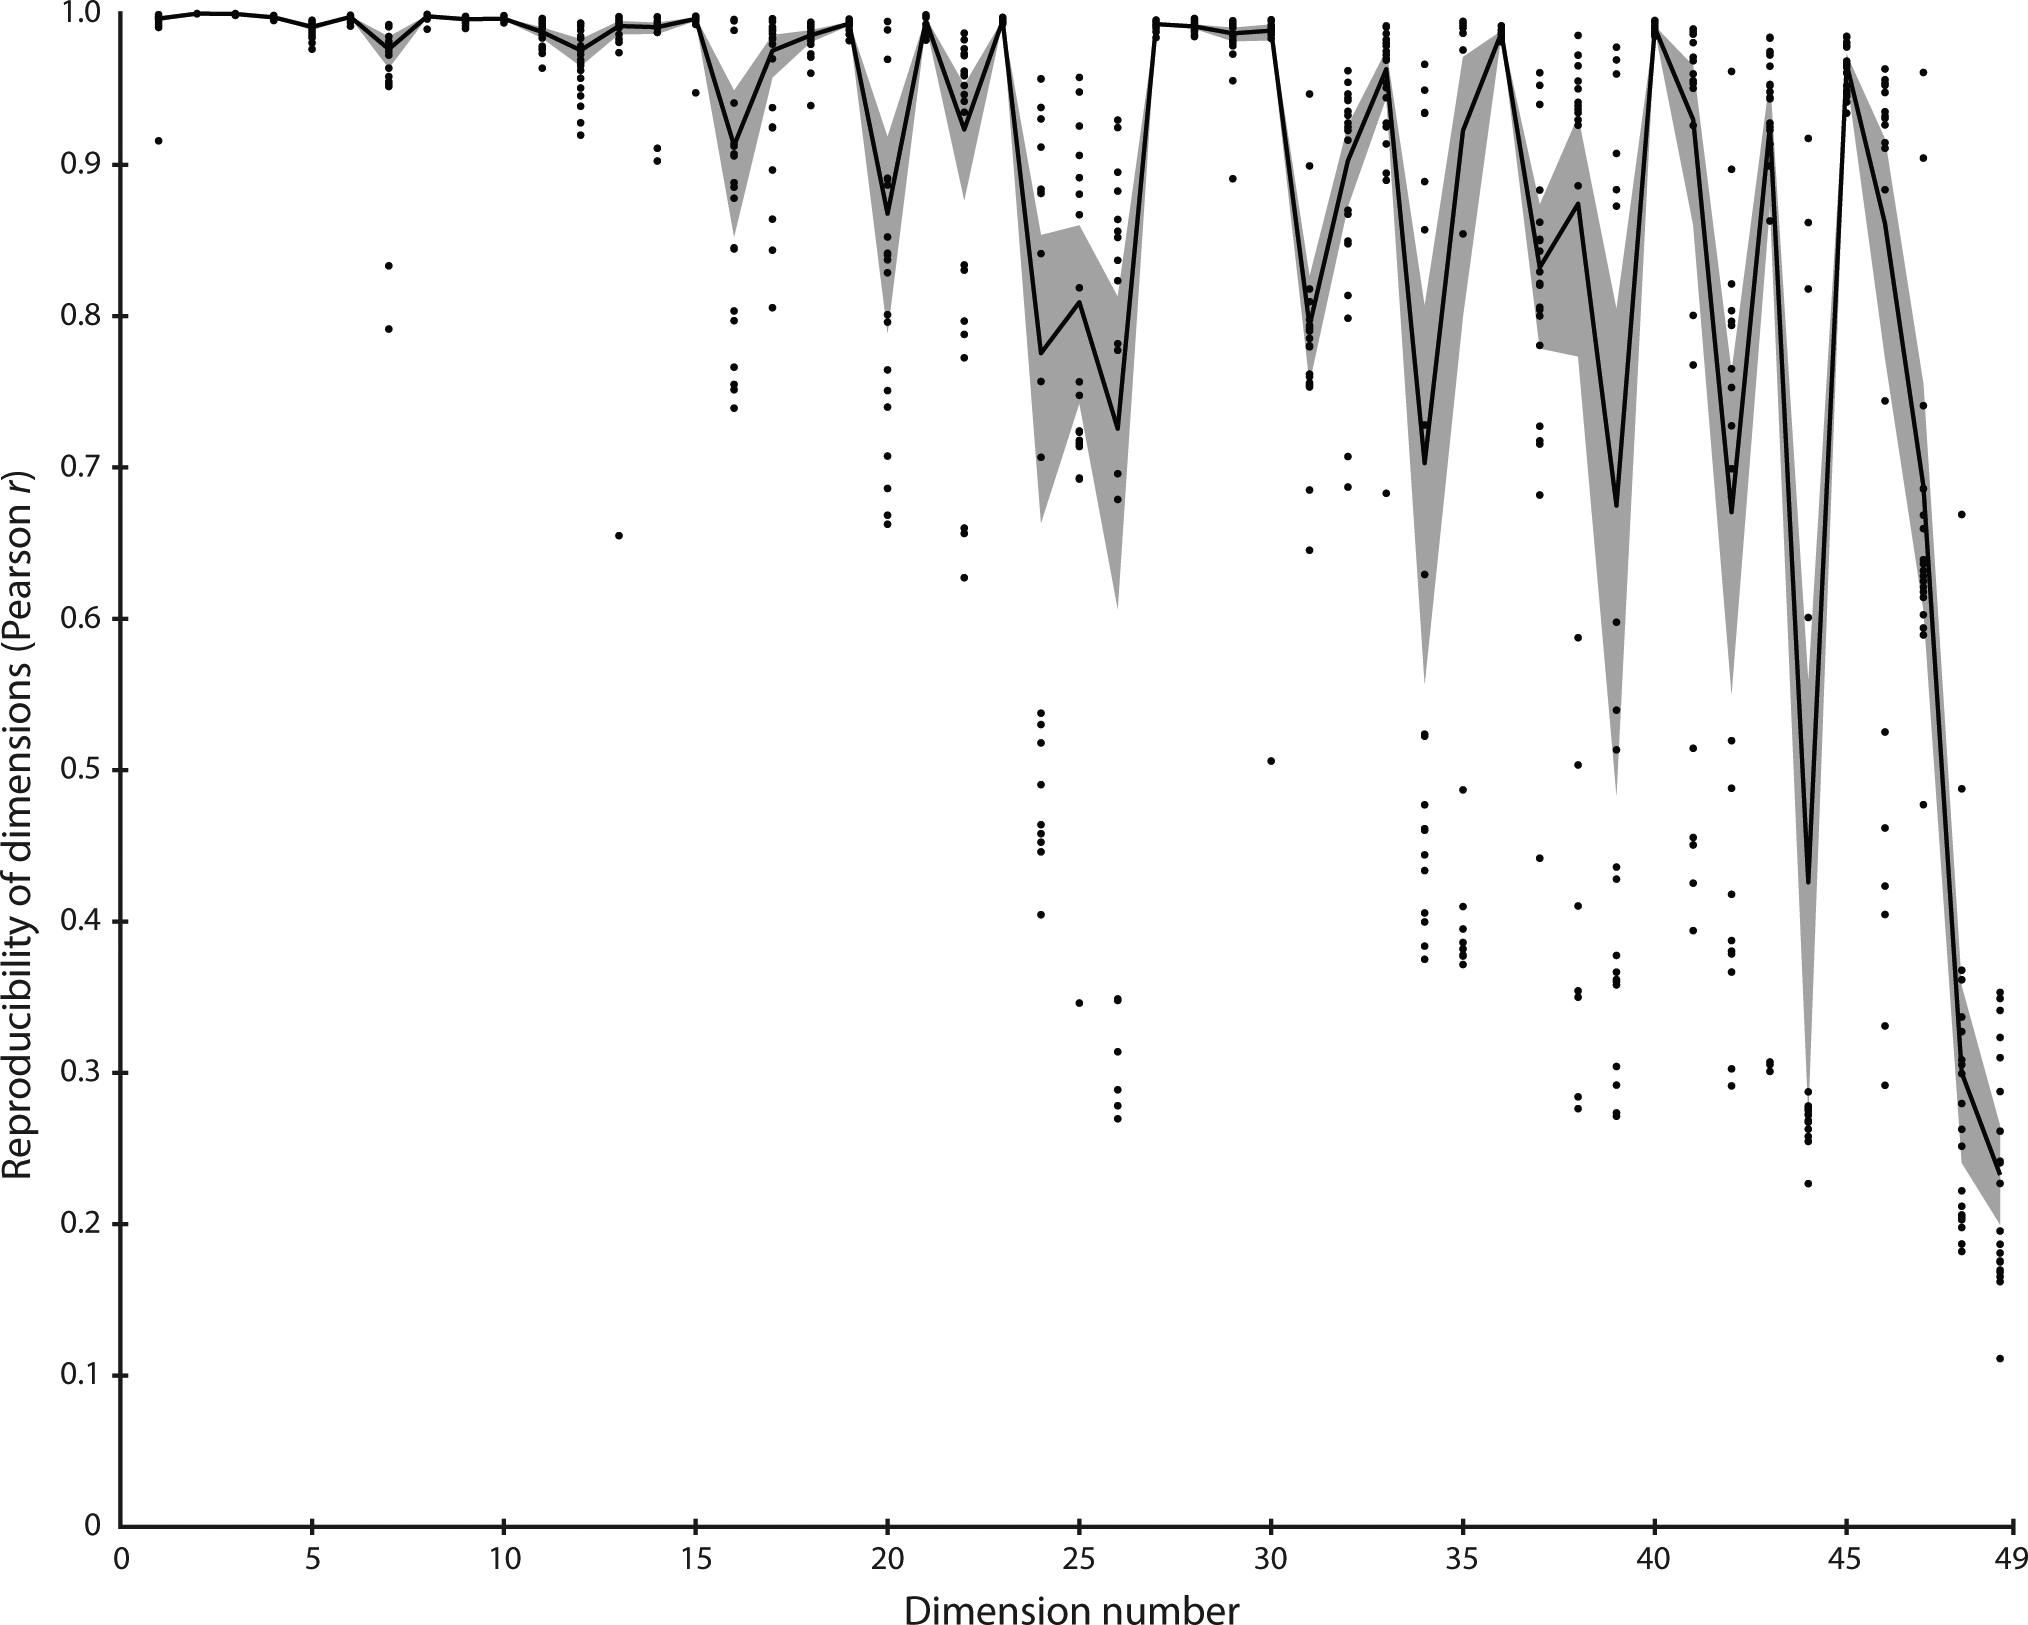
Reproducibility of dimensions in the chosen 49-dimensional embedding across 20 random initializations (see Extended Data Figure 2 for a list of all dimension labels). Shaded areas reflect 95% confidence intervals.
Extended Data Fig. 2. Labels and word clouds for all 49 model dimensions.
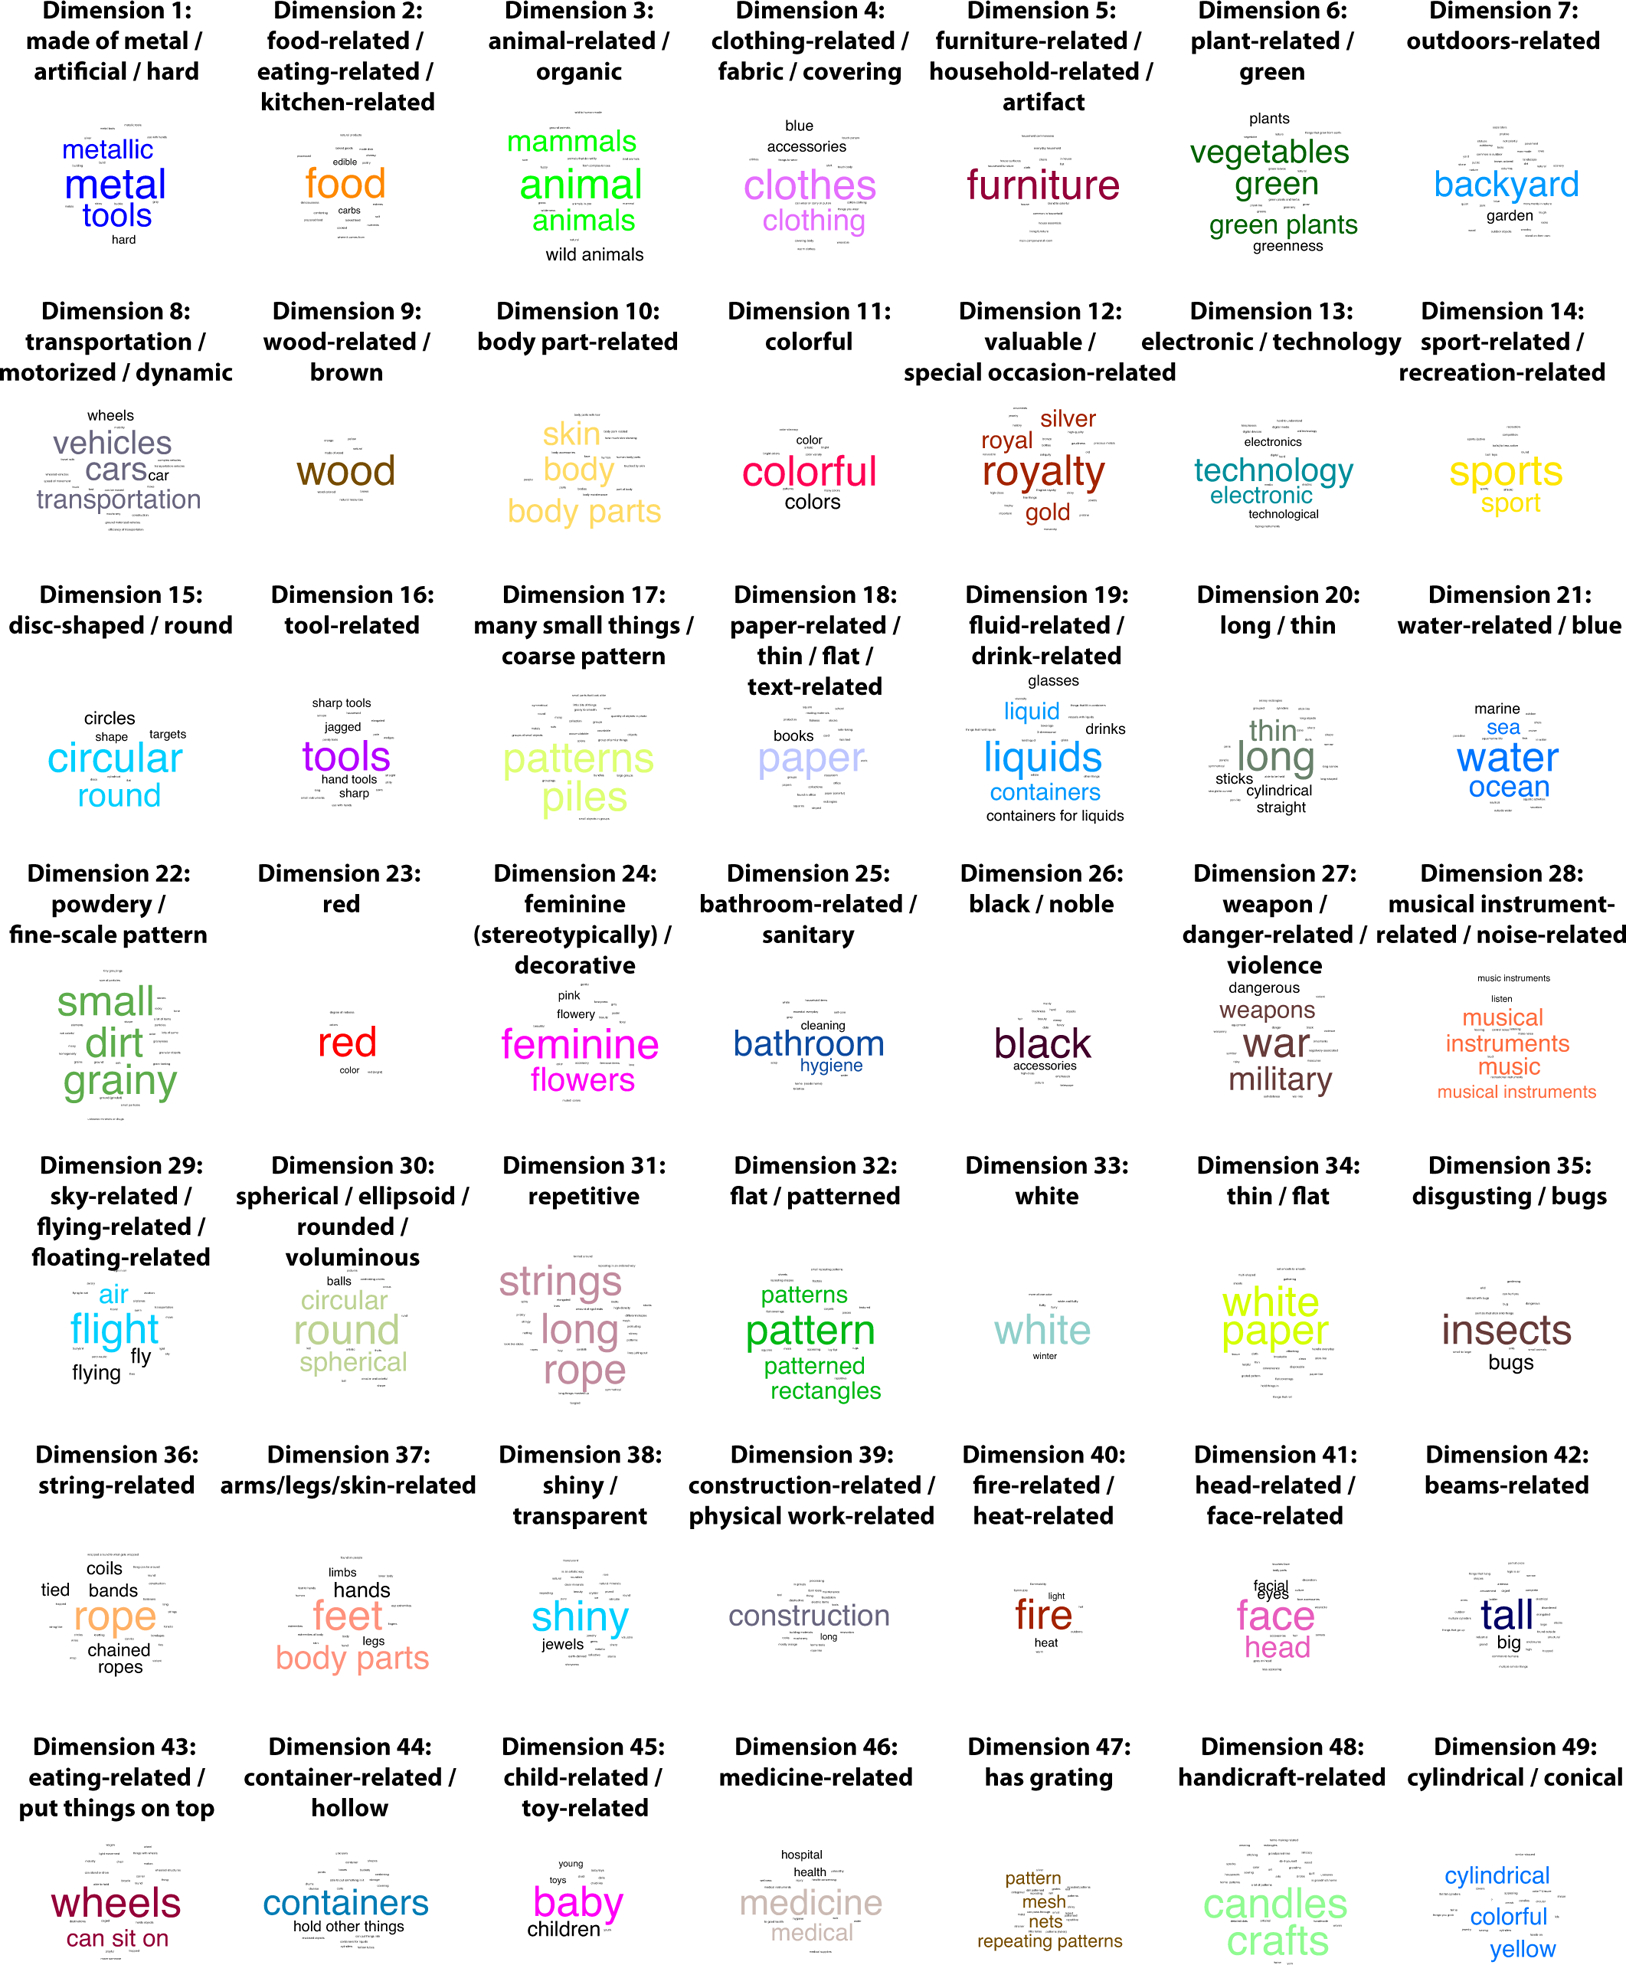
Labels for all 49 dimensions, with respective word clouds reflecting the naming frequency across 20 participants. The dimensions appear to reflect both perceptual and conceptual properties of objects. A visual comparison between labels and word clouds indicates a generally good agreement between participant naming and the labels we provided for the dimensions.
Extended Data Fig. 3. Category-typicality correlations.
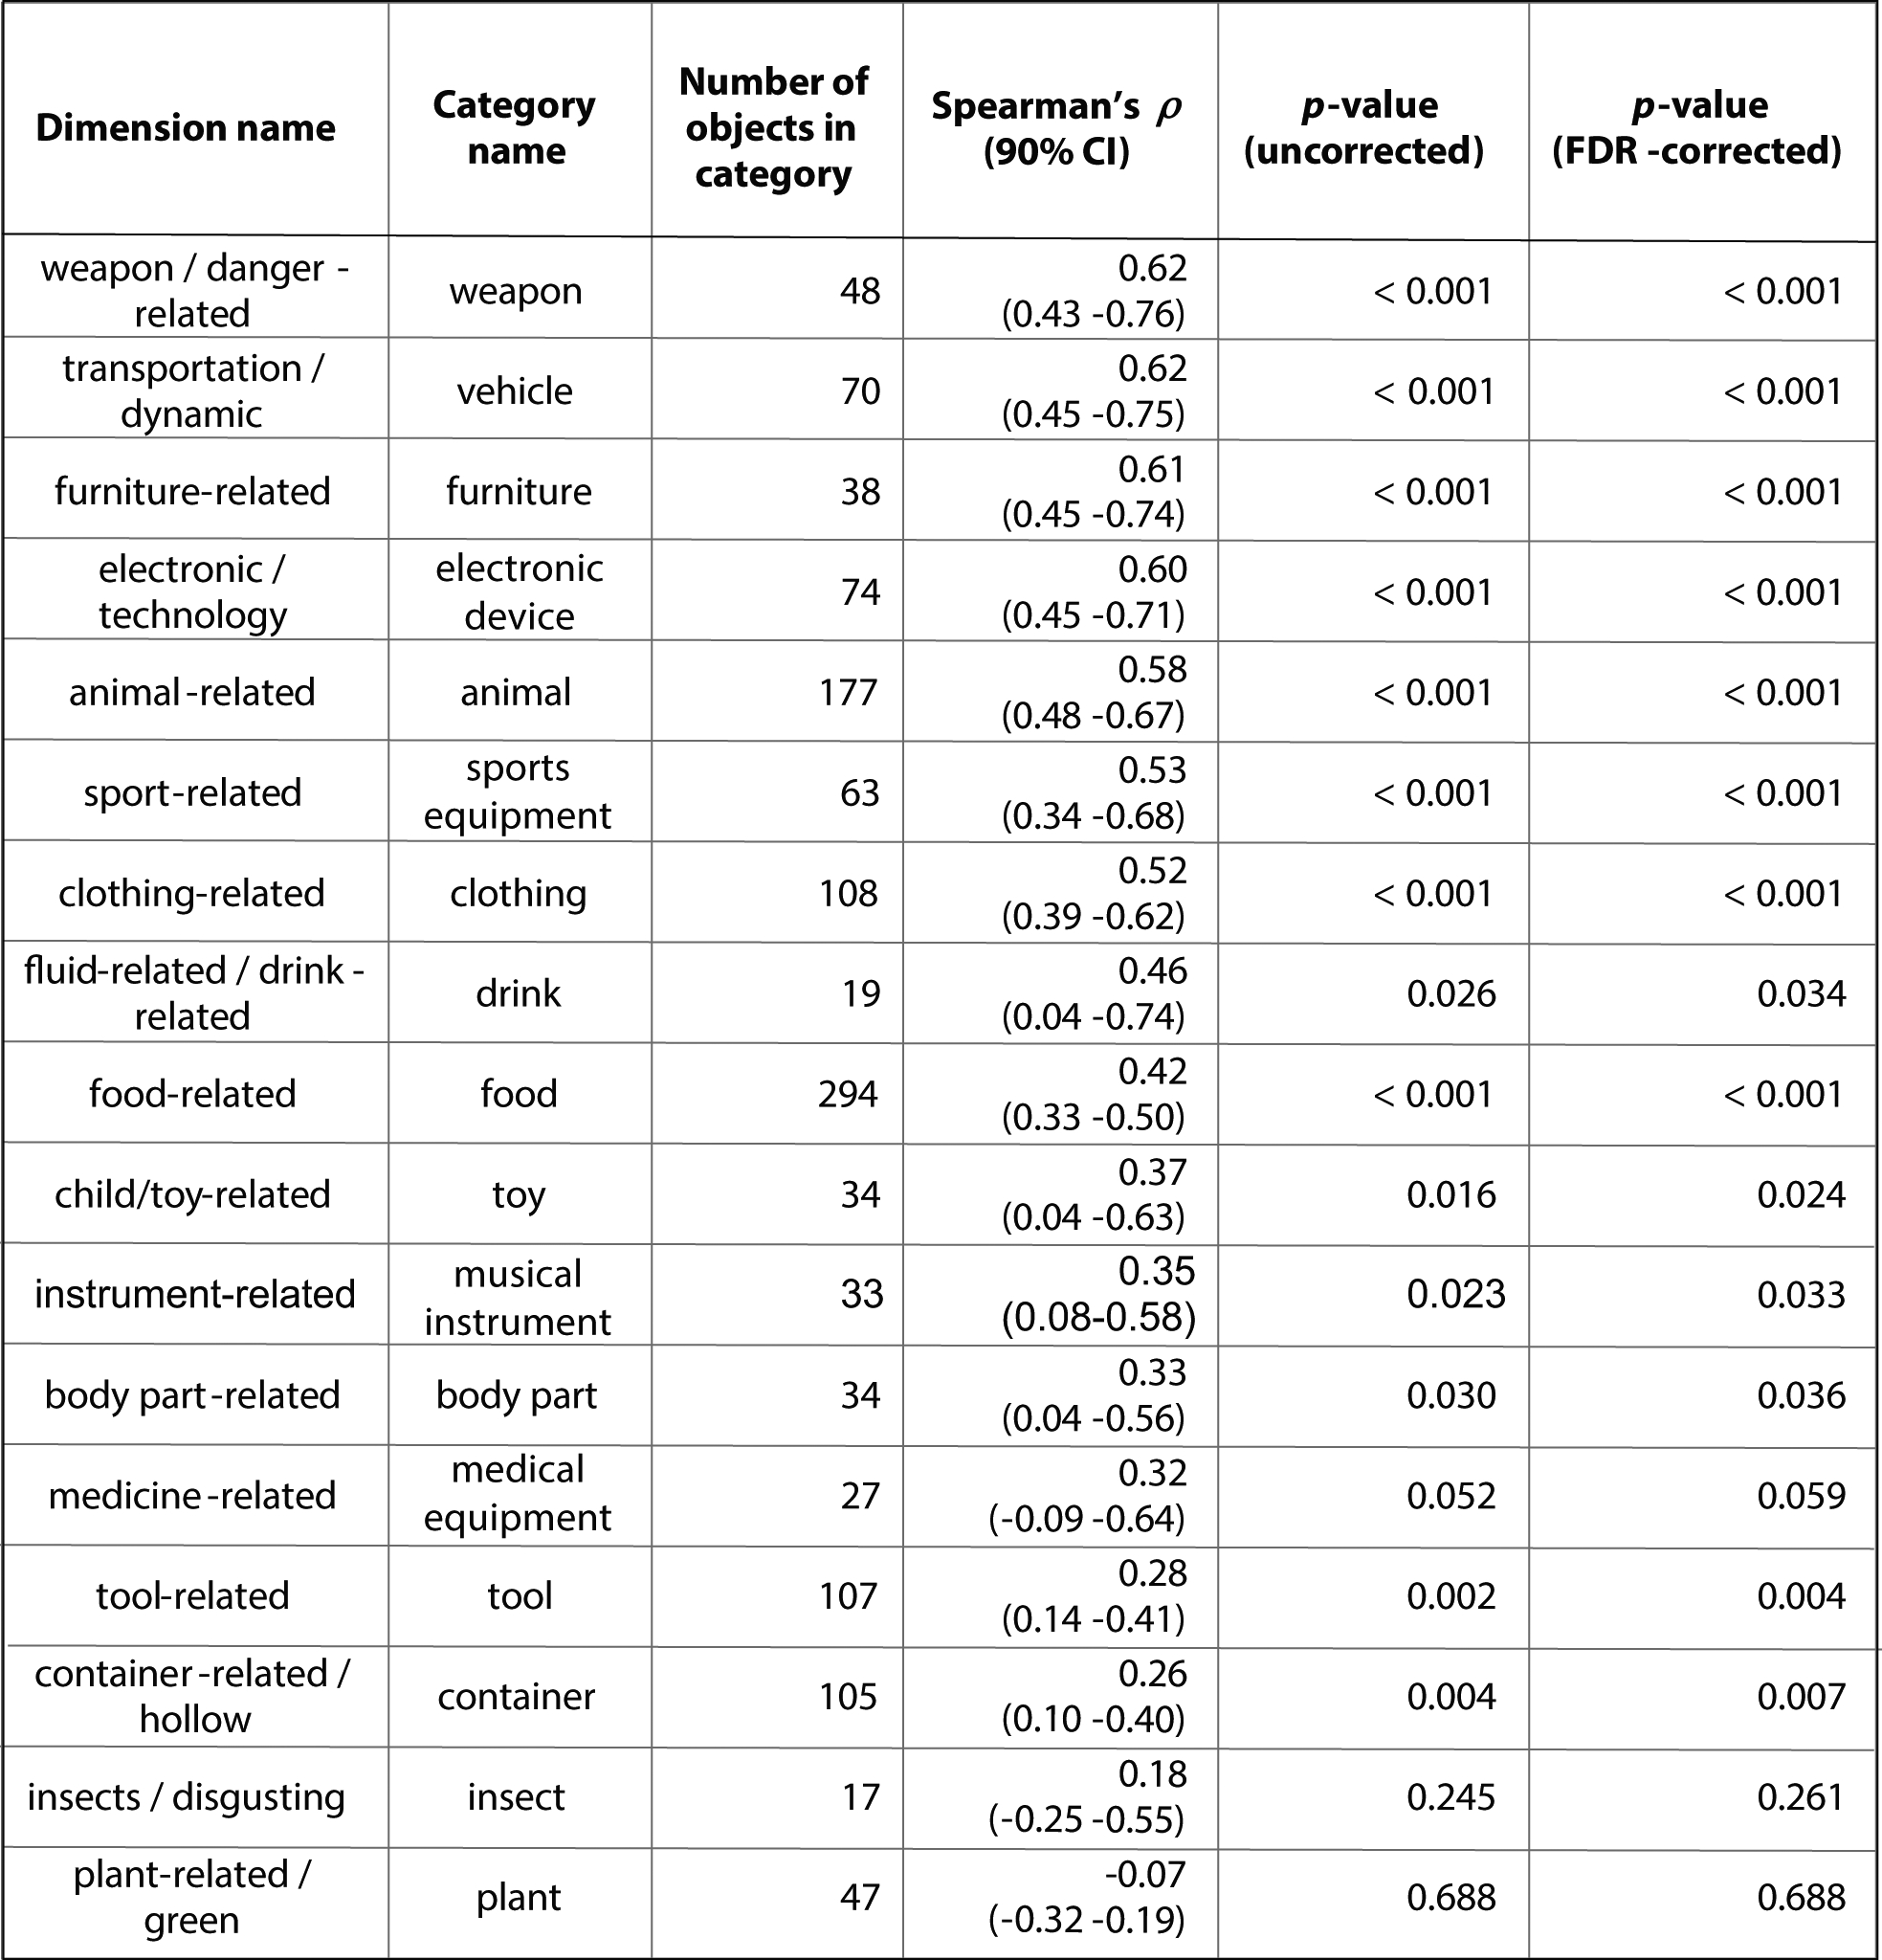
Detailed results of inferential statistical analyses correlating category-related dimensions with typicality of their category. One-sided p-values were generated using randomization tests and were controlled for false discovery rate (FDR) across multiple tests. 90% confidence intervals were used to complement one-sided tests.
Extended Data Fig. 4. Model performance and dimensionality as a function of training data size.
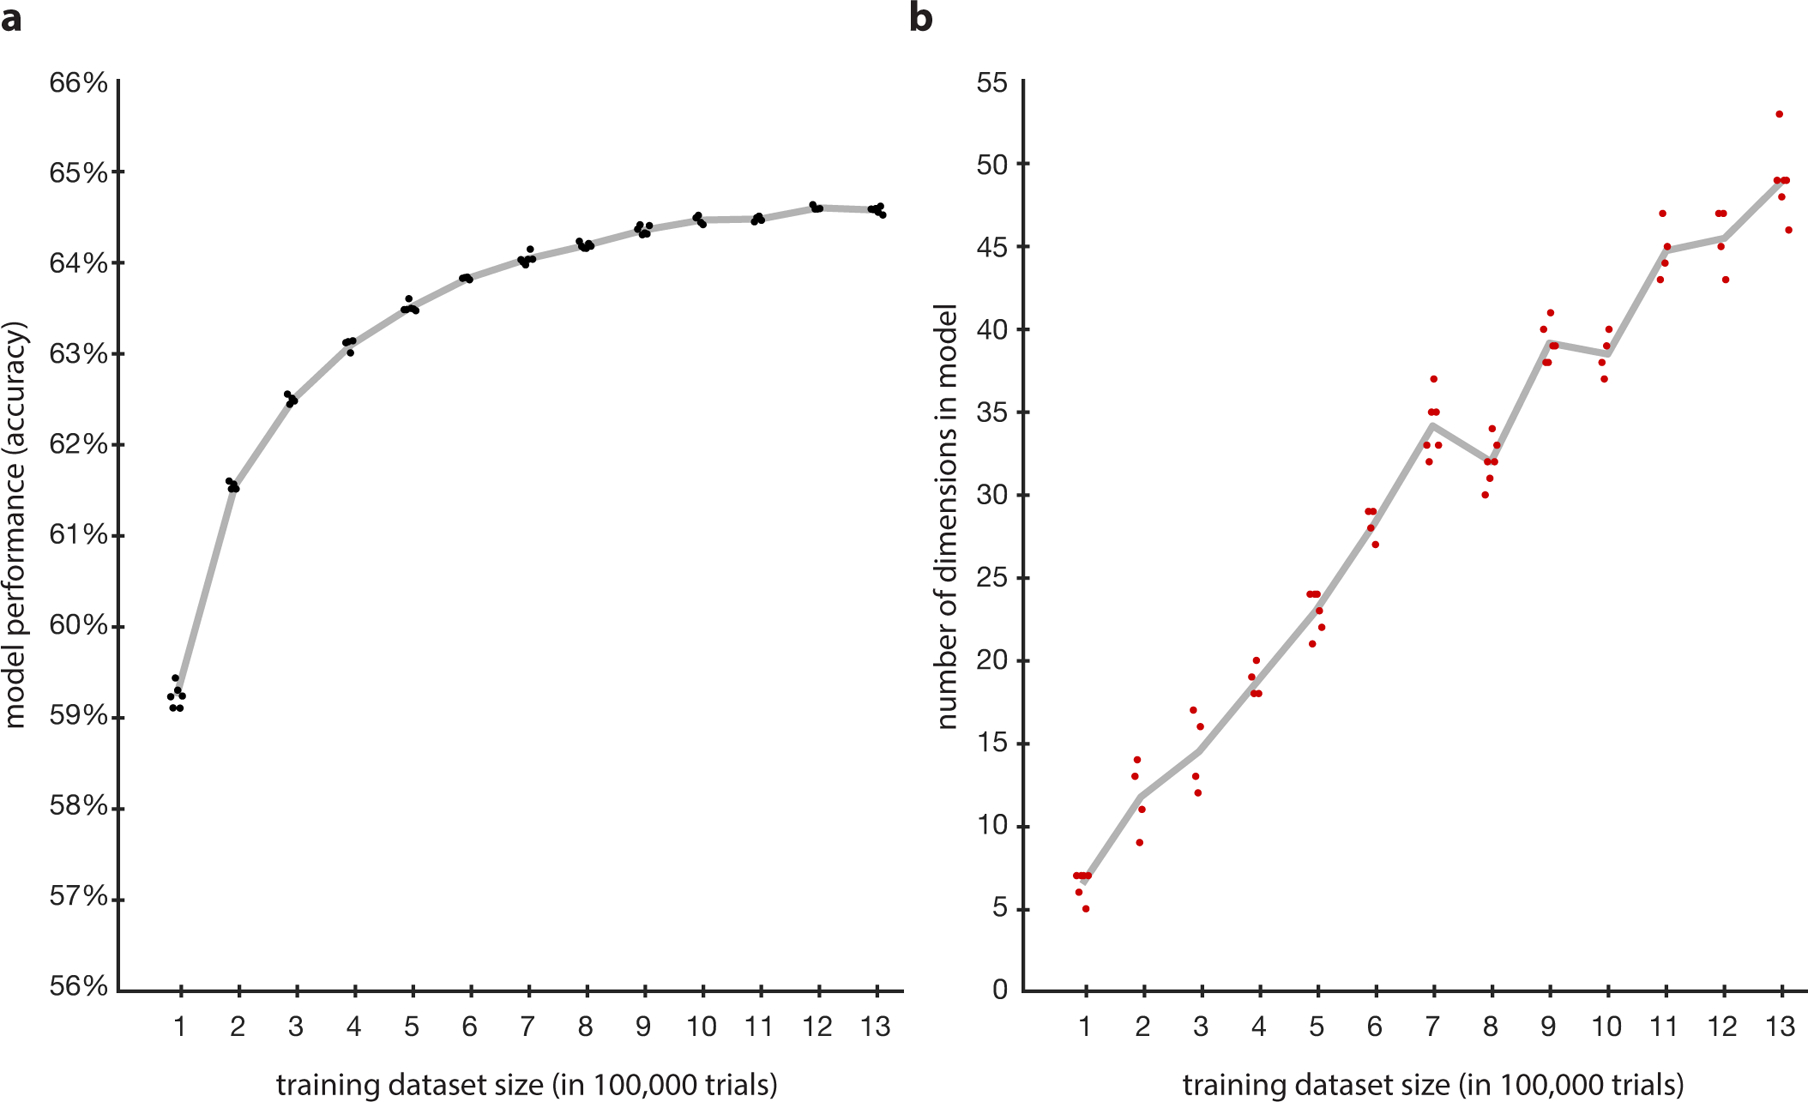
Model performance and dimensionality varied as a function of the amount of data used for training the model. Models were trained in steps of 100,000 trials. Six models with random initialization and random subsets of data were trained per step and all models applied to the same test data as in the main text, making it a total of 78 trained models. For each step, computation of up to two models did not complete on the compute server for technical reasons, making the total between 4 and 6 models per step. Results for each individual model and the average for each step are shown in the Figure. a. Model performance was already high for 100,000 trials as training data but increased with more data, saturating around the final model performance. b. Dimensionality increased steadily with the amount of training data.
Supplementary Material
Acknowledgments
We would like to thank Anna Corriveau for help with data collection in the laboratory experiment, Laura Stoinksi and Jonas Perkuhn for help with finding public domain images for this publication, and Ian Charest, Bradley Love, Alex Martin, and Patrick McClure for helpful discussions and/or comments on the manuscript. This research was supported by the Intramural Research Program of the National Institutes of Health (ZIA-MH-002909, ZIC-MH002968), under National Institute of Mental Health Clinical Study Protocol 93-M-1070 (NCT00001360). The funders had no role in study design, data collection and analysis, decision to publish or preparation of the manuscript.
Footnotes
Data availability
The learned embedding, triplet odd-one-out behavioral data for testing model performance, typicality scores, participant-generated dimension labels, and dimension ratings are available under https://osf.io/z2784. The behavioral data used for training the model are available from the corresponding author upon request.
Code availability
To reproduce relevant analyses and figures, relevant Matlab scripts and functions are available under https://osf.io/z2784. The computational modeling code to create an embedding is available from the corresponding author upon request.
Competing interests
The authors declare no competing interests.
References
- 1.Biederman I Recognition-by-components: A theory of human image understanding. Psychol. Rev 94, 115–147 (1987). [DOI] [PubMed] [Google Scholar]
- 2.Edelman S Representation is representation of similarities. Behav. Brain Sci 21, 449–467 (1998). [DOI] [PubMed] [Google Scholar]
- 3.Nosofsky RM Attention, similarity, and the identification–categorization relationship. J. Exp. Psychol. Gen 115, 39–57 (1986). [DOI] [PubMed] [Google Scholar]
- 4.Goldstone RL The role of similarity in categorization: Providing a groundwork. Cognition 52, 125–157 (1994). [DOI] [PubMed] [Google Scholar]
- 5.Rosch E, Mervis CB, Gray WD, Johnson DM & Boyes-Braem P Basic objects in natural categories. Cognit. Psychol 8, 382–439 (1976). [Google Scholar]
- 6.Hahn U & Chater N Concepts and similarity in Knowledge, concepts and categories (eds. Lamberts Koen & Shanks David) 43–92 (Psychology Press, 1997). [Google Scholar]
- 7.Rips LJ, Smith EE & Medin DL Concepts and categories: Memory, meaning, and metaphysics in The Oxford Handbook of Thinking and Reasoning (eds. Holyoak KJ & Morrison RG) 177–209 (Oxford University Press, 2012). [Google Scholar]
- 8.Rogers TT & McClelland JL Semantic cognition: A parallel distributed processing approach. (MIT press, 2004). [DOI] [PubMed] [Google Scholar]
- 9.Goldstone RL & Son JY Similarity in The Oxford Handbook of Thinking and Reasoning (eds. Holyoak KJ & Morrison RG) 155–176 (Oxford University Press, 2012). [Google Scholar]
- 10.Kriegeskorte N & Kievit RA Representational geometry: integrating cognition, computation, and the brain. Trends Cogn. Sci 17, 401–412 (2013). [DOI] [PMC free article] [PubMed] [Google Scholar]
- 11.Caramazza A & Shelton JR Domain-specific knowledge systems in the brain: The animate-inanimate distinction. J. Cogn. Neurosci 10, 1–34 (1998). [DOI] [PubMed] [Google Scholar]
- 12.Chao LL, Haxby JV & Martin A Attribute-based neural substrates in temporal cortex for perceiving and knowing about objects. Nat. Neurosci 2, 913–919 (1999). [DOI] [PubMed] [Google Scholar]
- 13.Konkle T & Oliva A Canonical visual size for real-world objects. J. Exp. Psychol. Hum. Percept. Perform 37, 23–37 (2011). [DOI] [PMC free article] [PubMed] [Google Scholar]
- 14.Murphy G The big book of concepts. (MIT press, 2004). [Google Scholar]
- 15.McRae K, Cree GS, Seidenberg MS & McNorgan C Semantic feature production norms for a large set of living and nonliving things. Behav. Res. Methods 37, 547–559 (2005). [DOI] [PubMed] [Google Scholar]
- 16.Devereux BJ, Tyler LK, Geertzen J & Randall B The Centre for Speech, Language and the Brain (CSLB) concept property norms. Behav. Res. Methods 46, 1119–1127 (2014). [DOI] [PMC free article] [PubMed] [Google Scholar]
- 17.Hebart MN et al. THINGS: A database of 1,854 object concepts and more than 26,000 naturalistic object images. PLoS ONE 14, e0223792 (2019). [DOI] [PMC free article] [PubMed] [Google Scholar]
- 18.Tversky A Features of similarity. Psychol. Rev 84, 327–352 (1977). [Google Scholar]
- 19.Barsalou LW Context-independent and context-dependent information in concepts. Mem. Cognit 10, 82–93 (1982). [DOI] [PubMed] [Google Scholar]
- 20.Maddox WT & Ashby FG Comparing decision bound and exemplar models of categorization. Percept. Psychophys 53, 49–70 (1993). [DOI] [PubMed] [Google Scholar]
- 21.Hoyer PO Modeling receptive fields with non-negative sparse coding. Neurocomputing 52, 547–552 (2003). [Google Scholar]
- 22.Murphy B, Talukdar P & Mitchell T Learning effective and interpretable semantic models using non-negative sparse embedding. in Proceedings of COLING 2012 1933–1950 (2012). [Google Scholar]
- 23.Shepard RN Stimulus and response generalization: A stochastic model relating generalization to distance in psychological space. Psychometrika 22, 325–345 (1957). [DOI] [PubMed] [Google Scholar]
- 24.Kobak D & Berens P The art of using t-SNE for single-cell transcriptomics. Nat. Commun 10, 1–14 (2019). [DOI] [PMC free article] [PubMed] [Google Scholar]
- 25.Shelton JR, Fouch E & Caramazza A The selective sparing of body part knowledge: A case study. Neurocase 4, 339–351 (1998). [Google Scholar]
- 26.Pedersen T, Patwardhan S & Michelizzi J WordNet::Similarity - Measuring the relatedness of concepts in HLT-NAACL 2004: Demonstration papers (eds. Dumais S, Marcu D & Roukos S) 38–41 (ACL Press, 2004). [Google Scholar]
- 27.Warrington EK & Shallice T Category specific semantic impairments. Brain 107, 829–853 (1984). [DOI] [PubMed] [Google Scholar]
- 28.Rips LJ Similarity, typicality, and categorization in Similarity and analogical reasoning (eds. Vosniadou Stella & Ortony Andrew) 21–59 (Cambridge University Press, 1989). [Google Scholar]
- 29.Smith EE & Sloman SA Similarity- versus rule-based categorization. Mem. Cognit 22, 377–386 (1994). [DOI] [PubMed] [Google Scholar]
- 30.Pilehvar MT & Collier N De-conflated semantic representations. in 2016 Conference on Empirical Methods in Natural Language Processing (EMNLP) 1680–1690 (2016). [Google Scholar]
- 31.Nosofsky RM, Sanders CA, Meagher BJ & Douglas BJ Toward the development of a feature-space representation for a complex natural category domain. Behav. Res. Methods 50, 530–556 (2018). [DOI] [PubMed] [Google Scholar]
- 32.Nosofsky RM, Sanders CA, Meagher BJ & Douglas BJ Search for the missing dimensions: Building a feature-space representation for a natural-science category domain. Comput. Brain Behav 3, 13–33 (2020). [Google Scholar]
- 33.Zheng CY, Pereira F, Baker CI & Hebart MN Revealing interpretable object representations from human behavior. Preprint at arXiv https://arxiv.org/abs/1901.02915 (2019).
- 34.Keil FC Constraints on knowledge and cognitive development. Psychol. Rev 88, 187–227 (1981). [Google Scholar]
- 35.Shepard RN The analysis of proximities: Multidimensional scaling with an unknown distance function .I. Psychometrika 27, 125–140 (1962). [Google Scholar]
- 36.Torgerson WS Multidimensional scaling: I. Theory and method. Psychometrika 17, 401–419 (1952). [Google Scholar]
- 37.Thurstone LL Multiple factor analysis. Psychol. Rev 38, 406–427 (1931). [Google Scholar]
- 38.Tranel D, Logan CG, Frank RJ & Damasio AR Explaining category-related effects in the retrieval of conceptual and lexical knowledge for concrete entities: Operationalization and analysis of factors. Neuropsychologia 35, 1329–1339 (1997). [DOI] [PubMed] [Google Scholar]
- 39.Shepard RN & Arabie P Additive clustering: Representation of similarities as combinations of discrete overlapping properties. Psychol. Rev 86, 87–123 (1979). [Google Scholar]
- 40.Navarro DJ & Lee MD Common and distinctive features in stimulus similarity: A modified version of the contrast model. Psychon. Bull. Rev 11, 961–974 (2004). [DOI] [PubMed] [Google Scholar]
- 41.Carlson TA, Ritchie JB, Kriegeskorte N, Durvasula S & Ma J Reaction time for object categorization is predicted by representational distance. J. Cogn. Neurosci 26, 132–142 (2013). [DOI] [PubMed] [Google Scholar]
- 42.Yee E & Thompson-Schill SL Putting concepts into context. Psychon. Bull. Rev 23, 1015–1027 (2016). [DOI] [PMC free article] [PubMed] [Google Scholar]
- 43.Charest I, Kievit RA, Schmitz TW, Deca D & Kriegeskorte N Unique semantic space in the brain of each beholder predicts perceived similarity. Proc. Natl. Acad. Sci 111, 14565–14570 (2014). [DOI] [PMC free article] [PubMed] [Google Scholar]
- 44.De Haas B, Iakovidis AL, Schwarzkopf DS & Gegenfurtner KR Individual differences in visual salience vary along semantic dimensions. Proc. Natl. Acad. Sci 116, 11687–11692 (2019). [DOI] [PMC free article] [PubMed] [Google Scholar]
- 45.Peterson JC, Abbott JT & Griffiths TL Evaluating (and improving) the correspondence between deep neural networks and human representations. Cogn. Sci 42, 2648–2669 (2018). [DOI] [PubMed] [Google Scholar]
- 46.Rajalingham R et al. Large-scale, high-resolution comparison of the core visual object recognition behavior of humans, monkeys, and state-of-the-art deep artificial neural networks. J. Neurosci 38, 7255–7269 (2018). [DOI] [PMC free article] [PubMed] [Google Scholar]
- 47.Jozwik KM, Kriegeskorte N, Storrs KR & Mur M Deep convolutional neural networks outperform feature-based but not categorical models in explaining object similarity judgments. Front. Psychol 8, 1726 (2017). [DOI] [PMC free article] [PubMed] [Google Scholar]
- 48.Iordan MC, Giallanza T, Ellis CT, Beckage N & Cohen JD Context Matters: Recovering Human Semantic Structure from Machine Learning Analysis of Large-Scale Text Corpora. Preprint at arXiv https://arxiv.org/abs/1910.06954 (2019). [DOI] [PMC free article] [PubMed]
- 49.Bauer AJ & Just MA Neural representations of concept knowledge in The Oxford Handbook of Neurolinguistics (eds. de Zubicaray GI & Schiller NO) 518–547 (Oxford University Press, 2019). [Google Scholar]
- 50.Binder JR et al. Toward a brain-based componential semantic representation. Cogn. Neuropsychol 33, 130–174 (2016). [DOI] [PubMed] [Google Scholar]
- 51.Huth AG, Nishimoto S, Vu AT & Gallant JL A continuous semantic space describes the representation of thousands of object and action categories across the human brain. Neuron 76, 1210–1224 (2012). [DOI] [PMC free article] [PubMed] [Google Scholar]
- 52.Cichy RM, Kriegeskorte N, Jozwik KM, van den Bosch JJ & Charest I The spatiotemporal neural dynamics underlying perceived similarity for real-world objects. NeuroImage 194, 12–24 (2019). [DOI] [PMC free article] [PubMed] [Google Scholar]
- 53.Bankson BB, Hebart MN, Groen IIA & Baker CI The temporal evolution of conceptual object representations revealed through models of behavior, semantics and deep neural networks. NeuroImage 178, 172–182 (2018). [DOI] [PubMed] [Google Scholar]
- 54.Abadi M et al. Tensorflow: A system for large-scale machine learning. in 12th Symposium on Operating Systems Design and Implementation 265–283 (2016). [Google Scholar]
- 55.Kingma DP & Ba J Adam: A method for stochastic optimization. Preprint at arXiv https://arxiv.org/abs/1412.6980 (2015).
Associated Data
This section collects any data citations, data availability statements, or supplementary materials included in this article.


