

Abstract
The consolidation of spatial memory depends on the reactivation (‘replay’) of hippocampal place cells that were active during recent behavior. Such reactivation is observed during sharp wave-ripples (SWRs), synchronous oscillatory events that occur during non-REM sleep1–8 and whose disruption impairs spatial memory3,5,6,8. Although the hippocampus encodes a wide range of non-spatial forms of declarative memory, it is not yet known whether SWRs are necessary for non-spatial memory. Moreover, although SWRs can arise from either the hippocampal CA37 or CA29 regions, their relative importance for memory consolidation is unknown. Here we examined the role of SWRs during the consolidation of social memory, the ability of an animal to recognize and remember a conspecific, focusing on CA2 because of its critical role in social memory10–12. We found that ensembles of CA2 pyramidal neurons that were active during social exploration of novel conspecifics were reactivated during SWRs. Importantly, disruption or enhancement of CA2 SWRs suppressed or prolonged social memory, respectively. Thus, SWR reactivation of hippocampal firing related to recent experience appears to be a general mechanism for binding spatial, temporal and sensory information into high-order memory representations, including social memory.
To assess the role of SWRs in social memory, we employed a social recognition task that assessed social memory formation in mice without interference from other social behaviors. In this task, a subject mouse was habituated to a square arena with two empty wire cups in opposite corners. After habituation, we placed a novel stimulus mouse in each of the cups (mouse S1 and S2). In trial 1 the subject mouse was allowed to explore the arena for 5 min, followed by a second 5 min trial with the positions of the same stimulus mice rotated 180° relative to trial 1 (Fig.1a, Extended Data Fig.1a,b). A one-hour sleep session preceded (pre-sleep) and followed (post-sleep) the two learning trials. After the post-sleep period we exchanged one of the stimulus mice (chosen at random) for a third novel mouse (N) and performed a memory recall trial.
Figure 1: Encoding of conspecifics by CA2 pyramidal cell activity.

a) Schema of the task. b) Social memory in wild-type mice during recall trial quantified by discrimination index (DI, see Methods; n = 13). ***P < 0.0001, Wilcoxon sign-rank test. c) Histological verification of probe location in CA1, CA2 and CA3 regions. Blue, DAPI staining; green, GFP; red, PCP4 immunolabeling of CA2 pyramidal cells. d) Example firing maps of social-invariant and social-remapping CA2 place cells. e) Pearson’s correlation values for unrotated (std.) and rotated (rot.) place fields in trials 1 and 2 for social-invariant (blue; n = 203 from 13 mice; P < 10−54, sign-rank test) and social-remapping (red; n=120 from 13 mice; P < 10−16) cells. f) Social-remapping cells had place fields closer to the location of the stimulus mice than social-invariant cells (P < 10−10, rank-sum test). g) Proportion of social-invariant and social-remapping cells per region. Social-remapping cells were more abundant in CA2 than CA1 (P < 0.05, Fisher’s test) or CA3 (P < 0.05). CA1: 55 social-invariant and 14 social-remapping cells; CA2: 131 spatial and 101 social-remapping cells; CA3: 17 social-invariant and 5 social-remapping cells. h) eArch3.0-GFP expression (green) in CA2 pyramidal cells of an Amigo2-Cre mouse (top) and in CA1 cells of an Lypd1-Cre mouse (bottom). Blue, DAPI. i) Yellow light activated eArch3.0 during exploration of either S1 or S2 during trials 1 and 2. j) Social memory recall was present in control mice (Cre+ and Cre- animals with virus and no light stimulation; DI significantly >0; P < 0.001, t-test). Silencing of CA2 around a given stimulus mouse during learning trials (CA2 silenced stim. group) abolished memory of that mouse in recall trial (DI not significantly>0; n =10 mice; P > 0.05, t-test) but did not alter social memory for the stimulus mouse around which light was not applied (CA2 unsilenced stim group; DI significantly > 0; n =11 mice, P < 0.001, t-test); CA1 silencing had no effect (DI significantly >0; n = 10; P < 0.001, t-test). Multiple comparison test and Tukey post hoc tests between the groups revealed that the CA2-silenced stim. group was significantly different than the wild-type group (P < 0.001), CA1-silenced group (P < 0.001) and CA2-unsilenced stim group (P < 0.01).
Animals interacted for equal times with S1 and S2 in the two learning trials and showed a significant preference for the third novel animal introduced in the recall trial (Fig.1b), with no differences in other behavioral parameters (Extended Data Fig.1c–d). The preference for the novel mouse demonstrated the successful encoding and consolidation of social memory of the stimulus mouse. To explore the activity of different hippocampal regions during this task, we implanted high-density silicon probes in the dorsal hippocampus (Fig.1c, Extended Data Fig.2, Supplementary Table 1) and analyzed the spatial firing patterns of pyramidal cells during the task (140 CA1 neurons from 8 mice; 473 CA2 neurons from 13 mice; 64 CA3 neurons from 5 mice).
CA2 cells remap to a social stimulus
To characterize how the hippocampus encodes a novel social episode, we focused on two main classes of place cells that we observed when we switched the positions of the stimulus mice from learning trial 1 to learning trial 2 to the recall trial (see Methods). Some cells, which we termed “social-invariant cells”, displayed stable place fields relative to the arena across trials (upper Fig.1d, Extended Data Fig.3). In contrast, other cells, termed “social-remapping cells”, showed place fields that remapped between the trials in a way that maintained the firing field position relative to the location of a particular stimulus mouse (bottom Fig.1d, Extended Data Fig.3). We quantified this phenomenon by comparing the spatial correlation of firing maps between the two learning trials with the correlation obtained by rotating the map in trial 2 by 180° to match the position of the same stimulus mice in trial 1 (Extended Data Fig.4). We performed a similar comparison between place fields around the stimulus mouse in the recall trial and place fields around that same stimulus mouse in the relevant learning trial (the one in which it was in the opposite corner as the recall trial).
Unsupervised clustering of the unrotated versus rotated correlation values for all neurons revealed several clusters. One subpopulation of neurons (30% of the cells) had maximal unrotated and minimal rotated correlation values, which we defined as social-invariant place cells. A second subpopulation (18% of the cells) had maximal rotated and minimal unrotated correlation values when compared in the two learning trials (Fig.1e, Extended Data Fig.4a–d) and when compared in the recall trial with the relevant learning trial (Extended Data Fig.4e); which we defined as social-remapping place cells.
Place fields of social-remapping cells lay closer to the cups containing stimulus mice (Fig.1f, Extended Data Fig.4f) but these cells otherwise displayed similar properties to social-invariant cells (Extended Data Fig.4g–h, 5g), with similar immobility modulation9,13, head direction tuning14 and preferred theta phase9 (Extended Data Fig.5h–m). Social-remapping cells were significantly more abundant in CA2 than in CA1 or CA3 (Fig.1g), consistent with the selective role of dorsal CA2 in social memory10–12.
Dorsal CA2 is needed for social memory
To explore the relevance of CA1 and CA2 pyramidal neuron social coding properties, we explored their contributions to performance of the social memory task by expressing the inhibitory opsin archaerhodopsin (AAV2/5 EF1a. DIO.eArch3.0-eYFP) using Cre-dependent viral injections in dorsal CA2 or dorsal CA1 of the CA2-selective Amigo2-Cre mouse line10 or the CA1-selective Lypd1-Cre line15, respectively. The animals were implanted with bilateral optic fibers over CA2 or CA1 (Fig.1h). We silenced CA2 or CA1 pyramidal cells by applying yellow light during the interaction times with either S1 or S2 (chosen at random for each experiment) during the two learning trials (Fig.1i). We found that silencing of CA2 but not CA1 disrupted social memory of the stimulus mouse around which the light pulses were applied but did not affect memory of the other stimulus mouse (Fig.1j; F(3,41) = 13.42 one-way ANOVA; P < 0.003 for CA2 silencing and P > 0.05 for CA1, Tukey post-hoc test). These results extend previous reports on the importance of CA2 for social memory formation10–12 by showing the specificity for CA2 activity in learning the identity of a given animal.
To determine whether CA2 plays a general role in novelty encoding, we employed a behavioral paradigm analogous to the social memory task used above. We had a mouse explore two novel objects in learning trial 1, whose positions were then exchanged in learning trial 2. This is known to cause remapping of place fields in a fraction of CA1 neurons16. After a 1-hour interval, a memory recall test was performed by measuring relative exploration times for one object from the learning trials versus a third novel object (Extended Data Fig.6). As expected, animals preferred to explore the novel object during the recall trial (Extended Data Fig. 6b), similar to their preference for a novel animal. To examine the relative importance of dorsal CA1 versus dorsal CA2 for performance of this task, we expressed Arch3.0 in each region selectively, as described above. In contrast to the finding that dorsal CA2 but not dorsal CA1 was critical for social memory, we observed a significant impairment in novel object recognition memory when we optogenetically silenced CA1 but not when we silenced CA2 (Extended Data Fig.6b, F(2,27) = 5.53 one-way ANOVA; P < 0.007, P > 0.05, Tukey post-hoc test for CA1 and CA2 respectively). This confirms previous results that dorsal CA2 is not required for novel object memory10.
Next we examined whether CA2 place fields remapped when we swapped the position of the novel objects. We calculated the rotated versus unrotated correlations of the firing maps upon exchange of object location during the object learning trials to classify place cells as “object-remapping” or “object-invariant”, similar to our classification of social-remapping cells. We found that all CA regions contained both object-remapping and object-invariant cells (Extended Data Fig.6c–d), just as they all contained social-remapping and social-invariant place cells. However, whereas CA2 contained a significantly higher fraction of social-remapping place cells than found CA1 or CA3, CA2 had a significantly lower proportion of object-remapping place cells compared to CA1 and CA3 (Extended Data Fig.6e–g). Thus, although the three CA regions contain distinct populations of cells whose firing is selectively tuned to objects, conspecifics and spatial location, CA2 is enriched in social representations compared to its hippocampal neighbors, consistent with previous reports10,11.
Social memory requires CA2 SWRs
Given the importance of SWRs in spatial memory consolidation1,3,5,7 and the importance of CA2 in generation of a significant fraction of SWRs9, we next explored whether SWRs provide a neural substrate of social memory consolidation in the social recognition task. We observed a significant increase in the rate of SWRs during the post-sleep session compared to the pre-sleep session (Fig.2a), similar to the increase in SWRs seen in rodents following spatial learning17.
Figure 2: Effect of sharp-wave ripple disruption on social memory consolidation.
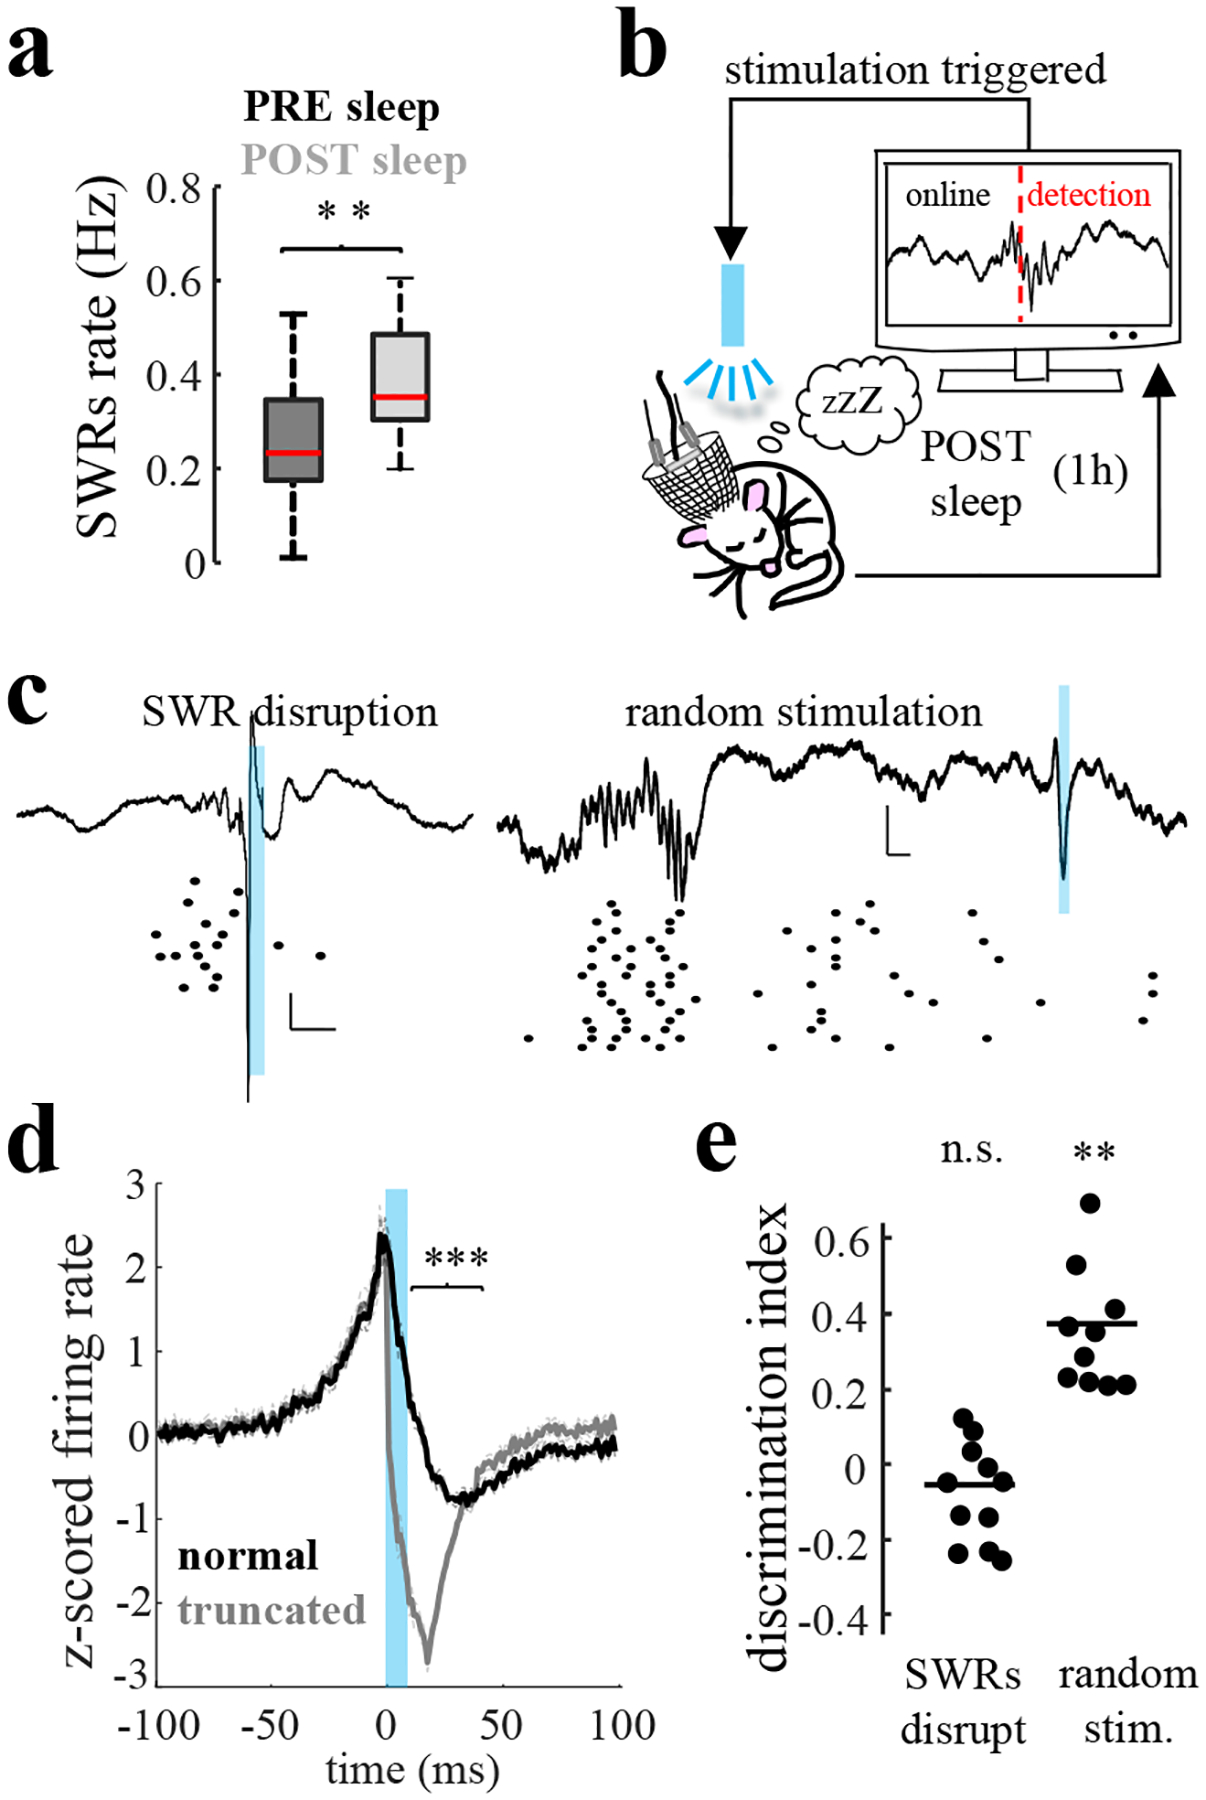
a) SWR rate in CA2 increased during post-sleep session following social learning trials compared to pre-sleep sessions (n = 17 mice; P = 0.007, rank-sum test). b) Schematic of SWR disruption during sleep consolidation periods. c) SWR disruption using strong activation of ChR2 with 10-ms high-intensity blue light pulses upon real-time detection of ripples in CA2. Examples of closed-loop ripple truncation and random delay stimulation. Traces show LFPs from CA2 pyramidal layer (top) and raster plot firing of CA2 units (bottom). Vertical scale, 0.2 mV; horizontal scale, 20 ms. d) Average firing rate of pyramidal cells decreased during truncated compared to normal SWRs (P < 10−4, rank-sum test; n = 7). e) Social memory recall was impaired following CA2 ripple disruption (P > 0.05, n = 7 mice) but preserved following random stimulation (P = 0.002, n = 7).
To test whether SWRs are necessary for social memory consolidation, we performed closed-loop optogenetic disruption of SWRs during the consolidation stage (post-sleep) of the task in Amigo2-Cre mice expressing ChR2 (AAV2/5 EF1a.DIO.hChR2.eYFP) in CA2 (Fig.2b). Strong photostimulation of these neurons with a brief intense light pulse upon SWR detection8 resulted in the premature termination of SWRs, with a period of post-excitation inhibition of CA2 firing (Fig.2c, Extended Data Fig.7a,d). In control sessions, we delivered the same light pulse after a random delay upon SWRs detection (Fig.2c). We found that SWRs disruption during the post-sleep session impaired social memory recall whereas random stimulation had no effect (Fig.2d). As an alternative approach, we silenced CA2 neurons with photoactivation of eArch3.0 for 30 seconds once every two minutes during the post-sleep period (Extended Data Fig.7e–f), which reduced the number of SWRs and significantly impaired social memory recall (Extended Data Fig.7g–h). Together, these results demonstrate that CA2 SWRs are necessary for social memory consolidation. Of note, in contrast to the inhibitory effects on SWRs of brief periods of CA2 silencing, longer periods of CA2 silencing can increase occurrence of SWRs18, likely as a result of disinhibition of CA319.
CA2 SWRs replay social memory
SWRs during sleep following spatial learning have been shown to reactivate place cells that fired during spatial exploration, serving to replay recent spatial experience1,2,4,7,20,21. To explore whether social firing was also reactivated during SWRs, we compared the firing correlations of all pairs of hippocampal neurons during social exploration with the correlations during SWRs in both post-sleep and pre-sleep sessions (Fig.3a). To quantify the correlation between firing during experience and sleep we adopted the explained variance (EV) method (Extended Data Fig.8a; Methods)21,22, which was previously used to assess reactivation of CA1 neurons following spatial exploration21,22. As a measure of chance levels, we calculated the reverse explained variance (REV) (see Methods).
Figure 3: Reactivation during sleep of cell ensembles active during prior social learning.

a) Pearson’s correlation coefficients for all pairs of neurons measured during pre-sleep (left) or post-sleep (right) versus correlations measured during social learning trials. Lines show least-square linear fits for pre-sleep (R = 0.165, 0.189 and 0.213 and P = 0.031, 0.029 and 0.035 for CA1, CA2 and CA3, respectively) and post-sleep (R = 0.231, 0.223 and 0.211 and P = 0.034, 0.035 and 0.035 for CA1, CA2 and CA3, respectively). Note increase in correlation in post-sleep (P < 0.0001 for CA1, CA2 and CA3 groups, Wilcoxon sign-rank test). b) EV (see Methods) was significantly higher than REV (chance) for CA2 (P = 0.0028, n = 13 mice) and CA1 (P = 0.03, n = 13 mice) cells but not CA3 (P > 0.05, n = 7 mice). c) EV for social-remapping versus social-invariant cells in each area (P < 0.05 for CA2, sign-rank test). d) Example of assembly detection. Each line of raster plot shows firing of one unit; units in example assembly are colored. Bottom trace, activation strength for example assembly. e) Social-related assembly strength (see Methods; [assembly strength inside minus strength outside social interaction zones]/[sum of strengths]) was significantly greater than 0 in CA1 (P < 10−6, sign-rank test) and CA2 (P < 10−19) but not CA3 (P > 0.05). + Outliers. f) Activation of social discriminant assemblies: those that are stronger around one mouse versus the other. Examples of one CA2 assembly (yellow line) more active around mouse S1 than S2 (grey and green bars, respectively) and a second (blue line) more active around mouse S2. g) Fraction of social discriminant assemblies in each region (P < 0.0034 and 10−4 for CA2 versus CA1 and CA3, respectively, Fisher’s test). h) Assembly reactivation strength during post-sleep sessions (see Methods) was higher for discriminant compared to non-discriminant assemblies in CA1 (P = 0.043, rank-sum test) and CA2 (P = 0.0032) but not CA3 (P = 0.6837).
Using this method, we found significant levels of reactivation in CA1 and CA2, but not CA3, during post-sleep session SWRs (Fig.3b). Moreover, optogenetic disruption of SWRs, but not random stimulation, abolished this reactivation (Extended Data Fig.8b). We also observed significant levels of reactivation when we calculated EV based on neural firing throughout the entire non-REM sleep period, not just during SWRs. However, there was no significant reactivation during REM sleep epochs (Extended Data Fig.8c–d), in line with previous reports21,22.
We found similar region-specific patterns of reactivation when we analyzed a subsample of cells of equal number in each region (Extended Data Fig.8e). Of further interest, social-remapping cells had higher EV values than social-invariant cells in both CA2 and the other areas (Fig.3c, Extended Data Fig.8f–g), indicating the preferential reactivation of cells encoding social representations following social experience.
We hypothesized that groups of cells that were co-active during a social exploration episode may form functional assemblies that are reactivated during SWRs, in a similar manner to reactivation of place cell assemblies representing experienced trajectories1,2,4,7,20,21. To test this idea, we used a previously developed approach to identify assemblies of co-active neurons during social exploration20,23 (Fig.3d, Methods). When examined during the learning trials, CA2 and CA1, but not CA3, cell assemblies were more activated during periods of social interaction compared to other times during the trials (Fig.3e, Extended Data Fig.9a–c). Of particular interest, some assemblies, termed “social discriminant assemblies”, were activated significantly more during interactions with one stimulus mouse compared to the other (Fig.3f, Extended Data Fig.9d–f). Moreover, discriminant assemblies were more abundant in CA2 than in CA1 or CA3 (Fig.3g).
Next, we explored whether cell assemblies identified during the social learning trials were reactivated during post-sleep SWRs and/or during social interactions during the recall trial. We found significant reactivation of assemblies in all three hippocampal regions. Of interest, the strength of reactivation of discriminant assemblies during post-sleep and recall trials was stronger than that of non-discriminant assemblies (Fig.3h; Extended Data Fig.9a–c), suggesting that assemblies encoding more precise social information were preferentially reactivated following social experience. Finally, peri-SWR assembly activation showed a higher activity of discriminant assemblies during SWRs in the sleep session after social learning than before (Extended Data Fig.9d–f). These results suggest that hippocampal cell ensembles, particularly from the CA2 region, encode a representation of conspecifics that is reactivated during sleep.
Triggered CA2 SWRs extend social memory
To determine whether reactivation of social assemblies during sleep is important for social memory consolidation, we asked whether triggering additional SWRs in CA2 in the post-sleep period after social learning could enhance social memory recall. Optogenetic stimulation with appropriately shaped light-pulses of CA1 pyramidal cells expressing ChR2 has been shown to trigger ripple oscillations8,24,25. Furthermore, optogenetic prolongation of CA1 SWRs during a spatial working memory task can improve memory performance8. To enable the detection of an enhancement in memory, we used a more demanding social memory task with a 24-h delay interval (instead of 1-h interval), where memory performance was initially at chance levels (Fig.4a).
Figure 4: Effect of optogenetic generation of ripples on social memory recall.

a) Social memory recall was normally absent 24 h after social learning (n = 7 mice; P > 0.05, sign-rank test). b) Weak ChR2 activation in CA2 neurons of Amigo2-Cre mice with low intensity blue light pulses was used to trigger ripples in CA2 during the first 2 h of post-sleep session. c) Example of spontaneous and triggered CA2 ripples and spiking from same animal. White lines show CA2 LFPs, color maps show wavelet spectrogram, blue shape indicates light stimulus. The firing of each unit is color-coded in the raster plots. d) Correlation of probability of participation (see Methods) in spontaneous versus triggered CA2 ripples for CA1 (n = 67; r= 0.56, P < 10−3), CA2 (n= 147; r = 0.66, P < 10−25) and CA3 (n = 40; r = 0.26, P > 0.05) pyramidal cells. e) Social memory after 24 h in mice receiving blue light pulses for controls (Cre- littermates; P > 0.05, sign-rank test, n = 6 mice), Amigo2-Cre mice expressing ChR2 in CA2 (P < 0.00023, n = 6 mice), and Grik4-Cre mice expressing ChR2 in CA3 (P > 0.05, n = 6 mice). f) Ripple reactivation gain (see Methods) for both spontaneous and triggered SWRs was greater for cells with positive versus negative social gain in CA1 (P < 0.05, n=67) and CA2 (P < 0.003, n=147) but not CA3 (P > 0.05, n=40).
To examine the effect of induced SWRs, we expressed ChR2 in CA2 pyramidal cells and applied weak (1–1.5 mW), 60–70-ms trapezoidal light pulses, which triggered ripples with features similar to spontaneous events (Fig.4c8,25), resulting in a ~2-fold increase in the number of ripples in the first 2-h of the 24-h delay period relative to control mice (Extended Data Fig.10a–b). Both a neuron’s firing rate during a ripple and probability of firing in a ripple was similar for spontaneous compared to evoked ripples in CA1, CA2, and CA3 (Fig.4d, Extended Data Fig.10c–d), in agreement with prior results in CA18,24. Importantly, the increase in ripple number following social exposure significantly improved social memory 24-h after learning (Fig.4e). In comparison, there was no effect of the light pulses on social memory in the Cre- control group (Extended Data Fig.10e).
We next asked whether the strength of reactivation of a cell within spontaneous or optogenetically triggered ripples was influenced by the degree to which that cell showed socially-related firing during the social learning trials. We classified the social firing of each cell by its “social gain”: (firing rate during social interactions – firing rate outside of social interactions) / (sum of the rates). We found that cells with a positive social gain had a greater ripple reactivation gain, the extent to which firing rate during post-sleep ripples was increased relative to pre-sleep ripples (Fig.4f). Cells with positive social gain also displayed a higher probability of participation in both spontaneous and triggered SWRs (Extended Data Fig.10f). Thus, we conclude that SWRs are privileged windows for learning related changes in excitability due to intrinsic or synaptic plasticity26 properties, as previously suggested27.
Finally, we examined whether the optogenetic enhancement of social memory was specific to SWRs triggered in CA2 SWRs or whether generation of SWRs in neighboring CA3 could produce a similar effect. We thus expressed ChR2 in CA3 pyramidal cells by injecting Cre-dependent AAV in CA3 of Grik4-Cre28 mice (Extended Data Fig.10g–h). Although photostimulation of CA3 generated SWRs (Extended Data Fig.10i–k), it failed to improve social memory recall after 24-h (Fig.4e). Of interest, CA3-triggered SWRs recruited the firing of pyramidal neurons in CA3 and CA1 but not in CA2 (Extended Data Fig.10l–n), suggesting that CA2 firing activity during SWRs is critical for social memory consolidation. This is consistent with results showing that dorsal CA2 but not dorsal CA1 or CA3 is crucial for social memory10–12,29, and that activation of CA3 produces a net feed forward inhibition in CA230.
Discussion
Our results reported above extend previous findings that SWRs replay spatial trajectories by providing evidence that SWRs also reactivate and consolidate higher-order multimodal experiences encoded in social memory. Furthermore, our findings suggest that SWRs originating from different regions may have different functional roles since CA3 SWRs appear important for spatial memory7,31 whereas consolidation of social memory requires SWRs arising in CA2.
These results also further our understanding as to how CA2 activity contributes to social memory. Thus, whereas dorsal CA2 firing has been found to respond to and encode social novelty12,29, our finding of “social-remapping” cells indicates that dorsal CA2 neurons encode representations that can distinguish the identity of one novel mouse from another. These results are consistent with reports in humans showing that individual neurons in the medial temporal lobe respond to the identity of a given individual32,33, suggesting that hippocampal function in social memory is conserved through evolution.
By comparing firing properties and behavioral role of neurons in different hippocampal regions, we provide further support that these regions are preferentially involved in distinct functions. Thus, whereas social-remapping cells were enriched in dorsal CA2, object-remapping cells were enriched in dorsal CA1 and CA3. Importantly, this preferential neural coding was reflected in memory behavior, with CA2 important for social memory and CA1 for object memory. This is consistent with previous findings that social memory requires dorsal CA210–12 but not dorsal CA134 or dorsal CA335.
As dorsal CA1 does not appear essential for social memory, what is the circuit mechanism by which dorsal CA2 output enables social memory formation? Insight into this question comes from the finding that ventral CA1, which like dorsal CA1 also receives strong excitatory input from dorsal CA211,35, is important for social memory34. Moreover, silencing the longitudinal inputs to ventral CA1 from dorsal CA2 is sufficient to impair social memory11. It will be of interest to test in the future whether SWRs originating in dorsal CA2 travel to ventral CA1 to consolidate social memory at this site, as suggested by the finding of an increased number of SWRs in ventral CA1 in the presence of conspecifics36. Finally, although the role of dorsal CA2 output to dorsal CA1 remains uncertain, this pathway is poised to contribute to the finding that some place cells in dorsal CA1 encode the allocentric position of a freely moving conspecific, and thereby serve as social place cells37,38. Thus, dorsal CA2, through both its encoding of social experience and replay of that experience, can contribute to a wide range of social behavior and social information processing in the brain.
METHODS
Surgical Procedures
Adult male mice (C57Bl6/J background, ~3-months old) were kept in the vivarium on a 12-hour light/dark cycle and housed 3–4 per cage before surgery and individually afterwards. All experiments were approved by the Institutional Animal Care and Use Committee at Columbia University. We used Cre-dependent AAV injections to obtain region-selective expression of opsins in hippocampal CA2 (Amigo2-Cre animals10), CA3 (Grik4-Cre animals28) or CA1 (Lypd1-Cre animals15) regions for optogenetic manipulations.
Animals were first anesthetized with isoflurane, a craniotomy performed under stereotaxic guidance over the target region, and bilaterally injected with AAV2/5 EF1a.DIO.hChR2.eYFP or AAV2/5 EF1a.DIO.eArch3.0-eYFP (200 nL per site) using a Nanoject II (Drummond Scientific). After injections, the skin was sutured and animals treated with a broad spectrum antibiotic and given an analgesic. Animals were left in the vivarium for recovery (~2 weeks).
One week later, animals were implanted unilaterally with silicon probes (−1.94 antero-posterior, −2.2 medio-lateral from Bregma) and bilaterally with optic fibers (AP −1.94, ML +−2.2), similar to previously described procedures8,9,25,39. In a subset of behavioral experiments animals were only implanted with optic fibers. The probes (5-shanks x 12-sites -A5×12-Poly2–5mm-20s-160- or 4-shanks x 16-sites-A4×16-Poly2–5mm-20s-160-; Neuronexus) were mounted on custom-made micro-drives to allow their vertical movement after implants. A fiber optic was attached under microscopic guidance to one of the shanks of the silicon probe. Probes were inserted above the target region and the micro-drives were attached to the skull with dental cement. In the contralateral hemisphere, an optic fiber (200 μm) was implanted over the target region and cemented to the skull. For animals implanted just with fiber optics, both fibers were implanted in the final position and attached to the skull with dental cement. Craniotomies were sealed with sterile wax. A stainless-steel wire was inserted over the cerebellum to serve as ground and reference for the recordings. Finally, a copper mesh was attached to the skull to strengthen the implant and connected to the ground wire to attenuate the contamination of the recordings by environmental electrical noise. After post-surgery recovery (~1week), probes were lowered gradually in 75 to 150 μm steps per day until the desired position was reached. We used physiological landmarks and characteristic LFP patterns39–41 to identify the pyramidal layer of the different subregions of the hippocampus39–41 and optogenetic responses.
Optogenetic experiments
For real-time SWR manipulations, 100 or 200 μm core multi-mode optic fibers (Thor Labs) were collimated to a blue-light emitting (475 nm) laser diode (PL-450, Osram connected to current source stimulators (Thor Labs)8,24,25,42. For the stimulation session, these diodes were connected to the implanted fibers.
1. SWR disruption.
A closed-loop system was used to detect SWRs online and trigger light stimulation. For SWR disruption, once a ripple was detected, a short duration (10 ms) high-intensity (5–10 mW) light pulse was delivered through both fibers to activate ChR28. The intensity was manually adjusted in each animal during test sessions in the home cage by gradually increasing light power until a population spike was evoked, truncating the ongoing ripple and producing a strong inhibition of pyramidal cell firing, similar to the effect of electrical stimulation3,5,6. Pulses were delivered every time a ripple was detected while the animal was in the home-cage, between the learning and the recall trial. Two control stimulation experiments were performed. The first control group consisted of Cre+ animals expressing ChR2 as above and received the same light stimulation upon SWR detection, but after a random delay (500–1000 ms). The second control group consisted of Cre- animals injected with the same Cre-dependent ChR2 AAV as above and which received the same light stimulation upon SWR detection as the experimental group. The performance of the protocol was validated with a subsample of the data to determine the rate of positive detections (hits), false positives (false alarms) and missed events (Extended Data Fig.8b).
2. SWR generation.
For SWR generation, 60 ms, low intensity (1–2 mW) light pulses were used to activate ChR28,24,25. The intensity was manually adjusted during a test session in the home cage by gradually increasing light power until a ripple was produced. To minimize the artifact at the onset of the stimulation, trapezoid-shaped pulses (~20 ms initial ramp) were used. Pulses were delivered constantly at a rate that approximated the spontaneous occurrence of SWRs (0.3 Hz). Control stimulation experiments were performed using the same virus and stimulation protocol in Cre- animals.
3. Pyramidal cell silencing during SWRs during sleep.
For the SWR silencing experiments, a yellow laser (~556 nm, Opto-Engine-LLC) delivered light to activate Arch3.042 using 3–5 mW light pulses (30 s once every 2 minutes). The same stimulation in Cre- animals was used for controls.
4. Pyramidal cell silencing during social interactions.
We expressed Arch3.0 selectively in CA1 or CA2 using Cre-dependent AAV injections in these regions in Lypd1-Cre or Amigo2-Cre mice, respectively. For real-time behavioral manipulations, we streamed online (https://github.com/wonkoderverstaendige/Spotter) the position of the animals during learning trials 1 and 2. Yellow light pulses (5 mW) were delivered continuously to activate Arch3.042 when the animals crossed into the area of interest around a given stimulus animal.
5. Pyramidal cell silencing during object interactions.
The same viruses, animal models and stimulation protocol as in 4 were used. Light pulses were delivered when the animals crossed the area of interest around a given object.
Behavioral recordings
After surgery, animals were handled daily and accommodated to the experimenter, recording room, cable and recording arena for 1 week before starting experiments. In a typical session we recorded neural activity as follows: 1 h in home cage, 5 min during exposure to the empty arena, 1 h in home cage, 5 min during exposure to the empty cup cages, 1 h in home cage (pre-sleep), 5 min during exposure to the two novel stimulus animals (S1 and S2) in learning trial 1, 5 min during exposure to the same stimulus mice in reversed positions in learning trial 2, 1 h in home cage (post-sleep, where SWRs manipulations were performed in some sessions), followed by a 5-min recall trial where one of the two stimulus mice (S1 or S2, chosen at random) was presented together with a novel stimulus animal (N). Analogous procedures were followed for the object recognition experiments with different objects being a piece of cork, wood, plastic, glass and rubber (all about 10 cm tall and 5×5 cm wide). For the 24 h recall experiment, the recall test was conducted on the next day. Adult (~3-months old) C57Bl6/J non-littermate males were used as stimulus animals.
The position of the animal was tracked online using two LED’s (blue, red) and an overhead camera (Basler, 60 Hz). Offline tracking of the animal was validated using pose estimation user-defined features with a deep learning algorithm (https://github.com/AlexEMG/DeepLabCut)43. In each trial we measured the total time the subject mouse spent exploring the two stimulus mice (tS1, tS2) in the two learning trials and the differential time spent in social exploration of the stimulus mouse (e.g. tS1) compared to the novel mouse (tN) in the recall trial (or novel object in the case of the object experiments). The differential interaction was quantified by a “Discrimination Index” (DI). In the case in which S1 was presented in the recall trial DI= (tN – tS1)/(tN + tS1), with an analogous expression when S2 was presented. Social exploration was defined as time spent inside the interaction zone (considered as an area within 5 cm of the perimeter of the cup).
Electrophysiological recordings were conducted using an Intan RHD2000 interface board (http://intantech.com/RHD2000_evaluation_system.html) at 20 KHz sampling.
Real time SWR detection
Two LFP channels were used for real-time SWRs detection8,25. The ripple was detected in one channel connected to an electrode in the CA2 region, previously identified by optogenetic tagging of a cell’s response. The LFP was filtered between 100–300 Hz. A second channel was used for noise detection, selected from the neocortex where no ripple activity was present and filtered in the same frequency band. The root-mean square (RMS) of the two signals was computed by a custom-made analog circuit. Signals were fed into a data acquisition interface for real-time processing of LFP channels by a programmable processor (Cambridge Electronic Device – CED) at a 20-kHz sampling rate. Amplitude thresholds for ripple versus noise were manually adjusted for each animal before the start of each recording session based on physiological features. SWRs were defined as events crossing the ripple detection but not the noise signal detection8,25.
Tissue Processing and Immunohistochemistry
Mice were transcardially perfused with saline followed by 4% PFA in PBS. The brains were quickly extracted and incubated in 4% PFA overnight. After 1 h washing in 0.3% glycine in PBS, 60-μm sections were prepared using a Leica VT1000S vibratome. Sections were permeabilized and blocked for 2 h at room temperature in PBS containing 5% goat-serum and 0.5% Triton-X. Sections were incubated overnight at 4 °C with chicken anti-GFP (1:1000, AVES Labs, Cat# GFP-1020, RRID: AB_10000240) and rabbit anti-PCP4 (1:200, Sigma-Aldrich, Cat# HPA005792, RRID: AB_1855086) primary antibodies, diluted in PBS containing 5% goat-serum and 0.1% Triton-X in PBS. The sections were washed three times for 15 min in PBS at room temperature and secondary antibodies were applied overnight at 4°C in PBS containing 5% goat-serum and 0.1% Triton-X. All secondary antibodies were raised in goat and purchased from ThermoFisher Scientific. The secondary incubation was performed with anti-chicken ab conjugated to Alexa 488 (Cat# A11039, RRID: AB_142924) and anti-rabbit ab conjugated to Alexa 647 (Cat# A21244, RRID: AB_2535812). Slices were stained with Hoechst 33258 (ThermoFisher Scientific, Cat# H21491) applied at 1:1000 for 10 min in PBS at room temperature before mounting the section using fluoromount (Sigma-Aldricht). An inverted confocal microscope (Zeiss, LSM 700) was used for fluorescent imaging and quantification of virus expression. Animals were discarded if less than 80% of cells in a given subregion expressed a given viral construct. According to this criterion 5 Lypd1-Cre animals did not fully express virus in CA1 and were discarded. All other animals met the criterion. An epifluorescence microscope (Olympus Bx61VS) was used to verify the tracks of electrodes and optical fibers.
Quantification and statistical analysis
Spike Sorting and Unit Classification.
Neuronal spikes were detected from the digitally high-pass filtered LFP (0.5–5kHz) by a threshold crossing-based algorithm (Spikedetekt2). Detected spikes were semi-automatically sorted using ‘Kilosort’ (https://github.com/cortex-lab/KiloSort), followed by manual curation using ‘Phy’ (https://github.com/kwikteam/phy)44. Autocorrelograms and waveforms characteristic of monosynaptic excitatory and inhibitory interactions were used to select and characterize well-isolated units and separate them into pyramidal cell and interneuron classes9,45. Only well isolated single units were included.
Offline Detection of SWRs.
To detect ripples, the wide-band signal was band-pass filtered (difference-of-Gaussians; zero-lag linear phase FIR), and instantaneous power was computed by clipping at 4 SDs, rectified and low-pass filtered. The low-pass filter cut-off was at a frequency corresponding to n number of cycles of the mean band-pass (for 100–300 Hz band-pass, the low-pass was 55 Hz). The mean and SD of the baseline of LFP were computed based on the power during non-REM sleep. Subsequently, the power of the non-clipped signal was computed, and all events exceeding 4 SDs from the mean were detected. Events were then expanded until the (non-clipped) power fell below 1 SD; short events (<15 ms were discarded)8,9,24,25.
Ripple spike content analysis.
Well-isolated putative units with at least 100 spikes in a given session were included in the analysis. For all individual units, spikes in a [−300, +300] ms peri-ripple or stimulus onset window were collected and firing rate histograms (1-ms time bin) were constructed. All histograms for the same subregions and same type of units (pyramidal cells) were pooled. The firing rate histograms were z–scored and smoothed using a Gaussian kernel (SD = 5 ms). Only spikes within the interval of the detected ripples were considered for the ripple content analysis. In-ripple firing rate was calculated as number of spikes divided by ripple duration and averaged for all events. The probability of participation of individual units in ripples was defined as the number of events in which a neuron fired at least one spike during the ripple divided by the total number of ripples. Within-ripple gain was calculated as in-ripple firing rate divided by the baseline firing rate (average firing rate in the whole session) of the cell8,24,25.
Reactivation Analysis.
Explained variance (EV) and reverse explained variance (REV) were calculated in each session using the cell pairs of interest. EV and REV were calculated for pyramidal cells only using a previously described approach21,22. EV is defined as:
where rsocial episode,POST and rsocial episode,PRE are the Pearson’s correlation coefficients of pairwise correlation matrices between the social learning episodes and SWRs times of the post-sleep and pre-sleep periods, respectively, and rPOST,PRE is the Pearson’s correlation coefficient of the pairwise correlation matrices between the post-sleep and pre-sleep periods. For measurement of EV and REV during REM sleep, non-REM sleep and SWRs, all epochs/events were detected individually and pooled together in both pre- and post-sleep periods. Pairwise neuronal correlations for EV and REV were calculated using the Pearson correlation coefficient on 100 ms binned spike trains. The coefficients were calculated for pre-sleep, task, and post-sleep periods separately and correlation matrices were then computed. The correlations between all pairwise combinations were calculated and used to assess the percentage of variance in the post sleep period that could be explained by correlation values established during the task trials, while controlling for pre-existing correlations in the pre-sleep session. The control value (REV) was obtained by switching the temporal order of the pre- and post-sleep sessions. For assessing the relative contribution to the explained variance of a single pair of neurons, the EV was calculated for all the pairs without including the pair of interest. Subtracting this value from the total EV value, a relative contribution for the corresponding pair of neurons was calculated. To calculate the average contribution of each neuron to the EV, the relative contribution for all pairs in which a particular neuron participated was averaged22.
For detecting cell assembly patterns, we used an unsupervised statistical framework based on a hybrid principal component analysis (PCA) followed by independent component analysis (ICA) as reported20,23. In brief, spike trains of each neuron were binned in 20-ms intervals for the whole session and z-scored firing rates were calculated for each bin. Spike trains were convolved with a Gaussian kernel (SD = 10 ms) and the matrix of firing correlation coefficients for all pairs of neurons constructed. Next, we calculated the number of assemblies based on those principal components whose eigenvalues exceeded the threshold for random firing correlations (Marčenko-Pastur distribution). Independent component analysis was then used to determine for each assembly (component) the vector of weights with which each neuron’s firing contributes to that assembly. To measure the strength of each assembly’s activation as a function of time in a given episode, we multiplied the convolved z-scored firing rate of a given neuron at a given time by the weight of that neuron’s contribution to a given assembly. We then summed the product of these weighted spike counts for all non-identical pairs of neurons to provide the assembly activation strength at the given time point. Assembly activity was only considered when its expression strength exceeded a threshold of 523. Reactivation strength of an assembly was defined as the difference in its average expression strength during post-sleep minus that during pre-sleep. Larger reactivation numbers indicate a greater social-learning-dependent increase in assembly activation. Assembly activation was assessed inside and outside the two social interaction areas surrounding the stimulus mice. Social discriminant assemblies were defined as assemblies that were activated significantly more strongly during the interaction with one of the two stimulus mice compared to the other one in the two learning trials (P < 0.05, Student’s t-test).
Place cells and analysis.
Spiking data was binned into 1-cm wide segments of the camera field projected onto the maze floor, generating raw maps of spike counts and occupancy probability. A Gaussian kernel (SD = 5 cm) was applied to both raw maps of spike and occupancy, and a smoothed rate map was constructed by dividing the spike map by the occupancy map. A place field was defined as a continuous region of at least 15 cm2, where the mean firing rate was above 10% of the peak rate in the maze, the peak firing rate was > 2 Hz and the spatial coherence was > 0.7. Spatial correlation between trials was calculated as the average pixel-by-pixel correlation of the smoothed firing rate maps. The rotated spatial correlation was calculated in the same way but rotating by 180° the rate map in trial 2, so the position of mice S1 and S2 matched that of trial 1; a similar procedure was used in the object experiments. The distance of each place field to the cups (or objects) was calculated from the center of mass of the field to the center of the closest cup. Information index per spike (bits/spike) represents the mean firing rate of the cell at location X, multiplied by the probability of the animal of being at location X and the binary logarithm of the mean firing rate of the cell at location X divided by the overall firing rate of the cell47,48. The selectivity index represents the maximum firing rate of the rate map (spikes divided by time spent in each bin of 5 cm) divided by the mean firing rate46,47.
For the classification of social-invariant and social-remapping cells (and, similarly, object-remapping cells), k-means clustering was performed with all normal and rotated correlation values for all pyramidal cells active during the trials of the task. The ‘cityblock’ metric was used as distance measure. We found the optimal number of clusters in the data to be five by employing the silhouette criterion. To be able to classify cells as social-remapping versus social-invariant, we focused on those cells with high rotated versus unrotated correlation values and viceversa (as described above). Most of the cells in these two groups had single place fields away from the center (about 48% of all place cells), whereas of the remaining groups (neither “social-invariant” not “social-remapping”), about 13% of cells had place fields in the center of the arena.
Immobility and speed modulation analysis.
Locomotion periods with a speed < 4 cm/s were considered immobility periods. Immobility periods where SWRs occurred were excluded9,13. For the analysis included in this study, only immobility periods during the behavioral task (not home cage) were considered. For the speed modulation analysis, spike count vectors divided by the time spent in each speed bin (1 cm/s) were calculated and smoothed with a Gaussian kernel of 6 SD9,13,14,48.
Head direction analysis.
The head direction of the animal was estimated with head markers used for pose estimation44. The head direction fields were calculated as the histograms of spike count divided by the time spent in each direction in bins of 2 degrees, smoothed with a Gaussian kernel of 6 SD. The Rayleigh test was used to test the null hypothesis of head direction firing being uniformly distributed in all directions14,48,49. The proportion of modulated cells was quantified as those cells modulated with a P < 0.05.
Theta modulation analysis.
For detecting periods of theta activity, LFPs from the pyramidal layer were band-pass filtered (4–12 Hz)9,39,50. Peaks were identified as the positive to negative zero crossings of the time derivative of the filtered LFP. Phase was linearly interpolated between peaks9,39. Theta modulation strength was calculated as the mean resultant angle of the phases (mean vector length), and the null hypothesis of phases being equally distributed was assessed with the Rayleigh test49. The proportion of modulated cells was quantified as those cells modulated with P < 0.05.
Statistical Analysis.
All statistical analyses were performed with MATLAB functions or custom-made scripts following previously described methods1–9,20–25. The unit of analysis was typically single cells, assemblies or SWRs events. In some cases, the unit of analysis was sessions or animals, and this is stated in the text. Unless otherwise noted, for all tests, non-parametric two-tailed Wilcoxon rank-sum (equivalent to Mann-Whitney U-test) or Wilcoxson signed-rank were used. For multiple comparisons Tukey’s honesty post-hoc test was employed after ANOVA. On box plots, the central mark indicates the median, bottom and top edges of the box indicate 25th and 75th percentiles respectively, and whiskers extend to the most extreme data points without considering outliers, which were also included in statistical analyses. Due to experimental design constraints, the experimenter was not blind to the manipulation performed during the experiments (i.e., optogenetic manipulations). No statistical tests were used to predetermine sample sizes of number of animals, but our sample sizes are similar or larger to those in previous studies. The mice for each group were chosen randomly.
DATA AND SOFTWARE AVAILABILITY
Datasets and analytical tools included in this study will be made available upon request.
Extended Data
Extended Data Figure 1: Behavioral features during social memory task.

a) Representative animal trajectories during the task show higher time spent around the novel animal (red) in the test (recall) trial. b) Example video frame showing pose estimation calculated with DeepLabCut (color markers). Interaction zones were defined as 10 cm by 10 cm squares in the two corners where the cups were located. c) Average speed of the animals was not different among trials (one-way ANOVA: F(2) = 0.92, P > 0.05). d) Average speed inside interaction zones around S1 (left plot), S2 or novel mouse (middle plot) did not differ among trials (one-way ANOVA: F(2) = 3.14, P > 0.05). Average speed did not differ outside interaction zones (one-way ANOVA: F(2) = 1.58, P > 0.05). e) Total time spent inside the interaction zone around S1, S2 or novel mouse (left plot). Total time interacting with novel mouse during recall trial was greater than with either familiar mouse in any other trial (P < 0.01 for novel versus S1 interaction during third trial and P < 0.05 for novel versus S1 interaction during all of the other trials, two-way ANOVA mouse × trial followed by Tukey post hoc test for multiple comparisons). Total time spent outside interaction zones (right plot) was not different between trials (one-way ANOVA: F(2) = 0.58, P > 0.05).
Extended Data Figure 2: Multi-region electrophysiological recordings.

a) Representative histology showing electrode tracks spanning CA1, CA2 and CA3 areas, with optic fiber over CA2 pyramidal layer. Blue: DAPI staining. b) ChR2-GFP expression in CA2. Blue: DAPI; green: GFP; red: PCP4. c) Silicon probe with 100 μm optic fiber glued to one electrode shank mounted in a movable microdrive to allow for precise localization of the target area. d) Representative sample recordings of local field potentials (one trace per electrode) and single units (colored lines show spikes) in several regions of the hippocampus. Each column represents one electrode shank. Approximate location of pyramidal and granular layers is depicted in superimposed outline of hippocampus. e) Average firing responses of single cells from different regions aligned to SWRs detected in CA1. Note that CA2 cells fired before CA1 and CA3 and that a subpopulation of CA2 units (‘CA2 ramping’) became silent upon SWR onset. f) Same as in E but firing responses were aligned to ripples detected in CA2. Note that CA2 cells are strongly activated during CA2 ripples. These results replicate a previous report in rats21.
Extended Data Figure 3. Classification of single cell responses during social memory task.

a) Examples of simultaneously recorded place cells from CA1 and CA2 regions in one mouse. Each row shows firing map of one cell; firing maps for trial 1, trial 2 and the memory test session are displayed in each column. Colored circles represent different stimulus mice. b) Another example of simultaneously recorded place cells from CA2 and CA3 regions in a second mouse.
Extended Data Figure 4. Classification of single cell responses during social memory task.

a) Unrotated correlation was computed as averaged pixel-wise correlation of the firing maps from trial 1 and 2 (top). Rotated correlation was calculated after rotating the map for trial 2 180 degrees (bottom). b) K-means clustering of unrotated and rotated spatial correlation values for all cells resulted in 5 clusters (different colors). One cluster (blue) had high unrotated and negative rotated correlations, termed “social-invariant” cells. Another cluster (red) had high rotated and negative unrotated correlation, termed “social-remapping” cells. The other clusters had more similar values for the two correlations. Squares denote CA1, circles CA2, and triangles CA3 pyramidal cells. c) Proportion of CA1, CA2 and CA3 cells from each of the 5 clusters color-coded as in b. d) Distribution of unrotated (empty) and rotated (filled) correlation values between trial 1 and trial 2 for cells in all 5 clusters. *** P < 0.001, rank-sum test. e) Distribution of unrotated (empty) and rotated (filled) correlation values between learning trial and recall for cells in all 5 clusters. *** P < 0.001, rank-sum test. Correlation performed between the recall trial and that learning trial in which the position of the familiar mouse was in the opposite location. f) Distance from the center of mass of the place field to the nearest cup for cells in all clusters (F(4,677) = 27.34, P < 4.6e-21, one-way ANOVA). Social-remapping cells had place fields closer to the cups (P < 0.002, Tuckey post-hoc test). g) Place field sizes for cells in all clusters were similar (F(4,677) = 0.39, P > 0.05, one-way ANOVA). h) Number of place fields per cell was similar for all clusters (F(4,677) = 0.68, P > 0.05, one-way ANOVA). i) fraction of social-remapping cells with place fields next to stimulus mouse 1 (S1), stimulus mouse 2 (S2) and other locations.
Extended Data Figure 5. Place cell properties of social-invariant and social-remapping cells across regions during the social discrimination task.

a-e) Place cell properties for CA1, CA2 and CA3 social-invariant and social-remapping cells. a) Peak firing rate; b) place field size; c) spatial information in bits per spike; d) spatial selectivity index; e) number of place field per cell; f) Whole-session average firing rate for social-remapping and social-invariant cells from the different subregions. g) Fraction of cells with n=1 place fields, n=2 place fields and n>2 place fields in the different regions. h) Theta firing phase distribution (firing probability per bin of phases) for social-remapping, social-invariant and other cells from different regions. Rayleigh test was used against the null hypothesis (Methods). i) Mean vector length of celĺs firing during theta oscillations for CA1, CA2 and CA3 pyramidal cells. j) Average firing rate for CA1, CA2 and CA3 cells during immobility and running (velocity > 5 cm/s) periods during the task. */** P < 0.05/0.01, rank-sum test. k) Representative examples of CA1, CA2 and CA3 cell firing rate (distance from origin) as function of head direction. l) Distribution of P values shows similar lack of head direction tuning for social-remapping, social-invariant and other cells in CA1, CA2 and CA3 regions. Dashed line: P = 0.05. m) Proportion of social, social-invariant and social-remapping cells significantly modulated by head direction (P < 0.05) per region.
Extended Data Figure 6. Object recognition task: single cell responses, optogenetic manipulations and reactivation properties per region.

a) Schema of the task. The same behavioral paradigm used to assess social memory was used to assess object recognition memory. Two novel objects were presented for 5 minutes in the first trial; the position of the objects was then swapped in a second trial of another 5 minutes. After a home cage period of 1 hour, the memory recall test trial was performed with one of the previous objects and one novel object. b) Discrimination index performance of animals in the test trial of the object recognition task for WT mice (DI was significantly greater than 0; P < 0.001, t-test; n=10 sessions in 4 animals), mice with CA2 silenced in trials 1 and 2 during time of interaction with object presented in recall trial (DI significantly greater than 0; P < 0.05, t-test; n=10 sessions in n=10 animals), and mice with CA1 silenced in trials 1 and 2 during interaction with object presented in recall trial (DI not significantly different from 0; P > 0.05, t-test; n=10 sessions in n=10 animals). c) Examples of firing maps for two CA2 cells in the object memory task. The first cell had a stable place field in the two learning and test trials, while the second one remapped to follow the position of one object. d) K-means clustering of unrotated and rotated spatial correlation values for all cells. The red cluster corresponds to a subset of cells (“object-remapping cells”) with high rotated and negative unrotated correlation, analogous to social-remapping cells. Squares denote CA1, circles CA2 and triangles CA3 pyramidal cells. e) Distribution of unrotated (empty) and rotated (filled) correlation values for the two clusters of cells in d). *** P < 0.001, rank-sum test. f) Proportion of CA1, CA2 and CA3 cells from each of the 2 clusters in d). g) Proportion of object-remapping and social-remapping cells in CA1, CA2 and CA3. ** P < 0.01, Fisher’s exact test.
Extended Data Figure 7: Effect of optogenetic disruption of SWRs on firing rates and field potentials. Reactivation of hippocampal cells during SWRs.

a) Schematic of closed-loop SWR truncation system: two signals (for real positive events and noise) are extracted from the recording board and filtered in the ripple band (100–300 Hz); a waveform rectifier and a low pass filter are applied (CED 1401); upon a positive event detection (real positive event = 1 and noise = 0), two current sources are triggered and light is delivered bilaterally through the optic fibers connected to the animal. b) Estimation of detection performance. Left graph, a subsample of events detected by our on-line system in 3 sessions (n = 1000) were validated by ground truth (offline detected events); plot shows percentage of true positives versus false positives. Right graph, a subsample of true events (detected offline) in 3 sessions (n = 1000) were cross-validated with our online detector to quantify percent events detected (SWRs disrupted) and missed. c) CA1, CA2 and CA3 LFP patterns during CA2 SWR disruption. d) CA1, CA2 and CA3 average firing responses to normal and truncated SWRs show strong suppression of firing after light stimulation (blue bar) (n = 53, 148, 87 CA1, CA2, CA3 cells; p < 10−6, = 9.7×10⁻⁷, = 1.14×10⁻⁸, respectively sign-rank test). e) Firing of CA2 pyramidal cells was suppressed by brief yellow-light pulses (yellow rectangle) in Amigo2-Cre animals expressing AAV2/5 EF1a.DIO.eArch3.0-eYFP in CA2. Curves show mean and SEM (n = 58, p < 0.03, sign-rank test). f) Example session in which 30-s pulses of yellow light (yellow bars) were delivered once every two minutes to CA2 of Amigo2-Cre mice expressing Arch3.0. Blue trace is ripple-band (100–300 Hz) power in CA1 pyramidal layer and magenta traces shows detected SWRs. Note suppression of CA1 SWRs during illumination. g) Example session showing decreased CA2 SWR rate due to photoactivation of Arch3.0 (p < 0.0246, Wilcoxon rank sum test). Dashed line shows light stimulation and black and blue traces show SWR rate before and during period of photostimulation, respectively. h) Social memory recall was suppressed following CA2 silencing by yellow light pulses (30s, once every 2 min) during the post-sleep period in Amigo2-Cre mice injected with AAV-DIO-Arch3.0 (n=9; discrimination index not significantly different from 0; P > 0.05, t-test), whereas social memory was present in Cre- littermate controls injected with the same virus and receiving same light pulses (n=8; discrimination index differed significantly from 0; P < 0.01).
Extended Data Figure 8: Reactivation of hippocampal cells during SWRs following social learning.

a) Example cell pair firing rate correlation matrices for pre-sleep, learning trials and post-sleep sessions. Bar, Color-coded r values. Note increase in post-sleep coactivation in some cell pairs that were coactive during the task (red arrow). b) (EV – REV) measure of post-sleep reactivation of correlated firing during learning trials in control sessions (no manipulation), sessions with optogenetic SWR disruption, and sessions with random optogenetic stimulation. Significant reactivation was observed in CA1 and CA2 control sessions (P = 0.03 and 0.0028, respectively, Wilcoxon rank sum test) or following random stimulation (P = 0.008 and 0.04 for CA1 and CA2, respectively, Wilcoxon rank sum test). There was no significant reactivation in CA1 or CA2 with SWR disruption. CA3 failed to show significant reactivation in any session (P > 0.05). c) Significant reactivation (EV– REV) was observed in CA1 and CA2 during entire slow-wave sleep period but not during REM sleep period (d). e) Explained variance and reversed explained variance for a subsample of approximately the same number of cells for different regions (CA1, n = 73; CA2, n =69; CA3, n = 67). f) Cells from CA1 and CA2 that contributed the most to the total explained variance (1st quartile) had a significantly higher rotated spatial correlation (e.g. social-remapping) than the rest of the cells (P = 0.0354 and P = 0.0223 for CA1 and CA2 respectively; p>0.05 for CA3, Wilcoxon signed rank test). g) Average peri-SWR firing rate responses for social-remapping and social-invariant cells from each region in pre- and post-sleep. Note that social-remapping cells show higher SWR firing rates in post-sleep but not pre-sleep sessions (CA1: n = 151, P = 0.0055; CA2: n = 306, P = 0.016; CA3: n = 79, P > 0.05).
Extended Data Figure 9: Assembly activity strength during the social memory discrimination task.

a) Distribution of assembly social gain values from different regions. Assembly social gain defined as mean assembly strength during exploration within interaction zone divided by mean assembly strength during exploration outside interaction zone. Social gain was significantly greater than 1 for CA1 (P < 10−6, sign-rank test) and CA2 (P < 10−19) but not CA3 (P > 0.05). b) Left pair of bars: socially-related assembly strength = ([assembly strength inside social interaction zone minus strength outside social interaction zone]/[sum of strengths]) for social discriminant and non-discriminant assemblies (P < 10−3, rank-sum test). Right pair of bars: normalized social discrimination assembly strength (difference between assembly strength during interaction with preferred mouse minus the strength during the interaction with the other mouse divided by the sum of these two strengths) was greater for discriminant compared to non-discriminant assemblies (P < 10−8). c) Discriminant assemblies were reactivated during recall trial significantly more strongly than non-discriminant ones (P = 0.0421). Average peri-SWR activation of discriminant and non-discriminant assemblies in different hippocampal regions are shown in d) CA1: n = 116, P = 0.0252, e) CA2: n = 213, P =0.0144 and f) CA3: n = 59, P > 0.05.
Extended Data Figure 10: Generation of CA2 ripple oscillations enhances social memory recall.

a) LFPs showing ripple activity in CA1 (red), CA2 (green) and CA3 (blue) in response to optogenetic triggering of ripple in CA2. b) Rate of ripples in sessions with optogenetic triggering of SWRs was significantly higher than in control sessions (P < 0.05, rank-sum test). c) Firing rates of all pyramidal cells during spontaneous versus optogenetically triggered CA2 ripples were highly correlated: CA1 (n = 67; r= 0.63, P < 10−13, Pearson’s correlation), CA2 (n = 147; r = 0.75, P < 3×10⁻²²) and CA3 (n = 40; r = 0.48, P = 0.01). d) Firing rate gain (increase firing rate during ripples divided by average firing rate) of pyramidal cells during spontaneous versus triggered ripples for CA1 (n = 67; r= 0.57, P < 10−6), CA2 (n = 147; r = 0.74, P < 3×10⁻³⁵) and CA3 (n = 40; r = 0.25, P > 0.05) e) Social discrimination index for Amigo2-Cre- littermate controls injected with Cre-dependent ChR2 AAV with (n = 6, P > 0.05) and without light stimulation did not differ (P > 0.05, n = 10). f) Effect of social gain on a neuron’s ripple participation gain (post-sleep participation minus pre-sleep participation divided by their sum). CA1 and CA2 cells showed greater ripple participation gain for cells with positive versus negative social gain for both spontaneous SWRs (CA1 and CA2: n = 67 and n = 147; P < 0.05 and P < 3.4×10⁻³, respectively) and triggered SWRs (CA1 and CA2: P < 0.05 and P < 2.8×10⁻³, respectively). CA3 ripple participation gain showed no effect of social gain for either type of SWR (n = 40; P > 0.05). g) Histology of CA3-implanted Grik-4 animals, previously injected with Cre-dependent AAV expressing ChR2-eYFP (green). h) Close-up view of the CA3 area. i) Example of spontaneous and optogenetically triggered ripples in CA3. White lines are LFP from CA2, color maps show wavelet spectrogram, dashed lines indicate period of illumination. j) LFPs showing ripple activity in CA1 (red) and CA3 (blue) but not CA2 (green) after optogenetic triggering of ripples in CA3. k) Rate of events in sessions with CA3 triggered ripples was significantly higher than in non-stimulated sessions (P < 0.003), with no significant difference compared to rate of ripples in response to CA2 triggered ripples (P > 0.05). l) Participation probability (fraction of ripples in which a neuron fires at least one spike) of all pyramidal cells during spontaneous versus triggered CA2 ripples were highly correlated: CA1 (n = 96; r = 0.66, P < 7×10⁻¹⁰, Pearson’s correlation), CA2 (n = 67; r = 0.34, P < 3×10⁻²²) and CA3 (n = 112; r = 0.67, P = 3×10⁻¹⁵). m) A similar result was obtained comparing firing rates (r= 0.59, 0.49, 0.66; P < 2×10⁻⁷; 1.7 × 10⁻⁵; 8×10⁻¹⁰; for CA1, CA2 and CA3, respectively) or firing rate gain. n) (r = 0.63, 0.47, 0.71; P < 1.6×10⁻¹², 2.1×10⁻³, 1.7×10⁻¹⁸).
Supplementary Material
ACKNOWLEDGMENTS:
We thank Gyorgy Buzsaki for comments and resource sharing, members of the Siegelbaum lab for comments and discussions of the manuscript and Torcato Meira for help with designing the behavioral paradigm. Funding: This work was supported by NVIDIA Corporation, an EMBO Postdoctoral Fellowship ALTF 120-2017 and a K99 grant from NIH (K99MH122582) (A.O.); Sir Henry Wellcome Postdoctoral Fellowship and K99 grant (K99MH120343) (A.F.-R.); NARSAD young investigator award from the Brain and Behavior Foundation founded by the Osterhaus family (F.L.); grants MH-104602 and MH-106629 from NIMH and a grant from the Zegar Family Foundation (S.A.S.).
Footnotes
COMPETING INTERESTS DECLARATION: The authors declare that they have no competing interests. Data and materials availability: all data needed to evaluate the conclusions in the paper are present in the paper and/or the supplementary materials. Data and analytical tools used in the paper will be made available upon request.
References:
- 1.Wilson MA & McNaughton BL Reactivation of hippocampal ensemble memories during sleep. Science 265:676–679 (1994). [DOI] [PubMed] [Google Scholar]
- 2.Karlsson MP & Frank LM Awake replay of remote experience in the hippocampus. Nat. Neurosci 12, 913–8 (2009). [DOI] [PMC free article] [PubMed] [Google Scholar]
- 3.Girardeau G, Benchenane K, Wiener SI, Buzsaki G & Zugaro MB Selective suppression of hippocampal ripples impairs spatial memory. Nat. Neurosci 12:1222–1223 (2009). [DOI] [PubMed] [Google Scholar]
- 4.Dupret D, O’Neill J, Pleydell-Bouverie B & Csicsvari J The reorganization and reactivation of hippocampal maps predict spatial memory performance. Nat. Neurosci 13, 995–1002 (2010). [DOI] [PMC free article] [PubMed] [Google Scholar]
- 5.Ego-Stengel V & Wilson MA. Disruption of ripple-associated hippocampal activity during rest impairs spatial learning in the rat. Hippocampus 20(1),1–10 (2010). [DOI] [PMC free article] [PubMed] [Google Scholar]
- 6.Jadhav SP, Kemere C, German PW & Frank LM Awake hippocampal sharp-wave ripples support spatial memory. Science 336(6087), 1454–1458 (2012). [DOI] [PMC free article] [PubMed] [Google Scholar]
- 7.Buzsáki G Hippocampal sharp wave-ripple: A cognitive biomarker for episodic memory and planning. Hippocampus 25, 1073–1188 (2015). [DOI] [PMC free article] [PubMed] [Google Scholar]
- 8.Fernández-Ruiz A, Oliva A, Fermino de Oliveira E, Rocha-Almeida F, Tingley D & Buzsáki G. Long duration spontaneous and optogenetically prolonged hippocampal sharp-wave ripples improve memory. Science 364(6445),1082–1086 (2019). [DOI] [PMC free article] [PubMed] [Google Scholar]
- 9.Oliva A, Fernández-Ruiz A, Buzsáki G, Berényi A. Role of hippocampal CA2 region in triggering Sharp-Wave Ripples. Neuron 91(6),1342–1355 (2016). [DOI] [PMC free article] [PubMed] [Google Scholar]
- 10.Hitti FL & Siegelbaum SA The hippocampal CA2 region is essential for social memory. Nature 508(7494),88–92 (2014). [DOI] [PMC free article] [PubMed] [Google Scholar]
- 11.Meira T, Leroy F, Buss EW, Oliva A, Park J & Siegelbaum SA. A hippocampal circuit linking dorsal CA2 to ventral CA1 critical for social memory dynamics. Nat Comm 9:4163 (2018). [DOI] [PMC free article] [PubMed] [Google Scholar]
- 12.Alexander GM, Farris S, Pirone JR, Zheng C, Colgin LL & Dudek SM. Social and novel contexts modify hippocampal CA2 representations of space. Nat Comm 7:10300 (2016). [DOI] [PMC free article] [PubMed] [Google Scholar]
- 13.Kay K, Sosa M, Chung JE, Karlsson MP, Larkin MC & Frank LM. A hippocampal network for spatial coding during immobility and sleep. Nature 531, 185–190 (2016). [DOI] [PMC free article] [PubMed] [Google Scholar]
- 14.Rubin A, Yartsev MM & Ulanovsky N. Encoding of head direction by hippocampal place cells in bats. J Neurosci 34(3):1067–80. [DOI] [PMC free article] [PubMed] [Google Scholar]
- 15.Gerfen CR, Paletzki R & Heintz N. GENSAT BAC Cre-recombinase driver lines to study the functional organization of cerebral cortical and basal ganglia circuits. Neuron 80(6):1368–1383 (2013). [DOI] [PMC free article] [PubMed] [Google Scholar]
- 16.Knierim JJ, Lee I & Hargreaves EL. Hippocampal Place Cells: Parallel Input Streams, Subregional Processing, and Implications for Episodic Memory. Hippocampus 16:755–764 (2006). [DOI] [PubMed] [Google Scholar]
- 17.Eschenko O, Ramadan w, Mölle M, Born J & Sara SJ. Sustained increase in hippocampal sharp-wave ripple activity during slow-wave sleep after learning. Learn Mem 15(4),222–8 (2008). [DOI] [PMC free article] [PubMed] [Google Scholar]
- 18.Alexander GM, Brown LY, Farris S, Lustberg D, Pantazis C, Gloss B, Plummer NW, Jensen P & Dudek SM. CA2 neuronal activity controls hippocampal low gamma and ripple oscillations. eLife 7:e38052 (2018). [DOI] [PMC free article] [PubMed] [Google Scholar]
- 19.Boehringer R, Polygalov D, Huang AJY, Middleton SJ, Robert V, Wintzer ME, Piskorowski RA, Chevaleyre V & McHugh TJ. Chronic loss of CA2 transmission leads to hippocampal hyperexcitability. Neuron 94, 642–655 (2017). [DOI] [PubMed] [Google Scholar]
- 20.van de Ven GM, Trouche S, McNamara CG, Allen K & Dupret D. Hippocampal offline reactivation consolidates recently formed cell assemblies patterns during sharp-wave ripples. Neuron 92(5),968–974 (2016). [DOI] [PMC free article] [PubMed] [Google Scholar]
- 21.Kudrimoti HS, Barnes CA & McNaughton BL. Reactivation of Hippocampal Cell Assemblies: Effects of Behavioral State, Experience, and EEG Dynamics. J Neurosc 19(10):4090–101 (1999). [DOI] [PMC free article] [PubMed] [Google Scholar]
- 22.Girardeau G, Inema I & Buzsaki G. Reactivations of emotional memory in the hippocampus-amygdala system during sleep. Nat. Neurosci 20, 1634–1642 (2017). [DOI] [PubMed] [Google Scholar]
- 23.Lopes-dos-Santos V, Ribeiro S & Tort ABL. Detecting cell assemblies in large neuronal populations. J Neurosc Methods 220(2), 149–166 (2013). [DOI] [PubMed] [Google Scholar]
- 24.Stark E, Roux L, Eichler R & Buzsaki G. Local generation of multineuronal spike sequences in the hippocampal CA1 region. Proc Natl Acad Sci 112(33), 10521–6 (2015). [DOI] [PMC free article] [PubMed] [Google Scholar]
- 25.Oliva A, Fernández-Ruiz A, Fermino de Oliveira E & Buzsáki G. Origin of gamma frequency power during hippocampal sharp-wave ripples. Cell Rep 25(7), 1693–1700 (2018). [DOI] [PMC free article] [PubMed] [Google Scholar]
- 26.King C, Henze DA, Leinekugel X & Buzsaki G. Hebbian modification of a hippocampal population pattern in the rat. Journal of Phys 10.1111/j.1469-7793.1999.00159.x (2004). [DOI] [PMC free article] [PubMed] [Google Scholar]
- 27.Grosmark AD & Buzsaki G. Diversity in neural firing dynamics supports both rigid and learned hippocampal sequences. Science 351(6280),1440–1443 (2016). [DOI] [PMC free article] [PubMed] [Google Scholar]
- 28.Wagatsuma A, Okuyama T, Sun C, Smith LM, Abe K & Tonegawa S. Locus coeruleus input to hippocampal CA3 drives single-trial learning of a novel context. Proc Natl Acad Sci 115 (2), 310–316 (2018). [DOI] [PMC free article] [PubMed] [Google Scholar]
- 29.Donegan ML, Stefanini F, Meira T, Gordon JA, Fusi S & Siegelbaum SA. Coding of social novelty in the hippocampal CA2 region and its disruption and rescue in a mouse model of schizophrenia. bioRxiv 833723; doi: 10.1101/833723 [DOI] [PMC free article] [PubMed] [Google Scholar]
- 30.Chevaleyre V & Siegelbaum SA. Strong CA2 pyramidal neuron synapses define a powerful disynaptic cortico-hippocampal loop. Neuron 66 (4), 560–572 (2010). [DOI] [PMC free article] [PubMed] [Google Scholar]
- 31.Davoudi H & Foster DJ. Acute silencing of hippocampal CA3 reveals a dominant role in place field responses. Nat Neuroscience 22, 337–342 (2019). [DOI] [PMC free article] [PubMed] [Google Scholar]
- 32.Quiroga RQ, Reddy L, Kreiman G, Koch C & Fried I. Invariant visual representation by single neurons in the human brain. Nature 435(7045), 1102–7 (2016). [DOI] [PubMed] [Google Scholar]
- 33.Rey HG, Gori B, Chaure FJ, Collavini S, Blenkmann AO, Seoane P, Seoane E, Kochen S, Quiroga RQ. Single neuron coding of identity in the human hippocampal formation. Current Biology 30, 1–8 (2020). [DOI] [PMC free article] [PubMed] [Google Scholar]
- 34.Okuyama T, Kitamura T, Roy DS, Itohara S & Tonegawa S. Ventral CA1 neurons store social memory. Science. 353, 6307, 1536–1541 (2016). [DOI] [PMC free article] [PubMed] [Google Scholar]
- 35.Tamamaki N, Abe K & Nojyo Y. Three-dimensional analysis of the axonal arbors originating from single CA2 pyramidal neurons in the rat hippocampus with the aid of a computer graphic technique. Brain Research 452, 255–272 (1988). [DOI] [PubMed] [Google Scholar]
- 36.Rao RP, von Heimendahl M, Bahr V & Brecht M. Neuronal responses to conspecifics in the ventral CA1. Cell Reports 27, 3460–3472 (2019). [DOI] [PubMed] [Google Scholar]
- 37.Omer DB, Maimon SR, Las L, Ulanovsky N. Social place-cells in the bat hippocampus. Science. (359) 6372, 218–224 (2018). [DOI] [PubMed] [Google Scholar]
- 38.Danjo T, Toyoizumi T, Fujisawa S. Spatial representations of self and other in the hippocampus. Science. (359) 6372, 213–218 (2018). [DOI] [PubMed] [Google Scholar]
- 39.Fernández-Ruiz A, Oliva A, Nagy GA, Maurer AP, Berényi A & Buzsáki G. Entorhinal-CA3 dual-input control of spike timing in the hippocampus by theta-gamma coupling. Neuron 93(5), 1213–1226 (2017). [DOI] [PMC free article] [PubMed] [Google Scholar]
- 40.Ylinen A, Bragin A, Nádasdy Z, Jandó G, Szabó I, Sik A & Buzsáki G. Sharp wave-associated high-frequency oscillation (200 Hz) in the intact hippocampus: Network and intracellular mechanisms. J. Neurosci 15, 30–46 (1995). [DOI] [PMC free article] [PubMed] [Google Scholar]
- 41.Fernández-Ruiz A, Makarov VA, Benito N & Herreras O. Schaffer-specific local field potentials reflect discrete excitatory events at gamma frequency that may fire postsynaptic hippocampal CA1 units. J. Neurosci 32(15),5165–76 (2012). [DOI] [PMC free article] [PubMed] [Google Scholar]
- 42.Roux L, Hu B, Eichler R, Stark E & Buzsaki G. Sharp wave ripples during learning stabilize hippocampal spatial map. Nat. Neurosci 20, 845–853 (2017). [DOI] [PMC free article] [PubMed] [Google Scholar]
- 43.Mathis A, Mamidanna P, Cury KM, Abe T, Murthy VN, Mathis MW & Bethge M. DeepLabCut: markerless pose estimation of user-defined body parts with deep learning. Nat. Neurosci 21, 1281–1289 (2018). [DOI] [PubMed] [Google Scholar]
- 44.Pachitariu M, Steinmetz N, Kadir S, Carandini M, Harris KD. Fast and accurate spike sorting of high-channel count probes with KiloSort. 30th. NIPS 2016.
- 45.Mizuseki K, Sirota A, Pastalkova E, Buzsáki G. Theta oscillations provide temporal windows for local circuit computation in the entorhinal-hippocampal loop. Neuron 64(2),267–80 (2009). [DOI] [PMC free article] [PubMed] [Google Scholar]
- 46.Skaggs WE, McNaughton BL, Wilson MA, Barnes CA. Theta Phase Precession in Hippocampal Neuronal Populations and the Compression of Temporal Sequences. Hippocampus 6,149–172 (1996). [DOI] [PubMed] [Google Scholar]
- 47.Oliva A, Fernandez-Ruiz A, Buzsaki G, Berenyi A. Spatial coding and physiological properties of hippocampal neurons in the Cornu Ammonis subregions. Hippocampus 26(12), 1593–1607 (2016). [DOI] [PubMed] [Google Scholar]
- 48.Peyrache A, Lacroix MM, Petersen PC & Buzsaki G. Internally organized mechanisms of the head direction sense. Nat Neurosci 18, 569–575 (2015). [DOI] [PMC free article] [PubMed] [Google Scholar]
- 49.Berens P (2009). CircStat: a MATLAB toolbox for circular statistic. J Stat Softw 31. [Google Scholar]
- 50.Fernandez-Lamo I, Gomez-Dominguez D, Sanchez-Aguilera A, Oliva A, Morales AV, Valero M, Cid E, Berenyi A, Menendez de la Prida L. Proximodistal organization of the CA2 hippocampal area. Cell Rep 26(7):1734–1746.e6 (2019). [DOI] [PMC free article] [PubMed] [Google Scholar]
Associated Data
This section collects any data citations, data availability statements, or supplementary materials included in this article.
Supplementary Materials
Data Availability Statement
Datasets and analytical tools included in this study will be made available upon request.