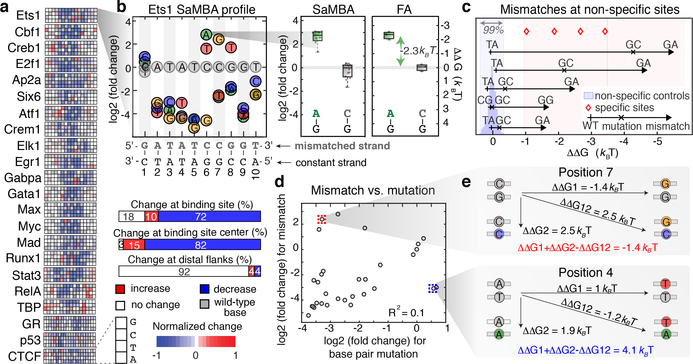
Figure 2. The effects of DNA mismatches on TF binding.
(a) SaMBA profiles for the 22 tested TFs. Heatmaps show the effects of mismatches on TF binding, normalized so −1 corresponds to the largest decrease (Methods).
(b) SaMBA profile for Ets1, with a representative mismatch-induced binding increase that was independently validated by fluorescence anisotropy (FA). Y-axis: log2 fold-change in median signal intensity, relative to the Watson-Crick site. Colored circles: significant changes (p-value < 0.05, one-sided Mann-Whitney U-test with Benjamini-Hochberg correction). Boxplots show median signals over replicate DNA spots for SaMBA (n=8 or 12 for the mismatch and Watson-Crick site, respectively) and replicate experiments for EMSA (n=3). Boxes extend to the 25th and 75th percentiles. Whiskers extend to the most extreme data points.
(c) Five validated examples of mismatches in non-specific sequences that increase Ets1 binding to levels similar to specific sites (Methods). Each arrow corresponds to one mismatch in a particular non-specific sequence (Supplementary Table 2c). In some cases, Watson-Crick mutations also increase binding affinity, albeit to a smaller extent, indicating that the identity of the newly introduced base is important for enhanced binding affinity (Supplementary Table 2, Extended Data Fig. 5).
(d) Comparison of mismatch versus mutations effects for the Ets1 site in (b), for mismatches on the upper strand. Values represent medians over replicate spots (n=8).
(e) The energetic effects of base pair mutations (diagonal) are different from the sum of the energetic effects of the two corresponding mismatches, demonstrating deviations from an additive model.

