

Abstract
Microfluidic magnetophoresis is a powerful technique that is used to separate and/or isolate cells of interest from complex matrices for analysis. However, mechanical pumps are required to drive flow, limiting portability and making translation to point-of-care (POC) settings difficult. Microfluidic paper-based analytical devices (μPADs) offer an alternative to traditional microfluidic devices that do not require external pumps to generate flow. However, μPADs are not typically used for particle analysis because most particles become trapped in the porous fiber network. Here we report the ability of newly developed fast-flow microfluidic paper-based analytical devices (ffPADs) to perform magnetophoresis. ffPADs use capillary action in a gap between stacked layers of paper and transparency sheets to drive flow at higher velocities than traditional μPADs. The multi-layer ffPADs allow particles and cells to move through the gap without being trapped in the paper layers. We first demonstrate that ffPADs enable magnetic particle separations in a μPAD with a neodymium permanent magnet and study key factors that affect performance. To demonstrate utility, E. coli was used as a model analyte and was isolated from human urine before detection with a fluorescently labeled antibody. A capture efficiency of 61.5% was then obtained of E. coli labeled magnetic beads in human urine. Future studies will look at the improvement of the capture efficiency and to make this assay completely off-chip without the need of a fluorescent label. The assay and device described here demonstrate the first example of magnetophoresis in a paper based, pump free microfluidic device.
1. Introduction
Improving medical diagnostics is a key need to reduce the 15 million deaths a year from infectious diseases.1 While significant improvement has been made in the field, patients in many parts of the world still cannot access early diagnosis which is crucial for adequate care.2–5 For example, sepsis patients treated within one day of showing symptoms had a 10% mortality rate, while those treated after three days had a 50% mortality rate.6 Current infectious disease detection methods include culturing, polymerase chain reaction (PCR), and enzyme-linked immunosorbent assay (ELISA).1, 7 These methods are widely accepted because of their ability to detect bacteria with low limits of detection.8–10 However, all require trained personnel, can take days to weeks to complete, and cost at least $10 per test.11 Consequently, a simple, rapid, and reliable point-of-care (POC) diagnostic for the detection of infectious diseases that is both sensitive and selective is needed. Land et al. recently recommended POC technologies to meet a REASSURED criteria.12 These criteria are defined as real-time connectivity, ease of specimen collection, affordable, sensitive, specific, user-friendly, rapid and robust, and equipment-free. μPADs are one technology that meets many of these requirements but suffers from slow fluid velocity and poor limits of detection.2, 13 One technique known to improve detection limits and selectivity of an assay is to separate target analytes from the sample matrix.14
In this work, we are focused on isolating bacteria from complex matrices to remove interferents, concentrate the target cells, and improve detection performance. The cell separation/isolation process can be tedious, so microfluidic platforms have been developed to automate and simplify this process.15 A popular microfluidic separation approach is magnetophoresis, which separates cells in continuous flow using a permanent magnet to move magnetically labeled cells from one flowing stream to another.16 However, magnetophoresis requires external pumps to drive flow, limiting their portability and usefulness for POC applications. μPADs transport fluid via capillary action, which eliminates the need for external pumps,17 but are not currently used for magnetophoresis because particles and cells become trapped in the paper fibers and fluid velocities generated in μPADs are not fast enough for continuous separation.18 In this work we solve both issues by creating fast flow in a modified multi-layer μPAD.2, 13, 19–21 Fast-flow μPADs (ffPADs) are created by stacking two layers of wax-printed paper around laser cut double sided adhesive to create channels or gaps. The channels between paper layers enable fast flow without trapping particles. The velocities in the multi-layer μPAD increase by 145× or more compared to single-layer μPADs. The fast-flow phenomenon seen with this method of fabrication was characterized in depth previously in Channon et al.19, 20 Taking advantage of this fast-flow phenomenon provides a way to make paper-based magnetophoresis possible.19 Herein we describe the first example of a paper-based, pump-free magnetophoretic device and demonstrate its capabilities by detecting bacteria in urine. We envision the μPAD designed here for rapid detection of E. coli and other bacteria and viruses would benefit both food safety and human health diagnostics.
2. Materials and Methods
2.1. Materials.
Whatman 1 chromatrography paper was purchased from GE Healthcare Sciences. Wax patterns were printed using a Xerox ColorQube 8870 and an IsoTemp hot plate (Fisher Scientific) was used to melt the wax. A benchtop digital microscope (Dino-Lite AF4915) was used for laminar flow colorimetric experiements. Two fluorescent Dino-Lite digital microscopes with exictation wavelengths of 400 nm and 570 nm (Dino-Lite AM4115T-CFVW and Dino-Lite AM4115T-YFGW) were used for fluorescence detection and analysis. All videos were imported into ImageJ for analysis. A cynlindrical ¼” × ¼” Neodymium Iron Boron (NdFeB) permanent magnet, grade N52 (K&J Mangetics, INC.) was used to create an external magnetic field. Other magnet types and shapes were investigated, however the cynlindrical magnet was choosen because of the smaller size while maintaining strong field lines. All magentic beads were purchased from Spherotech Inc. (Lake Forest, Illnois). E. coli antibodies (bs-2033R/bs-2033R-A555) were purchased from Bioss Antibodies. The buffers used in this work were 0.1 M phosphate-buffered saline (PBS) and 0.1 M PBS with 0.1% Tween-20 (PBST). The two antibodies were diluted in PBS. Human pooled urine was purchaed from Lee Biosolutions (Maryland Heights, MO).
2.2. Device Design and Fabrication.
The μPADs discussed here were designed in CorelDRAW X4 and then printed onto Whatman grade 1 chromatography paper and a cellulose acetate transparency sheet (3M PP2950). Next the paper was placed on a hot plate at 150°C for 90 s to create hydrophobic barriers. Grade 467 and 468 double-sided adhesive were used to define the gap height, and the channel pattern was cut out using a CO2 laser cutter (Epilog Zing Laser Cutter and Engraver). The multilayered device was then assembled in 8.5”×11” sheets by first applying the double-sided adhesive to the transparency and applying consistent pressure with a pouch laminator set at room temperature. Next, the top paper layer was placed directly onto the double-sided adhesive using a guide to provide necessary alignment to create the ffPAD.
2.3. Magnetophoresis System Setup.
A range of fluorescent carboxyl magnetic particles from 2.0 μm to 44.1 μm were purchased from Spherotech Inc. and diluted from 5 mg/mL to 1 mg/mL in phosphate buffered saline (PBS). All 44.1 μm particles used in these and following studies were labeled with a yellow fluorophore onto the surface of the particles with an excitation wavelength from 400–500 nm and emission from 450–550 nm. Imaging was done with the Dino-Lite microscope (400 nm). All dilutions of particles were made in phosphate-buffered saline, pH 7.2, kept at room temperature and protected from light. Solutions were vortexed for 30 s before use (Scientific Industries Vortex Genie 2). The Grade N52 permanent magnet was placed on top of the device and placement was optimized for consistent and ideal separation results based on magnetic field lines. Images of the fluorescent particles within the gap of the device were taken using the fluorescent DinoLite microscope.
2.4. E. coli Growth and Sample Preparation.
E. coli DH5-α was used as the model bacteria in this work; it was grown in Universal Pre-Enrichment Broth (Sigma-Aldrich, pH 7) overnight in a shaker at 37°C and 220 rpm. The bacteria concentration was quantified by serial dilution and plating on lysogeny broth (LB) agar plates. Serial dilutions of this soltuion were made using PBS or human pooled urine.
2.5. E. coli Detection Using Immunomagnetic Separation and H-Cell Device in Human Urine.
The enzymatic assay presented by Srisa-Art et al. was modified for DH5-α detection.22 The entire assay was perfromed on the benchtop at room temperature. First, 44.1 μm streptavidin-coated paramagnetic beads (SpheroTech) were vortexed for 30 s at room temperature. Second, the beads were conjugated to a biotinylated anti-E. coli antibody in a microcentrifuge for 20 min on a rotator. Third, an immunomagnetic separation (IMS) was performed using a magnet (DynaMag-2 magnet, Thermo Fisher Scientific, Inc.) to isolate and concentrate the magnetic bead-antibody complex by removing the supernatant and resuspending the content in 100 μL of PBS. Fourth, the bead-antibody complex was added to 1 mL of E. coli spiked urine and incubated on a rotator for 20 min. Another IMS step was performed to isolate/concentrate the sample and to remove the supernatant. The complex was washed twice with PBS-Tween (0.1%) to remove any unbound species. Finally, an anti-E. coli AlexaFluor-555 was conjugated to the bead complex for 20 min on a rotator. The final complex was then washed twice using IMS with PBS-Tween. The complex was then resuspended in 50 μL of urine. 30 μL of the complex was then added simulatenoulsy to the device with 30 μL of PBS buffer to create capillary driven laminar flow. The permanet magnet was placed on the adjacent channel at the desired detection zone. After 30 s the fast-flow has stopped and analysis of E. coli capture was performed.
2.6. Image Analysis.
Videos of all experiments were taken with the DinoLite microscopes and pictures were then exported to be analyzed in NIH ImageJ. The images were split into red, green, and blue channels for elimination of background signal and analysis. Fluorescence intensity plots were created with proportional mean grey scale values.
3. Results and Discussion
3.1. Device Dimensions and Laminar Flow.
An H-cell device was created from paper and transparency film to demonstrate capillary driven laminar flow was possible. The device was assembled by stacking packing tape, paper, double-sided adhesive, transparency together as shown in Fig.1a. Fig. 1b shows the cross-sectional view of the channel once the device is assembled. ffPADs yield faster sustained flows than traditional μPADs, as demonstrated in Fig. 1c where the liquid 6 cm from the inlet in a ffPAD with 360 μm gap has a speed of 0.62 cm/s versus 0.0035 cm/s in traditional single-layer μPAD.19 The gap height can be controlled by changing the number of double-sided adhesive layers placed between the paper and transparency layers. Modeling of this phenomenon recently published by Channon et al. describes flow dominated by Laplace pressure for the first 1–2 cm.20 Shown by a still image in the supplemental, the fluid flow in the gap of the device is dragging the liquid in the paper layer. The flow in the gap is then dominated by a “moving wall” of liquid, resulting in a shear flow within the paper and a linear velocity profile.19, 20 The modeling described is confirmed by the experimental results in Fig. 1c where there are fast initial velocities of over 4 cm/s for a 360 μm gap height that decay over time.20 The fluid velocities in the devices shown here have similar flow characteristics and show the same experimental results described by Channon et al.19, 20 Although ffPADs have shown faster velocities when compared to traditional μPADs, the maximum Reynolds number (Re) in the multi-layer device was calculated to be 2.0, which occurred in the 360 μm gap configuration, confirming that flow is extremely laminar. Based on the studies showing sustained high velocities, we were led to hypothesize that magnetophoresis was possible because ffPADs have a large enough gap height for the majority of suspended particles to avoid being trapped in the cellulose fibers.4, 19, 23
Fig. 1.

Assembly and flow characteristics of microfluidic paper-based analytical devices (μPADs) (a) Schematic of fast-flow μPAD assembly. (b) Cross-sectional view of channel of fast flow μPADs, with flow to-ward/away from the observer. (c) Plot showing flow velocities with respect to gap height.
We next sought to demonstrate laminar flow in the ffPAD configuration because consistent laminar flow is needed for magnetophoresis to avoid convective mixing between the two parallel flowing streams in the H-cell.24 A ffPAD with two inlets containing red and green dyes showed a clear interface between the two liquid streams, again confirming laminar flow was established in the device with only slight diffuisonal mixing (Fig. 2a). Following the demonstration of fully developed laminar flow, the effect of inlet angle was quantified using the absolute mixing index (AMI) as a measure of total mixing. AMI indicates the extent of mixing and operates on a scale of 0–1, where 0 indicates a completely mixed state and 1 indicates a completely unmixed state. Photographs above each gragh in Fig. 2b show each device and the main channel where the analysis is performed. Devices I, II, and III were all consistent with a 3 mm wide channel with only changing the angle of the inlet. Where device I had a 90° angle, device II had a 180° angle and device III had a 15° angle. Devices I and II showed inconsistent flow with relativley large standard deviation of ±1 shown in blue. In device III a 15° angle between the two inlets led to less mixing and more reproducible laminar flow. Device IV was fabricated incorporating the optimal angle geometry with a 270° fan at end of the channels that produces steady flow in paper analytical devices.21, 25 Inserting the fan decreased variability and increased AMI (Fig. 2b). Device IV showed the most reproducible laminar flow along with the least mixing denoted by an AMI of 0.7 with only diffusional mixing occuring. As a result, the Device IV geometry was selected for subsequent studies.
Fig 2.
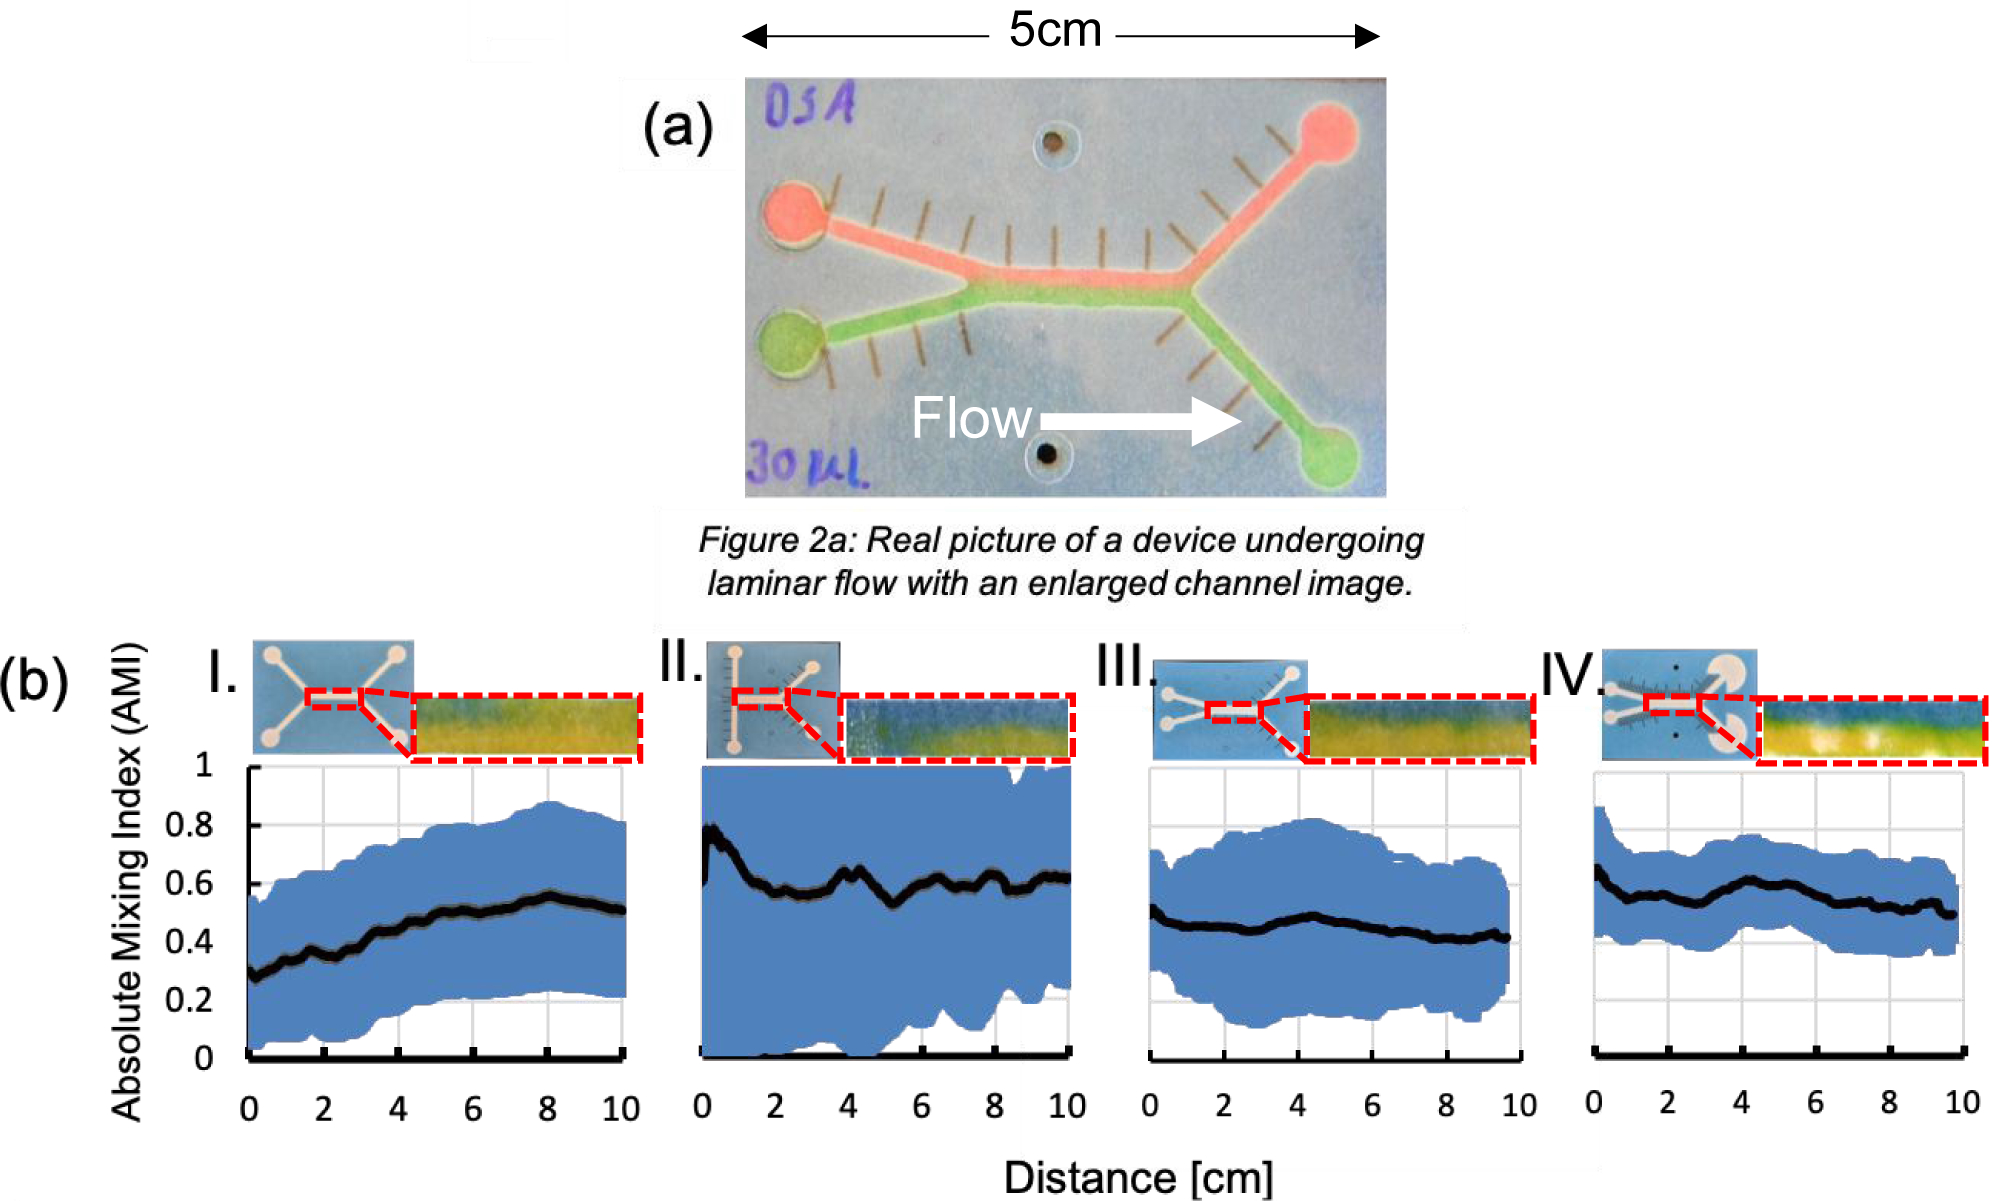
(a) Image taken of fast-flow μPAD with laminar flow. (b) Images taken of the middle channel to analyze AMI. The corresponding graphs show the effect the angle has on consistency of laminar flow by quantifying the amount of mixing of each device.
3.2. Understanding Particle Behavior.
Once velocities and laminar flow parameters were characterized, particle separation via magnetophoresis was investigated. Since the bottom layer of the ffPADs was made from transparency film, it was possible to image the magnetic particles inside the gap. Fig. 3a shows a qualitative schematic of expected particle trajectories, where magnetic particles move across the laminar flow interface and are trapped by a permanent magnet. The NdFeB permanent magnet was placed on the top side of the device on the edge of the channel. 2 μm, 8 μm, and 44.1 μm magnetic particles were tested. The sizes were selected based on commercial availability. 2 μm and 8 μm particles were retained within the paper fibers resulting in no observable movement across the parallel flowing streams and significant fluorescent background in the channel (Figs. 3b and 3c). Whatman 1 chromatography paper has an average pore size of 11 μm, which resulted in trapping particles size smaller than 11 μm in the device. In addition to particle size, the magnetic susceptibility changes proportionally with the size of the particles. As a result, the 44.1 μm particles remained in the gap area between paper and transparency film and could be moved across the laminar flow barrier with ease (Fig. 3d). The 44.1 μm magnetic particles also accumulated near the magnet. As a control, the trajectories of the 44.1 μm particles were obtained in the absence of a magnetic field. Without the field present the particles largely followed the liquid streamlines and did not cross the parallel streams’ interface (Fig. 3e). The flow velocities of the particles follow velocities shown in Fig. 1c. The ability to pull the 44.1 μm particles from one stream to another with the magnetic field under continuous flow is the first time magnetophoresis has been demonstrated in a pump-free device to the best of our knowledge.
Fig 3. Magnetophoresis in microfluidic paper-based analytical devices (μPADs).

(a) Overview of magnetophoresis concept, where the white-dashed lines are the laminar flow interface (b) 2μm magnetic particles in device (c) 8μm magnetic particles in device (d) Control image of particles following streamlines in the absence of a magnetic field. (e) 44μm magnetic particles undergoing positive magnetophoresis (f) Calibration curve of fluorescent intensity of particle capture via concentration.
After confirming magnetophoresis in ffPADs, the concentration dependent signal was evaluated by analyzing the fluorescence intensity of captured particles by taking the mean grey scale intensity of the area at magnet. Fig. 3f shows the normalized fluorescence intensity variation as a function of particle concentration. The linear calibration curve shows the fluorescent signal increasing with increasing particle concentration with corresponding error bars taken from a standard deviation with an n of 3 for each concentration.
3.3. Improvements in Device Design.
The effect of gap height on particle capture was investigated. Pamme et al. showed in a glass microchip that if fluid velocities are above 0.2 cm/s then little to no deflection of magnetic particles occurs. Conversely, if velocities are lower than 0.04 cm/s the magnetic moment will be more pronounced and inherently influence the particle deflection trajectory.26 Since the velocity and magnetic field vectors are orthogonal, faster flow decreases particle deflection caused by a constant magnetic field, as described by the equation shown in Fig. 4. The fluid velocity in a ffPAD is controlled by the gap height between the layers, so the gap height was varied to study these competing effects.19 ffPAD gap heights of 60, 70, 120, 230, 290, 360, and 500 μm were tested using 44.1 μm magnetic particles and the fluorescent intensity of captured particles analyzed. A gap height between 230 and 290 μm yielded the highest number of magnetic particles captured by the magnet (Fig. 4a). In the ffPAD, a velocity exceeding ~1.5 cm/s prevented the particles from being captured. When the velocity was lower than ~0.5 cm/s the particles were retained in the paper fibers particle accumulation at the magnet was not observed.
Fig. 4.

(a) Optimization of particle capture with respect to gap height characterized by fluorescent intensity with correlated equation showing the relationship of the velocity of the particle with respect to the fluid and magnetic velocity. (b) Actual and theoretical capture efficiency in the device with an optimized gap height.
In addition to optimizing gap height, the shapes of the outlet channels were studied. The magnetic particles follow a curved deflection trajectory. To account for this trajectory and improve the efficiency of particle capture, the device design was modified to match the general shape of the trajectory. A thin wax line was also printed on the top paper layer directly down the center of the channel to improve flow reproducibility. The particles then deflect only in the gap of the device and mixing in the paper is minimized. Additionally, a larger fan with a 14 mm diameter was used with the upper channel versus a 9.5 mm diameter fan on the lower channel. The larger fan is used to continually wick the solution from the upper channel and particle inlet to transport more particles to the detection zone and improve capture efficiency (Fig. 5). The magnetic field is shown with an overlay of a schematic of the device and magnetic particles following the field lines and being attracted toward the high gradient. The shape of the outlet channels were designed to match that of the magnet field lines to further improve capture of the magnetic particles.27 After optimization of the device was completed the capture efficiency was then investigated yielding capture of 61.5% ± 5.8 (n=4) with similar efficiencies for increasing concentrations. Other studies have shown capture efficiencies anywhere from 44% to 100% with permanent magnets, however all previous studies were conducted in traditional microfluidic channels using pumps.28 Concentrations from 0.05 mg/mL to 0.3 mg/mL were selected because of the ability to physically count the number of particles in a 30 μL sample. The lowest capture was reported for the highest concentration because particles will aggregate at higher concentrations. The calculated capture efficiency of 61.5% was further analyzed and it was determined that many of the large 44.1 μm particles sediment to the bottom of the inlet and are trapped before reaching the capture magnet. ~5%.
Fig. 5.

(a) CAD rendering of device design and an actual image of the fabricated μPAD. (b) Magnetic field gradient of a N52 cylindrical NdFeB magnet overlay with channel, red spheres indicate magnetic particles. Magnetic flux density estimated to be 1300 guass or 130 mT near the center of the channel. (Magnet image enlarged for viewing purpose)
3.4. E. coli Magnetophoresis in Urine
Escherichia coli (E. coli) is a common bacterium found in food and water that causes millions of infections per year in the US. E. coli accounts for 70–95% of all urinary tract infections (UTIs).29 An immunomagnetic sandwich E. coli assay in urine was performed to demonstrate the ability to carry out analysis on real samples. To verify that the 44.1 μm beads would capture E. coli, the streptavidin coated beads were modified with biotinylated anti-E.coli and incubated with 107 CFU/mL E. coli labeled with a fluorescent secondary antibody. As shown in Fig. 6c, fluorescently labeled bacteria are bound to the surface of the magnetic beads at 107 CFU/mL. To demonstrate that the device could process a complex sample matrix, the optimized magnetophoresis assay was performed using human urine. 30 μL of the streptavidin magnetic bead antibody complex was incubated in a urine sample spiked with E. coli during the antibody conjugation. A full schematic of the conjugation process can be found in the supporting information. After conjugation was complete, the complex was resuspended in urine and the detection of the labeled E. coli was shown in the device via magnetophoresis along with a blank (Figs. 6a and b) at 107 CFU/mL of E. coli for the positive test. Next, serial dilutions from 107 CFU/mL to 101 CFU/mL were used to create a dose-response curve (Fig. 6d). The LOD in the device of 105 CFU/mL is not as low as a colorimetric response seen previously by our group of 102 CFU/mL for IMS methods,22 but still demonstrates proof-of-concept. Detection limits could be improved in a few ways. First, enzymatic amplification instead of a fluorescent tag has been shown to improve the LOD especially in μPADs. Second, if the lower concentrations of E. coli were cultured prior to conjugation it would improve the LOD as well.30, 31 The final complex was introduced into the device and compared against the blank to see significant capture E. coli in the device in less than 30 s. Further investigation will be done to try to improve the capture efficiency with sequential washing steps to fully wash any complexes left in the inlet, and by adding a surfactant to the buffer to decrease particle-transparency interactions. Fluorescence detection is convenient for rapid detection of the complex, however we found it was limited by intensity when trying to record the entire channel.
Fig. 6. Detection of fluorescently labeled bacteria in μPAD magnetophoresis.

(a) Inverted image of positive magnetophoresis of E. coli complex. (b) Negative control assay (without E. coli). False color has been applied for visualization (c) Fluorescent microscope image taken of bound E. coli to bead. (d) Dose-response curve of E.coli in urine in the device
4. Conclusions and Future Directions
In this work, the first example of a pump-free paper-based magnetophoresis device is demonstrated. The novel design shows efficient capture and detection of magnetic particles made possible by the fast flow system with sustained high velocities. Device dimensions, particle size, gap height, and magnet placement and strength were all studied to improve particle capture and reduce convective and diffusional mixing between the two flow streams. A capture efficiency of 61.5% was obtained and further investigation is being done to improve this as described above. Even though this capture efficiency is not as high as other magnetophoretic devices, this device represents a novel approach to a technique that has not previously been demonstrated in paper. The current method for this assay involves several off-chip steps, but future work will also seek to integrate all steps to minimize assay complexity. We envision additional new potential diagnostic platforms possible because of the technique described. Future work will target adapting the system to incorporate the off-chip manipulations onto the device and to detect multiple pathogens at once.
Supplementary Material
Acknowledgements
This work was supported with funding from the National Institutes of Health (R33ES024719-05) and the USDA (1574000859CA) to CSH. Additional funding was provided by Colorado State University.
References
- 1.Dye C, After 2015: infectious diseases in a new era of health and development. Philosophical Transactions of the Royal Society B-Biological Sciences 2014, 369 (1645). [DOI] [PMC free article] [PubMed] [Google Scholar]
- 2.Carrell C; Kava A; Nguyen M; Menger R; Munshi Z; Call Z; Nussbaum M; Henry C, Beyond the lateral flow assay: A review of paper-based microfluidics. 2019, 206, 45–54. [Google Scholar]
- 3.Petryayeva E; Algar WR, Toward point-of-care diagnostics with consumer electronic devices: the expanding role of nanoparticles. Rsc Advances 2015, 5 (28), 22256–22282. [Google Scholar]
- 4.Martinez AW; Phillips ST; Whitesides GM; Carrilho E, Diagnostics for the Developing World: Microfluidic Paper-Based Analytical Devices. Analytical Chemistry 2010, 82 (1), 3–10. [DOI] [PubMed] [Google Scholar]
- 5.Yager P; Domingo GJ; Gerdes J, Point-of-care diagnostics for global health. Annual Review of Biomedical Engineering 2008, 10, 107–144. [DOI] [PubMed] [Google Scholar]
- 6.Dellinger RP; Levy MM; Rhodes A; Annane D; Gerlach H; Opal SM; Surviving Sepsis Campaign G., Surviving Sepsis Campaign: International Guidelines for Management of Severe Sepsis and Septic Shock: 2012. Crit. Care Med 2013, 41 (2), 580–637. [DOI] [PubMed] [Google Scholar]
- 7.Chin CD; Linder V; Sia SK, Commercialization of microfluidic point-of-care diagnostic devices. Lab on a Chip 2012, 12 (12), 2118–2134. [DOI] [PubMed] [Google Scholar]
- 8.Myers FB; Lee LP, Innovations in optical microfluidic technologies for point-of-care diagnostics. Lab on a Chip 2008, 8 (12), 2015–2031. [DOI] [PubMed] [Google Scholar]
- 9.Mahony JB; Blackhouse G; Babwah J; Smieja M; Buracond S; Chong S; Ciccotelli W; O’Shea T; Alnakhli D; Griffiths-Turner M; Goeree R, Cost Analysis of Multiplex PCR Testing for Diagnosing Respiratory Virus Infections. Journal of Clinical Microbiology 2009, 47 (9), 2812–2817. [DOI] [PMC free article] [PubMed] [Google Scholar]
- 10.Bissonnette L; Bergeron MG, Diagnosing infections--current and anticipated technologies for point-of-care diagnostics and home-based testing. Clinical Microbiology and Infection 2010, 16 (8), 1044–1053. [DOI] [PubMed] [Google Scholar]
- 11.Wormser GP; Levin A; Soman S; Adenikinju O; Longo MV; Branda JA, Comparative Cost-Effectiveness of Two-Tiered Testing Strategies for Serodiagnosis of Lyme Disease with Noncutaneous Manifestations. Journal of Clinical Microbiology 2013, 51 (12), 4045–4049. [DOI] [PMC free article] [PubMed] [Google Scholar]
- 12.Land KJ; Boeras DI; Chen X-S; Ramsay AR; Peeling RW, REASSURED diagnostics to inform disease control strategies, strengthen health systems and improve patient outcomes. Nature Microbiology 2019, 4 (1), 46–54. [DOI] [PMC free article] [PubMed] [Google Scholar]
- 13.Osborn JL; Lutz B; Fu E; Kauffman P; Stevens DY; Yager P, Microfluidics without pumps: reinventing the T-sensor and H-filter in paper networks. Lab on a Chip 2010, 10 (20), 2659–2665. [DOI] [PMC free article] [PubMed] [Google Scholar]
- 14.Bhagat AAS; Bow H; Hou HW; Tan SJ; Han J; Lim CT, Microfluidics for cell separation. Medical & Biological Engineering & Computing 2010, 48 (10), 999–1014. [DOI] [PubMed] [Google Scholar]
- 15.Yaman S; Anil-Inevi M; Ozcivici E; Tekin HC, Magnetic Force-Based Micro fluidic Techniques for Cellular and Tissue Bioengineering. Front. Bioeng. Biotechnol 2018, 6, 29. [DOI] [PMC free article] [PubMed] [Google Scholar]
- 16.Zborowski M; Ostera GR; Moore LR; Milliron S; Chalmers JJ; Schechter AN, Red blood cell magnetophoresis. Biophysical journal 2003, 84 (4), 2638–2645. [DOI] [PMC free article] [PubMed] [Google Scholar]
- 17.Cate DM; Adkins JA; Mettakoonpitak J; Henry CS, Recent Developments in Paper-Based Microfluidic Devices. Analytical Chemistry 2015, 87 (1), 19–41. [DOI] [PubMed] [Google Scholar]
- 18.Kasetsirikul S; Shiddiky MJA; Nguyen N-T, Challenges and perspectives in the development of paper-based lateral flow assays. Microfluidics and Nanofluidics 2020, 24 (2), 17. [Google Scholar]
- 19.Channon RB; Nguyen MP; Scorzelli AG; Henry EM; Volckens J; Dandy DS; Henry CS, Rapid flow in multilayer microfluidic paper-based analytical devices. Lab on a Chip 2018, 18 (5), 793–802. [DOI] [PMC free article] [PubMed] [Google Scholar]
- 20.Channon Robert B., N. MP, Henry Charles S., Dandy David S., Multilayered Microfluidic Paper-Based Devices: Characterization,Modeling, and Perspectives. 2019. [DOI] [PMC free article] [PubMed] [Google Scholar]
- 21.Adkins JA; Boehle K; Friend C; Chamberlain B; Bisha B; Henry CS, Colorimetric and Electrochemical Bacteria Detection Using Printed Paper- and Transparency-Based Analytic Devices. Analytical Chemistry 2017, 89 (6), 3613–3621. [DOI] [PubMed] [Google Scholar]
- 22.Srisa-Art M; Boehle KE; Geiss BJ; Henry CS, Highly Sensitive Detection of Salmonella typhimurium Using a Colorimetric Paper-Based Analytical Device Coupled with Immunomagnetic Separation. Analytical Chemistry 2018, 90 (1), 1035–1043. [DOI] [PubMed] [Google Scholar]
- 23.Pamme N; Manz A, On-chip free-flow magnetophoresis: Continuous flow separation of magnetic particles and agglomerates. Analytical Chemistry 2004, 76 (24), 7250–7256. [DOI] [PubMed] [Google Scholar]
- 24.Choban ER; Markoski LJ; Wieckowski A; Kenis PJA, Microfluidic fuel cell based on laminar flow. J. Power Sources 2004, 128 (1), 54–60. [Google Scholar]
- 25.Mendez S; Fenton EM; Gallegos GR; Petsev DN; Sibbett SS; Stone HA; Zhang Y; Lopez GP, Imbibition in Porous Membranes of Complex Shape: Quasi-stationary Flow in Thin Rectangular Segments. Langmuir 2010, 26 (2), 1380–1385. [DOI] [PubMed] [Google Scholar]
- 26.Pamme N; Wilhelm C, Continuous sorting of magnetic cells via on-chip free-flow magnetophoresis. Lab on a Chip 2006, 6 (8), 974–980. [DOI] [PubMed] [Google Scholar]
- 27.K&J magnetics, I. Magnetic Field Visualization Single Magnet in Free Space. https://www.kjmagnetics.com/magfield.asp?pName=D22-N52 (accessed 01-11-20).
- 28.Alnaimat F; Dagher S; Mathew B; Hilal-Alnqbi A; Khashan S, Microfluidics Based Magnetophoresis: A Review. Chem. Rec 2018, 18 (11), 1596–1612. [DOI] [PubMed] [Google Scholar]
- 29.Flores-Mireles AL; Walker JN; Caparon M; Hultgren SJ, Urinary tract infections: epidemiology, mechanisms of infection and treatment options. Nature Reviews Microbiology 2015, 13 (5), 269–284. [DOI] [PMC free article] [PubMed] [Google Scholar]
- 30.Shih CM; Chang CL; Hsu MY; Lin JY; Kuan CM; Wang HK; Huang CT; Chung MC; Huang KC; Hsu CE; Wang CY; Shen YC; Cheng CM, Paper-based ELISA to rapidly detect Escherichia coli. Talanta 2015, 145, 2–5. [DOI] [PubMed] [Google Scholar]
- 31.Aspevall O; Osterman B; Dittmer R; Stén L; Lindbäck E; Forsum U, Performance of Four Chromogenic Urine Culture Media after One or Two Days of Incubation Compared with Reference Media. Journal of Clinical Microbiology 2002, 40 (4), 1500–1503. [DOI] [PMC free article] [PubMed] [Google Scholar]
Associated Data
This section collects any data citations, data availability statements, or supplementary materials included in this article.