

Abstract
Metabolic engineering of mammalian cells has to-date focused primarily on biopharmaceutical protein production or the manipulation of native metabolic processes towards therapeutic aims. However, significant potential exists for expanding these techniques to diverse applications by looking across the taxonomic tree to bioactive metabolites not synthesized in animals. Namely, cross-taxa metabolic engineering of mammalian cells could offer value in applications ranging food and nutrition to regenerative medicine or gene therapy. Towards the former, recent advances in meat production through cell culture suggest the potential to produce meat with fine cellular control, where tuning composition through cross-taxa metabolic engineering could enhance nutrition and food-functionality. Here we demonstrate this possibility by engineering primary bovine and immortalized murine muscle cells with prokaryotic enzymes to endogenously produce the antioxidant carotenoids phytoene, lycopene and β-carotene. These phytonutrients offer general nutritive value and protective effects against diseases associated with red and processed meat consumption, and so offer a promising proof-of-concept for nutritional engineering in cultured meat. We demonstrate the phenotypic integrity of engineered cells, the ability to tune carotenoid yields, and antioxidant functionality of these compounds in vitro towards both nutrition and food-quality objectives. Our results demonstrate the potential for tailoring the nutritional profile of cultured meats. They further lay a foundation for heterologous metabolic engineering of mammalian cells for applications outside of the clinical realm.
Keywords: Cultured meat, In vitro meat, Cell-based meat, Cultivated meat, Cellular agriculture, Nutritional engineering, Carotenoids
1. Introduction
Synthetic biology and metabolic engineering have become major tools across numerous disciplines(Keasling, 2010). However, broad use in mammalian systems has been slow to develop, and progress within these systems has been largely isolated to applications such as therapeutic protein production (e.g., monoclonal antibodies) or the study and treatment of disease (e.g., metabolic reprogramming)(Davy et al., 2017; Schukur and Fussenegger, 2016). In these efforts, apart from genetic tools such as viral or bacterial editing or regulatory systems, little attention has been given to heterologous engineering of mammalian cells using genes from other taxa (i.e., bacteria or plants)(Mojica and Montoliu, 2016; Zhang et al., 2006). In contrast, metabolic engineering efforts in bacteria, yeasts or plants have exploited diverse taxonomic transgenes for applications from medicine and cosmetics to energy and agriculture(Heider and Wendisch, 2015; Nielsen, 2015; Sack et al., 2015). Recent advances in tissue engineering have expanded our perspective about possible applications of animal cell culture to food and nutrition, robotics, and biosensors(Banerjee and Bhunia, 2009; Rubio et al., 2019). This shift provides the opportunity to revisit mammalian metabolic engineering and expand efforts to include cross-taxa engineering for broad applications.
One such application is the production of meat through cell culture (known by various terms—this paper will use “cultured meat”), which has been proposed as a means of addressing the environmental, ethical, and public-health concerns of animal agriculture(Mattick et al., 2015; Post, 2012). The cell-level control inherent to cultured meat enables the use of metabolic engineering to tune composition towards diverse aims, and the uncoupling of products from whole animal viability—which inherently constrains livestock transgenesis—expands possible targets. Specifically, incorporating complete pathways for plant nutrient synthesis into animal cells offers a particularly promising approach due to these nutrients’ bioactivities towards a range of bioprocess or food features. For instance, lipid and protein oxidation are key mechanistic links between red or processed meat consumption and colorectal cancer, as well as major contributors to meat quality loss during storage(Falowo et al., 2014; Wolk, 2017) Incorporating metabolic pathways for the synthesis of antioxidants not native to animals could therefore enhance both nutrition and meat-quality features.
Here we demonstrate this with a biosynthetic pathway for antioxidant phytonutrients (carotenoids), which are native to plants and some prokaryotes, but not animals. These nutrients confer multiple benefits through their status as antioxidants, provitamins, and free radical scavengers(Botella-Pavia and Rodriguez-Concepcion, 2006). Using non-viral Sleeping Beauty transposon-mediated transgenesis of phytoene synthase (CrtB), phytoene desaturase (CrtI), and lycopene cyclase (CrtY) from the bacterium Pantoea ananatis, we convert native geranylgeranyl pyrophosphate (GGPP) into phytoene, lycopene, and β-carotene in immortalized mouse myoblasts and primary bovine muscle stem cells(Botella-Pavia and Rodriguez-Concepcion, 2006; Izsvák et al., 2000). This work builds on previous crop engineering efforts and evidence for CrtB efficacy in mammalian cells(Satomi et al., 1995; Ye et al., 2000). We confirm the endogenous production of all three carotenoids and show that cellular myogenicity is maintained following modification. We then quantify and optimize carotenoid production through increased enzyme expression and induced precursor accumulation, obtaining yields substantially higher than reported levels for beef (1.6 to 2.9 μg/g protein, depending on animal feeding diet) (Simonne et al., 1996). Finally, we validate the antioxidant capacity of endogenous carotenoids in vitro, which points towards nutritional and food-quality functionality. This work represents the first case of nutritional engineering for cultured meat and demonstrates how cross-taxa transgenesis can broaden the scope of metabolic engineering in mammalian cells to applications beyond the clinic.
2. Materials and methods
2.1. C2C12 cell culture
C2C12 mouse skeletal myoblasts (ATCC #CRL-1772, Manassas, VA, USA) were grown on tissue-culture plastic in DMEM Glutamax (ThermoFisher #10566024, Waltham, MA, USA) supplemented with 10% fetal bovine serum (FBS; ThermoFisher #26140079) and 1% antibiotic-antimycotic (ThermoFisher #15240062)(Yaffe and Saxel, 1977). For regular cell maintenance, cells were cultured to a maximum of 70% confluence, and then either passaged using 0.25% trypsin-EDTA (ThermoFisher #25200056) or frozen in FBS with 10% Dimethyl sulfoxide (DMSO, Sigma #D2650, St. Louis, MO, USA). Cells were incubated at 37°C in 5% CO2. Throughout the study, cells were counted using a standard hemocytometer or with an NC-200 automated cell counter (Chemometec, Allerod, Denmark) following the manufacturer’s instructions.
2.2. Primary bovine satellite cell isolation and culture
Primary bovine satellite cells (BSCs) were isolated using previously described methods(Simsa et al., 2019). Briefly, a small muscle excision (~0.5 cm3) was taken from the semitendinosus of a <60-day-old Simmental bull raised at the Tufts Cummings School of Veterinary Medicine according to methods approved by the Tufts University IACUC (Protocol #G2018-36). Muscle tissue was dissected from fat and connective tissue, minced into a paste, and digested in 0.2% collagenase II (Worthington Biochemical #LS004176, Lakewood, NJ, USA; 275 U/mg) for one hour with regular trituration. Digestion was halted with growth media comprised of DMEM Glutamax supplemented with 20% FBS, 1 ng/mL human FGF-basic (ThermoFisher #68-8785-63), and 1% Primocin (Invivogen #ant-pm-1, San Diego, CA, USA), and cells were filtered and plated at a density of 100,000 cells/cm2 onto uncoated tissue-culture flasks. After 24 hours of incubation at 37°C with 5% CO2, the plated suspensions (containing slowly adherent satellite cells) were transferred to new flasks coated with 1 μg/cm2 mouse laminin (Sigma #CC095). These flasks were left untouched for three days, at which point growth media was changed, and cells were cultured using standard practices on tissue-culture plastic coated with iMatrix recombinant laminin-511 (Iwai North America #N892021, San Carlos, CA, USA). After two weeks of culture, Primocin in growth media was replaced with 1% antibiotic-antimycotic. Cell passaging and cryopreservation was performed as with C2C12s. To induce myogenic differentiation, cells were cultured to confluency, and then incubated for one week without changing medium. Throughout the study, cells were counted as with C2C12s.
2.3. Immunofluorescence and cell characterization
To confirm the identity of isolated primary BSCs, cells were stained for Pax7 and Myosin Heavy Chain (MHC) before and after differentiation, respectively. These markers confirm the primary and terminal states of satellite cell myogenesis and therefore act to verify the nature and myogenicity of isolated cells. Proliferative cells and cells after one week of differentiation were fixed with 4% paraformaldehyde (ThermoFisher #AAJ61899AK) for 30 minutes, washed in PBS, permeabilized for 15 minutes using 0.5% Triton X (Sigma # T8787) in PBS, blocked for 45 minutes using 5% goat serum (ThermoFisher #16210064) in PBS with 0.05% sodium azide (Sigma #S2002), and washed with PBS containing 0.1% Tween-20 (Sigma #P1379). Primary Pax7 antibodies (ThermoFisher #PA5-68506) were diluted 1:100 in blocking solution and added to proliferative cells. Primary MHC antibodies (Developmental studies hybridoma bank #MF-20, Iowa City, IA, USA) were diluted to 4 μg/mL in blocking buffer containing 1:100 Phalloidin 594 (ThermoFisher #A12381) and added to differentiated cells. Primary antibodies were incubated overnight at 4°C. The following day, cells were washed with PBS + Tween-20, incubated with secondary antibodies for Pax7 (ThermoFisher #A-11008, 1:500) and MHC (ThermoFisher #A-11001, 1:1000) for 1 hour at room temperature, washed with PBS + tween-20, and mounted with Fluoroshield mounting medium with DAPI (Abcam #ab104139, Cambridge, UK) before imaging.
2.4. Molecular cloning and Sleeping Beauty construct design
Amino acid sequences for CrtB, CrtI, and CrtY from Pantoea ananatis were obtained from UniProt (accession numbers P21683, P21685 and P21687, respectively). Gene sequences for these proteins were optimized for expression in Bos taurus using codon optimization software (IDT, Coralville, IA). Self-cleaving 2A peptides were added to the ends of each gene to facilitate multi-cistronic expression, and all genes were flanked with multiple cloning sites(Szymczak et al., 2004). Final gene constructs were ordered through ThermoFisher’s GeneArt gene synthesis service (Table S1). Next, three Sleeping Beauty transposon vectors were constructed using synthesized genes and based on plasmids available through Addgene (Watertown, MA, USA): pCMV-GFP was a gift from Connie Cepko (Addgene #11153)(Matsuda and Cepko, 2004), pSBbi-GP and pSBbi-Pur were gifts from Eric Kowarz (Addgene #60511 & #60523)(Kowarz et al., 2015a), and pCMV(CAT)T7-SB100 was a gift from Zsuzsanna Izsvak (Addgene #34879)(Mátés et al., 2009). Transposon construction was performed using standard cloning techniques. Briefly, CrtB was cloned into pCMV-GFP using EcoRI-HF and Xmal restriction (NEB #R3101S & # R0180S, Ipswich, MA, USA) followed by T4 DNA ligation (NEB #M0202S) to generate pCMV-CrtB-P2A-eGFP, a plasmid for the transient bi-cistronic expression of CrtB and green fluorescent protein (GFP) under the cytomegalovirus (CMV) promoter. Next, the CMV-CrtB-P2A-GFP portion of this plasmid was cloned into pSBbi-Pur via Gibson assembly (SGI-DNA #GA1100, San Diego, CA, USA) while excising the backbone’s EF1α promoter in preference for the insert’s CMV promoter. This produced pSBbi-(CMV-CrtB-T2A-GFP)-pur, a Sleeping Beauty transposon vector carrying the same bi-cistronic CrtB and GFP expression cassette under the CMV promoter, as well as a puromycin resistance gene under a synthetic promoter oriented counter to CMV(Kowarz et al., 2015b). Subsequent Gibson assemblies inserted CrtI and CrtY into this vector to create three final Sleeping Beauty transposon carotenoid-producing vectors: pSBbi-(CMV-CrtB-T2A-)-pur (pCrtB), pSBbi-(CMV-CrtB-T2A-CrtI-P2A-GFP)-pur (pCrtB/I), and pSBbi-(CMV-CrtY-T2A-CrtB-T2A-CrtI-P2A-GFP)-pur (pCrtB/I/Y) (Figure 1). A control Sleeping Beauty transposon vector containing only GFP (pGFP) was generated by removing the carotenoid synthesis enzymes and 2A sequences from pCrtB/I/Y, leaving only the GFP under CMV promotion (Figure 1). All constructs were maintained in 5-alpha high-efficiency chemically competent E. coli (NEB #C2988J), verified with Sanger sequencing (Genewiz, Cambridge, MA, USA), and purified via GeneJet miniprep (ThermoFisher #K0503). For Gibson assembly, polymerase chain reactions were performed using Q5 high-fidelity polymerase (NEB #M0492S), run through 1% agarose gel-electrophoresis, and purified via GeneJet gel extraction (ThermoFisher #K0692).
Figure 1.
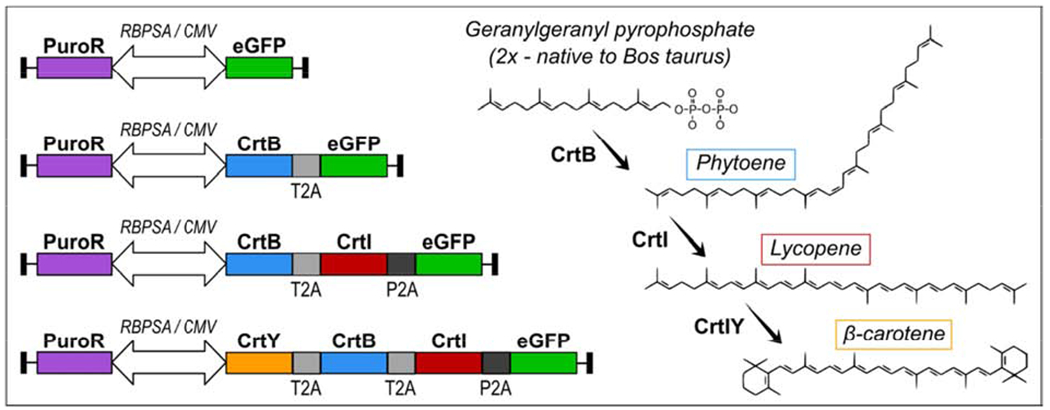
Gene constructs and their corresponding terminal product in the carotenoid biosynthesis pathway. All gene constructs contain a puromycin resistance gene and genes of interest simultaneously promoted by a bidirectional synthetic RBPSA/CMV promoter(Kowarz et al., 2015a). All gene of interest regions contain a green fluorescent protein (GFP) sequence produced in isolation or as part of a multi-cistronic mRNA transcript. The constructs are designated (from top to bottom) pGFP, pCrtB, pCrtB/I, and pCrtB/I/Y.
2.5. Transfection and selection
C2C12s and BSCs were cultured to 80-90% confluency in 6-well plates and transfected with Lipofectamine 3000 (ThermoFisher #L3000015) according to the manufacturer’s protocol adapted for simultaneous transfection of two plasmids. Briefly, 2.5 μg of the carotenoid producing vectors or the pGFP control vector were combined with 0.25 μg of pCMV(CAT)T7-SB100 in a solution of 250 uL Opti-MEM medium (ThermoFisher #31985088), 7.5 uL of Lipofectamine 3000 reagent, and 5 uL of p3000 reagent. This mixture was incubated at room temperature for 15 minutes. During incubation, cells were rinsed once with PBS and covered with 2 mL of Opti-MEM before adding lipofectamine mixtures. After 4 hours at 37°C, 2 mL of growth media was added to wells, and cells were incubated at 37°C overnight. The next morning, media was replaced with appropriate growth media, and cells were cultured for two days before observing GFP expression with a fluorescent microscope. After two days, media was changed to growth media with 2.5 μg/mL puromycin to begin selection. Over one week, cells were passaged, and media was replaced as necessary due to cell death from selection. Once cells were observed to stably express GFP, cultures were expanded and cryopreserved for later use. To determine transfection efficiency in C2C12s and BSCs, cells were transfected in triplicate, as described, with pGFP, pCrtB, pCrtB/I, and pCrtB/I/Y, as well as with 0.25 ug of pCMV(CAT)T7-SB100 alone as a negative control. Two days after transfection cells were harvested, washed once in PBS, and analyzed using a NucleoCounter NC-3000 advanced image cytometer (Chemometec, Allerod, Denmark), and following the GFP Transfection Efficiency Assay according to the manufacturer’s instructions and gating against pCMV(CAT)T7-SB100 control cells and previously puromycin-selected pGFP cells.
2.6. Growth and development of engineered cells
Growth of engineered BSCs and C2C12s was analyzed using a dsDNA quantitation kit (ThermoFisher #F2962) on days 1, 2, 4, 6, and 8 of culture. Cells were plated in 96-well plates for each time-point at a density of 1000 cells / well. At each time-point, media was removed from wells and plates were frozen at −80°C. After all time-points were frozen, plates were thawed to room temperature, and 100 uL of UltraPure water (ThermoFisher #10977023) was added to wells. Plates were incubated at 37°C for one hour, re-frozen to −80°C, and re-thawed to room temperature. Wells were stained with 100 uL of Hoechst 33258 working solution. Fluorescence was measured with a Synergy H1 microplate reader (BioTek Instruments, Winooski, VT, USA) using excitation and emission filters centered at 360 and 460 nm, respectively. In parallel, a 96-well plate was seeded with a range of known cell densities, incubated for 12 hours, and measured using the same protocol to obtain a standard curve and convert fluorescence values to cell number. To analyze the effect of transfection on cellular phenotype, BSCs transfected with pCrtB/I/Y were differentiated and stained for Pax7 and MHC as previously described, with the exception that red (594 nm) fluorophore-conjugated antibodies were used to detect both Pax7 (ThermoFisher #A-11072) and MF20 (Abcam #ab150116), and no cytoskeletal counterstain was performed.
2.7. Carotenoid extraction
Cells were cultured to confluency in 175 cm2 flasks, harvested, and counted using a hemocytometer. Collected cells (~3-10 million for BSCs, ~10-20 million for C2C12s) were washed 1X with PBS, resuspended in 1 mL of a 50:25:25 solution of hexane (Sigma #270504), acetone (ThermoFisher #A18-500), and ethanol (Sigma #459836), vortexed for one minute, and incubated on a shaker plate at room temperature for 30 minutes. After 30 minutes, 150 μL of deionized water was added, and suspensions were again vortexed for one minute. Solutions were centrifuged at 3,000 g for 5 minutes at 4°C, and the carotenoid-containing upper layer was collected in a Pyrex tube. Another 1 mL of hexane:acetone:ethanol solution was added to the remaining pellet, and the extraction was repeated, pooling the two carotenoid solutions in one tube. Extracts were dried at room temperature under flow of nitrogen gas, capped, and stored at −80°C before analysis with HPLC.
2.8. Quantitative HPLC
Carotenoids were analyzed via HPLC following published techniques on an Agilent 1200 system (Agilent Technologies, Santa Clara, CA, USA) with a C30 stationary phase (YMC #CT99S03-1546WT, 3 μm, 4.6 x 150 mm, Allentown, PA, USA) and mobile phase solvents A—methanol (ThermoFisher #A454-1) containing 1% ammonium acetate (ThermoFisher), and B—methyl-tert-butyl ether (MTBA, ThermoFisher #AC378720010)(Melendez-Martinez et al., 2013). Briefly, carotenoid extracts were suspended in 150 μL of ethanol, vortexed, and injected (50 μL) into the HPLC system. Mobile phase solvents were pumped through the system at 1 mL/min with the following time-dependent gradients: t=0 min, 95% A, 5% B; t=15 min, 85% A, 15% B; t=30-37 min, 40% A, 60% B; t=40-55 min, 30% A, 70% B; t=59-64 min, 90% A, 10% B; t=70min, 95% A, 5% B. Carotenoid standard curves were generated by dissolving (E/Z)-phytoene (Sigma #78903), lycopene (Sigma #SMB00706), and β-carotene (ThermoFisher #AAH6010603) standards in hexane at a concentration of ~0.5 mg/mL. Exact concentrations were determined spectrophotometrically (SpectraMax M2, Molecular Devices, San Jose, CA, USA) by measuring absorbances in 1 cm path-length quartz cuvettes at 286, 472, and 453 nm for phytoene, lycopene, and β-carotene, respectively, and calculating exact concentration using A1% = 915, 3450, and 2592 for phytoene, lycopene, and β-carotene, respectively. Standards were dried under nitrogen and stored at −80°C until analyzed with samples following serial dilution. As FBS can contain trace carotenoids (from animal feed), endogenously-produced carotenoid content was captured by subtracting the area under any peaks found in extractions from pGFP cells (which have no mechanism for producing carotenoids endogenously)(Chitchumroonchokchai et al., 2017). Pre-correction quantities, including for pGFP cells, can be seen in Supplementary Figures 2 and 3. If samples showed no peak or a negative calculated quantity (i.e., below the analytical sensitivity of the method), then carotenoid concentrations were set to zero and indicated in plots. If sample quantities were below the standard curve range, then quantities were calculated based on extrapolation of linear standard curves and indicated in plots. Final values were converted to ng/cells*106 before normalizing to cellular protein.
2.9. Protein quantification
To normalize cellular carotenoid content under more food-relevant metrics than cell number, cellular protein content was measured. Briefly, engineered cells were cultured as previously described, harvested, and counted. One million cells were pelleted, washed 1x in PBS, and treated with 100 uL of RIPA buffer (Thermo Fisher #89900) containing 1% Halt Protease Inhibitor Cocktail EDTA-Free (ThermoFisher #78425) according to the manufacturer’s instructions. Resulting cell lysates were analyzed via Pierce BCA protein assay (ThermoFisher #23225) according to the manufacturer’s instruction. Absorbance at 562 nm was compared to a standard curve of known bovine serum albumin (BSA) concentrations and used to determine cellular protein per million cells (Supplementary Figure 3). These values were then used alongside carotenoid quantification per million cells (Supplementary Figure 3) to obtain carotenoid content per protein mass.
2.10. Carotenoid optimization
Two methods were explored for optimizing carotenoid production in pCrtB/I/Y cells. The first focused on increasing gene expression by increasing puromycin selective pressure. The second focused on increasing levels of the carotenoid pathway precursor farnesyl pyrophosphate (FPP) by inhibiting downstream reactions in one of FPP’s alternative metabolic pathways—cholesterol synthesis—using the small molecule ketoconazole(Sun et al., 2007). By exploring these two approaches, the possibility for a single approach to fail to address a rate-limiting step in carotenoid production was reduced. Specifically, if FPP levels were completely limiting (i.e., there was enough enzyme to fully exhaust FPP levels), then increasing enzyme expression would fail to increase carotenoid levels. Similarly, if enzyme levels were completely limiting, then ketoconazole treatment would offer no increase in carotenoid production. To determine an appropriate puromycin concentration for increasing enzyme expression, engineered cells were cultured in media containing 2.5 μg/mL puromycin (1x puro), 5 μg/mL puromycin (2x puro) or 10 μg/mL puromycin (4x puro), and relative GFP expression was determined via flow cytometry as a proximate measure of enzyme expression. Briefly, cells were cultured, harvested, and GFP was analyzed using a BD FACSCalibur (BD Sciences) or Attune NxT (ThermoFisher) flow cytometer. Appropriate gating was performed using pGFP and unmodified cells as positive and negative controls, and mean fluorescent intensity was determined. Data were analyzed with the FlowJo software (v10). To determine an appropriate ketoconazole concentration for metabolic flux modulation, a growth curve was performed as previously described using a dsDNA quantitation kit and media treated starting on day 1 with 0, 2.5, 5, 10, or 20 μg/mL ketoconazole (KTZ, ThermoFisher #455470010) dissolved in DMSO. Final DMSO concentration was held constant (0.3%) in all conditions. Growth curves were performed in pCrtB/I/Y cells conditioned with 1x puro and 4x puro to confirm that Puromycin conditioning also did not significantly impact cell growth in the presence or absence of ketoconazole. Following the determination of appropriate concentrations of puromycin and ketoconazole for carotenoid optimization, pCrtB/I/Y cells were cultured in media containing 1x puro plus 5 μg/mL ketoconazole, 4x puro without ketoconazole, or 4x puro plus 5 μg/mL ketoconazole, and carotenoid analysis was performed as previously described.
2.11. Lipid oxidation
To analyze the antioxidant functionality of carotenoids in cells, a thiobarbituric acid reactive substances (TBARS) assay was performed. This assay measures malondialdehyde (MDA), a byproduct of unsaturated fatty acid oxidation, and so serves as a measure of lipid oxidation in cells. As lipid oxidation is often catalyzed by the processes that generate oxidative pressure, such as storage and cooking of meat, the TBARS assay was performed on cells after one day and eight days of refrigeration (4°C), and on both “raw” cells, and cells that had been heated to mimic cooking. Briefly, engineered BSCs (including optimized BSCs treated with 4x puromycin and ketoconazole) were cultured as previously described, harvested, and counted. Aliquots of 1.5 million cells were transferred to tubes, washed 1x in PBS, pelleted, and the supernatant PBS was removed. Collected cell pellets were stored overnight or for eight days at 4°C. After storage, samples designated for heating were incubated for 10 minutes in a 100°C heat block, cooled to room temperature, and placed on ice. Unheated samples were transferred directly to ice. All cells (heated and unheated) were suspended in 500 μL of PBS, incubated for 2 hours on ice, and sonicated on ice using a probe sonicator (Branson, St. Louis, MO, USA) at 15% intensity for 5x 15 second pulses, with 20 second intervals between pulses. Next, the TBARS assay (Cayman Chemical #700870, Ann Arbor, MI, USA) was performed with 100 μL of sonicated cell lysates, following the manufacturers protocol and determining MDA by measuring absorbance at 535 nm compared to a standard curve of known MDA concentrations. The remainders of the cell lysates were frozen at −80°C until protein quantification was performed via Bradford assay (ThermoFisher #23200) following the manufacturers protocol. Briefly, 5 μL of cell lysates were incubated for 10 minutes with 250 uL of Coomassie reagent, and the absorbance was measured at 595 nm and compared to a BSA standard curve. TBARS measurements were normalized with protein content for each sample in order to obtain corrected cellular MDA (mg/g protein).
2.12. Statistical analysis
Statistical analysis was performed with GraphPad Prism 8.0 software (San Diego, CA, USA). Carotenoid content, flow cytometry, and ketoconazole growth were analyzed via one-way ANOVA. Growth curves and TBARS assays were analyzed via two-way ANOVA. Multiple comparisons of all analyses were performed with Tukey’s HSD post-hoc test. In converting carotenoid and MDA quantification to per-protein values, propagation of error was considered using σ_(A/B) = (A/B)√((σ_(A/A)^2+(σ_(B/B)^2), where σ_A is the standard deviation of the data A. P values <0.05 were treated as significant. Outlier detection was performed by Grubb’s test with an alpha of 0.01. Unless otherwise stated, errors are given as ± standard deviation.
3. Results and discussion
3.1. Primary bovine skeletal muscle stem cells
Immunofluorescent staining for early markers of satellite cell identity and terminal markers of myogenic differentiation were used to characterize primary bovine satellite cells (BSCs). Proliferative cells showed ubiquitous staining for Pax7, the key marker of muscle stem cells and the satellite cell phenotype (Figure 2a), indicating that the cell isolation protocol was successful in generating a highly consistent population of myogenic stem cells(Seale et al., 2000). Following one week of differentiation, cells stained for myosin heavy chain (MHC) showed long, multinucleated myotubes (Figure 2b). Actin and MHC staining of these myotubes revealed striated architecture indicative of sarcomere formation, and the presence of a contractile apparatus was further supported by the observation of spontaneous contractions in differentiated cultures (Movie S1). Together, these data indicate the isolation of a highly myogenic population of bovine skeletal muscle precursors, and the ability of these cells to undergo robust differentiation in vitro.
Figure 2.
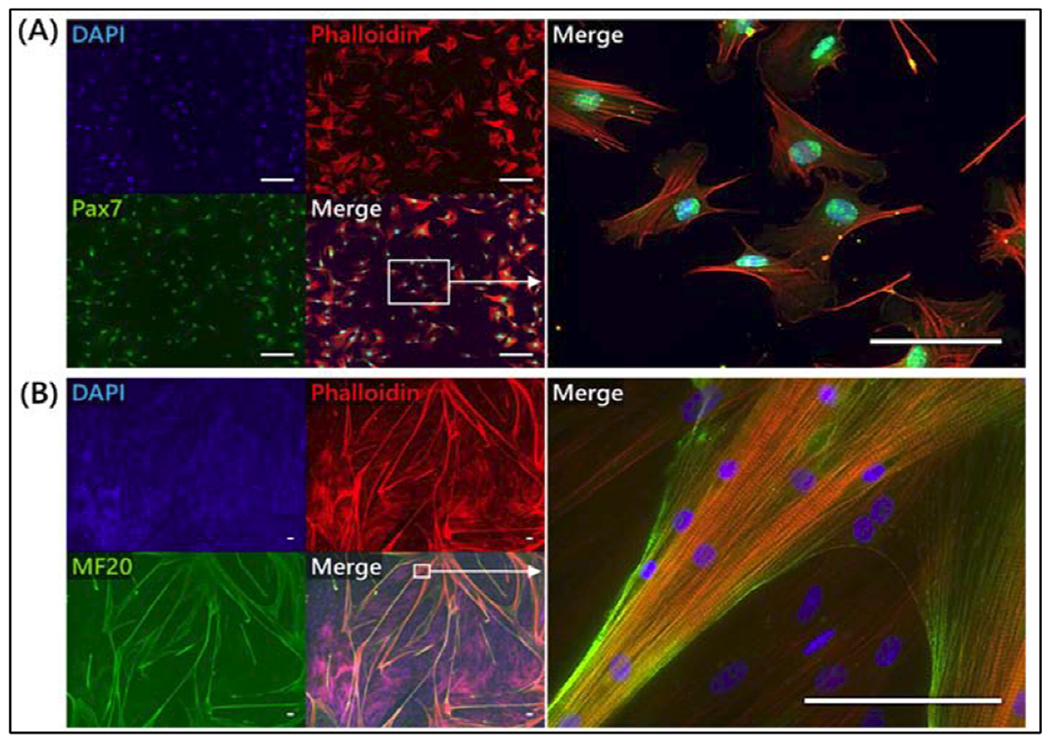
Bovine satellite cell characterization. (A) Immunofluorescent staining for Pax7 (green), a transcription factor and satellite cell marker, along with counter-stains for cellular actin (Phalloidin (red) and nuclei (DAPI, blue). (B) Immunofluorescent staining for myosin heavy chain (MF20, green), a contractile protein of skeletal muscle, along with counter-stains for cellular actin and nuclei. High-objective staining of differentiated cells reveals striated patterns in both actin and myosin heavy chain, indicating skeletal muscle sarcomere formation. Scale bars are 100 μm.
3.2. Stable transgene expression in cells
BSCs and C2C12 immortalized mouse precursor cells were engineered with multicistronic vectors for producing a range of protein conversations. These were green fluorescent protein (GFP) alone (pGFP) which did not produce any carotenoids, CrtB and GFP (pCrtB) which could produce phytoene, CrtB, CrtI and GFP (pCrtB/I) which could produce phytoene and lycopene, or CrtB, CrtI, CrtY and GFP (pCrtB/I/Y) which could produce phytoene, lycopene and β-carotene (Figure 1). The multi-cistronic nature of these vectors allowed the use of GFP expression as an indicator of vector integration and gene expression. Specifically, 2A sequences between genes allowed for near stoichiometric expression of enzymes and GFP(Szymczak et al., 2004). After transfection followed by one week of selection in puromycin-containing media, cells stably expressed their respective gene cassettes, as was visible through GFP fluorescence (Figure 3a). Fluorescence intensity was heterogenous, which was likely due to the randomness of transposition. No obvious morphological differences were seen between control pGFP cells and cells expressing carotenoid-synthesis enzymes.
Figure 3.
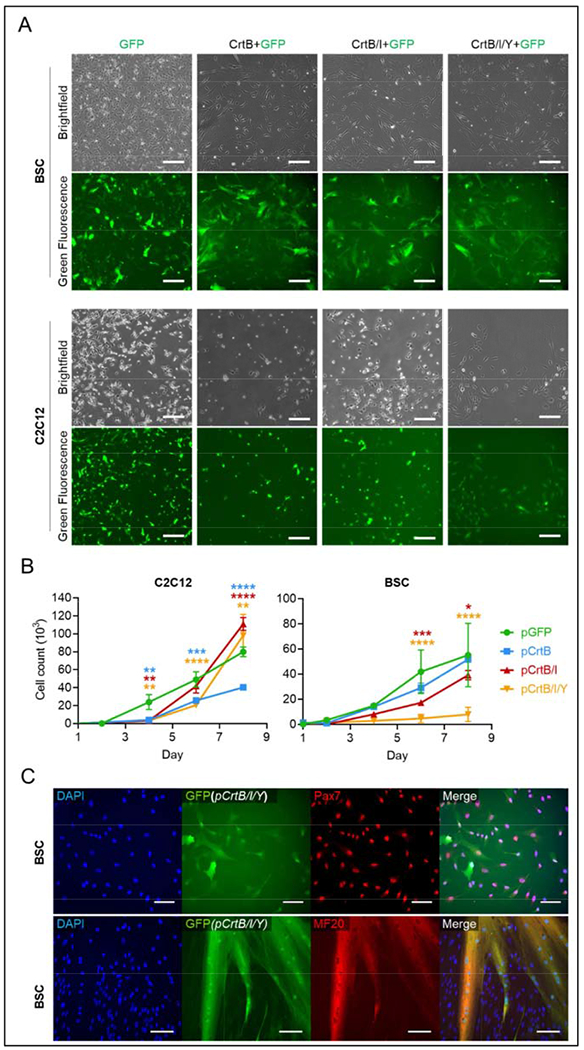
Engineered cell growth and development. (A) Brightfield and fluorescence images of GFP expression in C2C12s and BSCs engineered with all four constructs (carotenoid-producing and control). GFP expression implies successful expression of other enzymes in gene constructs, due to the structure of the constructs. Scale bars are 200 μm (B) Growth curves C2C12s and BSCs engineered with all four constructs over eight days. n = 3 distinct samples; statistical significance was calculated by two-way ANOVA comparing carotenoid-producing cell growth with GFP-producing control cells, and is indicated by asterisks, in which p < 0.05 (*), p <0.01 (**), p < 0.001 (***), and p < 0.0001 (****). (C) Immunofluorescent staining for Pax7 (red) and Myosin Heavy Chain (red) in pCrtB/I/Y BSCs before (top) and after (bottom) differentiation. Counterstains for DAPI (blue) show nuclei, and endogenous GFP (green) show cell morphology. Scale bars are 100 μm.
3.3. Growth and development of engineered cells
As antioxidants are known to affect muscle progenitor proliferation, cells producing all three carotenoids were analyzed for growth-rate over eight days(Le Moal et al., 2017). For BSCs, the size of the inserted gene construct was negatively associated with growth rate (Figure 3b). In contrast, C2C12s engineered with the two largest compounds (pCrtB/I and pCrtB/I/Y) showed higher growth over eight days than cells engineered with pGFP or pCrtB. It is possible that differences in response to puromycin treatment and intracellular carotenoid accumulation account for growth differences seen between primary bovine cells and immortalized mouse cells. However, this discrepancy could also be affected by the impact that insertion efficiency and subsequent selection has on primary cells, but not immortalized cells. Namely, cells transfected with larger constructs have a lower insertion efficiency (Supplementary Figure 1), and so require more doublings to generate an equally large population of engineered cells(Izsvák et al., 2000). In primary cells, growth is reduced with increased doublings, and eventually cellular senescence is reached(Ding et al., 2018). In immortalized cells, however, doublings do not hinder growth. Rather, antioxidant capacity has been shown to increase cellular proliferation(Le Moal et al., 2017), and immortalized cells with increased antioxidant capacity—pCrtB/I and pCrtB/I/Y cells—showed improved growth compared to controls. It is possible that immortalized bovine cells would show similar relative kinetics.
To determine whether genetic modification affected myogenic potential, Pax7 and MHC staining was performed on pCrtB/I/Y BSCs (Figure 3c). Staining showed maintenance of Pax7 expression and MHC-positive myotube formation. No striations were observed in differentiated cells, which could indicate less robust differentiation compared to non-engineered cells as a result of the engineering process or due to the sensitivity of myogenic differentiation to redox balance, and the associated effects of endogenous antioxidant production(Lee et al., 2011; Piao et al., 2005). Still, the ability of cells to form myotubes suggests the potential for these cells to generate differentiated cultured meat products. Together, these data point to the ability of cells to maintain their capacity for proliferation and differentiation following modification with carotenoid-synthesizing enzymes; however, this capacity may be reduced in primary cells.
3.4. Carotenoid production by engineered cells
Quantitative HPLC confirmed the de novo production of phytoene in pCrtB cells, phytoene and lycopene in pCrtB/I cells, and phytoene, lycopene and β-carotene in pCrtB/I/Y cells. In all cells, carotenoids accumulated in the terminal compound though precursors (i.e., phytoene and lycopene in pCrtB/I/Y cells) were present, indicating high but non-exhaustive conversion efficiency throughout the pathway (Figure 4A & B, Supplementary Figures 2 and 3). In pCrtB/I cells, most of the endogenously produced phytoene was converted to lycopene, with high conservation of total carotenoid content compared with cells only producing phytoene. In pCrtB/I/Y cells, carotenoids accumulated in the terminal compound (β-carotene), though yields were significantly reduced compared to pCrtB or pCrtB/I cells. C2C12s produced more carotenoids for all three constructs than BSCs. Total endogenous carotenoids in C2C12 pCrtB, pCrtB/I, and pCrtB/I/Y were 675.6, 308.2, and 85.71 μg/g protein, respectively. For BSCs, these were 27.8, 32.3, and 3.7 μg/g protein, respectively. The significant reduction in total carotenoid content in BSCs compared to C2C12s and pCrtB/I/Y cells compared to pCrtB or pCrtB/I cells could be due to increased cellular burdens of selection and protein production and/or the degradation of β-carotene with endogenous enzymes(Geurts et al., 2003; Lindqvist et al., 2005). While no explicit carotenoid target was set for this study, β-carotene production in pCrtB/I/Y BSCs (2.08 ug/g protein) was deemed to be insufficient, as it was no higher than literature values for β-carotene present in conventional beef (1.6-2.9 ug/g protein), where carotenoids are accumulated from animal diets(Simonne et al., 1996). As such, endogenously produced carotenoids in cultured meat would offer no nutritional advantage over conventional meats, and so yield optimization was necessary to achieve a truly nutritionally enhanced product.
Figure 4.
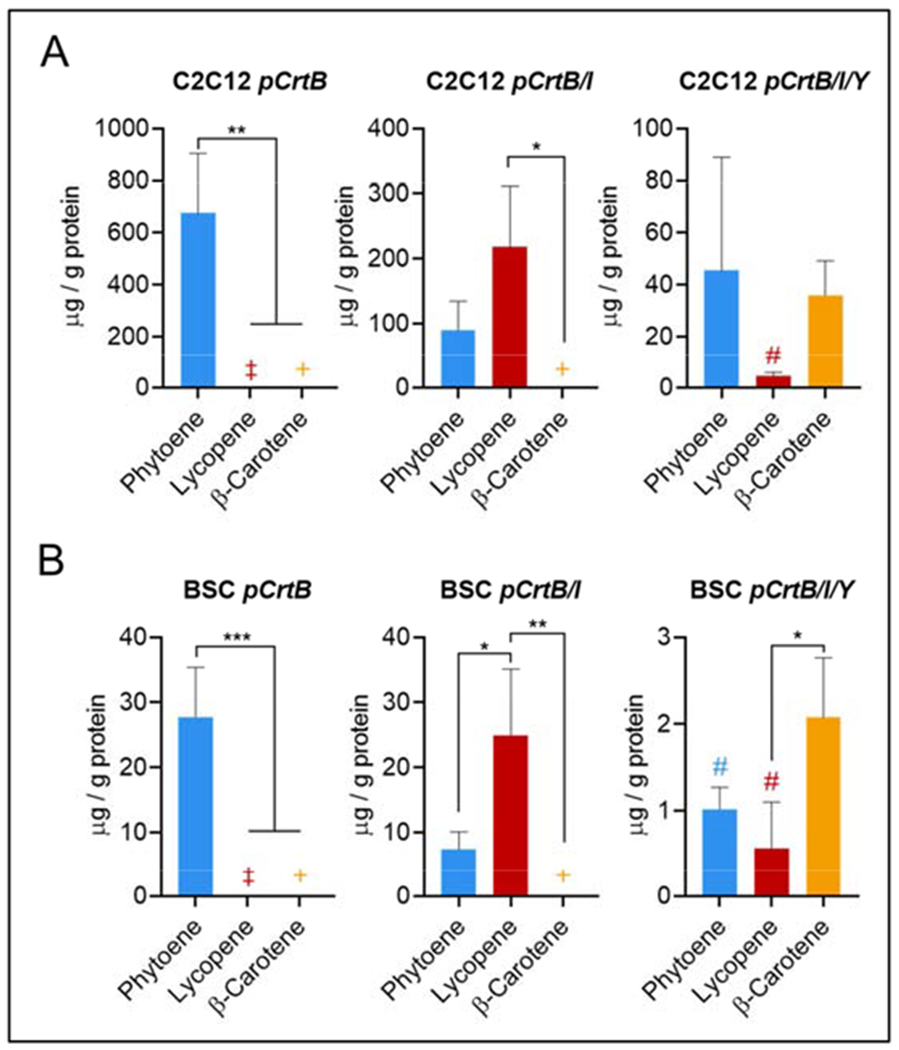
Endogenous carotenoid production in engineered cells. Carotenoid production in engineered cells. (A) Carotenoid production in C2C12s engineered with pCrtB, pCrtB/I, and pCrtB/I/Y. In pCrtB cells, only phytoene is produced (675.6 μg/g protein). In pCrtB/I cells, most of the phytoene is converted to lycopene (phytoene = 90.1 μg/g protein and lycopene = 218.1 μg/g protein). In pCrtB/I/Y cells, carotenoids accumulate in β-carotene, though total carotenoid levels are notably reduced compared to pCrtB and pCrtB/I (phytoene = 43.4 μg/g protein, lycopene = 4.4 μg/g protein, and β-carotene = 35.9 μg/g protein). (B) Carotenoid production in BSCs engineered with pCrtB (phytoene = 27.8 μg/g protein), pCrtB/I (phytoene = 7.4 μg/g protein and lycopene = 24.9 μg/g protein), and pCrtB/I/Y (phytoene = 1.0 μg/g protein, lycopene = 0.5 μg/g protein, and β-carotene = 2.1 μg/g protein). Trends follow those of C2C12s, with a ~10-fold reduction in total carotenoid content in all cases compared with C2C12s. n = 3 distinct samples for all plots; statistical significance was calculated by one-way ANOVA, and is indicated by asterisks, in which p < 0.05 (*), p <0.01 (**), p < 0.001 (***), and p < 0.0001 (****). ‡ indicates that no peak was detected; + indicates that values were outside of analytical sensitivity (calculations returned negative quantities); and # indicates that values were calculated using a linear extrapolation of the linear calibration curve. Carotenoid data is provided as μg/g protein. Data is corrected against exogenous carotenoids accumulated in control pGFP cells. Pre-correction carotenoid data and individual values for comparing carotenoids to protein are given in Supplementary Figures 2 and 3.
3.5. Optimization of carotenoid production
Due to the relatively low carotenoid production in BSCs compared to C2C12s and pCrtB/I/Y cells compared to pCrtB or pCrtB/I cells, we hypothesized that production in these cells could be significantly improved. We explored two methods to achieve this. In the first, enzyme expression was increased by increasing selective pressure for transgenes. Puromycin was shown to induce a significant increase in GFP expression per cell at 4x concentration (10 μg/mL) for both C2C12s and BSCs without significantly affecting cell growth (Supplementary Figure 4), so this concentration was used for optimization. In the second method, carotenoid precursor accumulation was induced by inhibiting cholesterol synthesis—which competes for carotenoid precursors—using the small molecule ketoconazole (Figure 5a)(Sun et al., 2007). A ketoconazole concentration of 5 μg/mL was found to not significantly affect growth in C2C12s and BSCs (Supplementary Figure 4), so this concentration was used.
Figure 5.
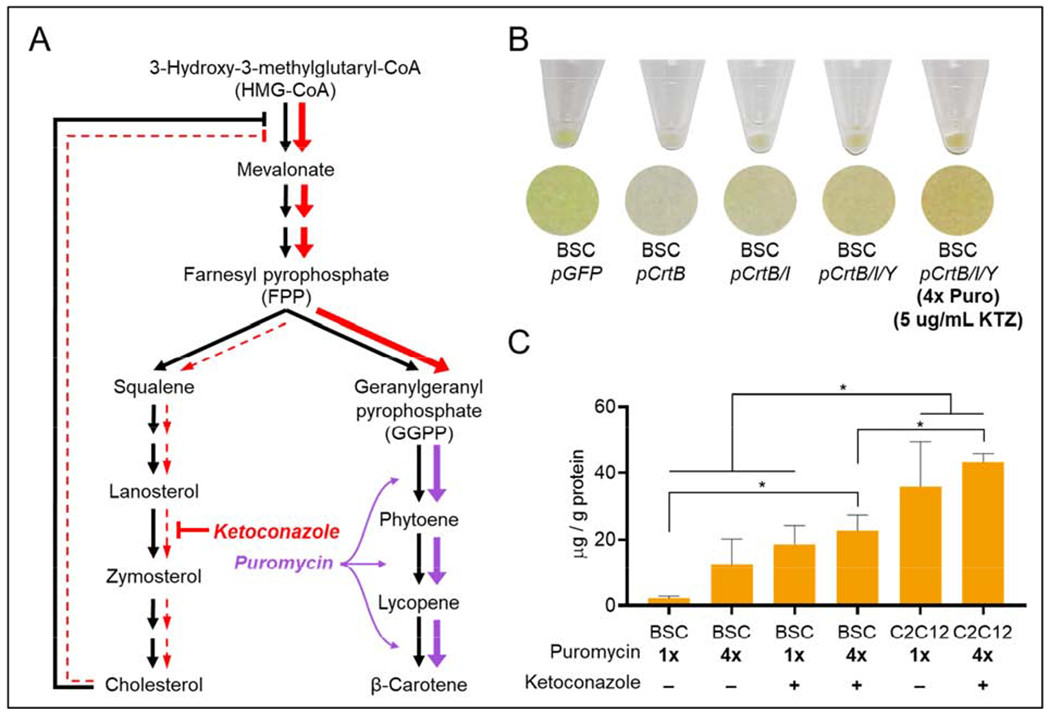
Carotenoid optimization. (A) the carotenoid biosynthesis pathway in its context as a shared pathway for precursors in cholesterol synthesis. The possible mechanisms for optimization are shown, where colored arrows indicate where ketoconazole (red) or puromycin (purple) individually affect metabolic flux, and where colored arrow thickness is qualitatively indicative of changes in flux (i.e., thicker colored arrows indicate a hypothetical increase in flux as a result of the corresponding treatment, and thinner, dotted arrows indicate a hypothetical decrease in flux (or inhibition) as a result of the corresponding treatment. Puromycin (purple) acts by selecting cells that offer higher enzyme expression, and therefore increased gene expression and flux in carotenoid synthesis. Ketoconazole (red) acts by inhibiting the conversion of lanosterol to zymosterol, increasing carotenoid precursor farnesyl pyrophosphate (FPP) levels by either causing the upstream accumulation of lanosterol, squalene, and FPP (i.e., reducing flux down the left-hand side of the FPP → cholesterol pathway), or by reducing cholesterol’s impact as a feedback inhibitor of upstream FPP synthesis reactions (i.e., reducing inhibition of HMG-CoA → Mevalonate synthesis, thus increasing flux in the upper portion of this pathway diagram). (B) Cell pellet images of engineered BSCs. The color effect of carotenoids can be seen, with pGFP cells slightly green, pCrtB containing no pigment, and pCrtB/I and pCrtB/Y cells containing some orange pigment. Optimized pCrtB/I/Y cells are notably more orange, indicating an increase in carotenoid levels. (C) Quantitative HPLC of β-carotene in optimized cells. In BSCs, ketoconazole and puromycin conditioning offer an additive increase in β-carotene. In C2C12s, ketoconazole and puromycin together do not significantly increase β-carotene. n = 3 distinct samples; statistical significance was calculated by one-way ANOVA, and is indicated by asterisks, in which p < 0.05 (*). Carotenoid data is provided as μg/g protein. Data is corrected against exogenous carotenoids accumulated in control pGFP cells. Precorrection carotenoid data and individual values for comparing carotenoids to protein are given in Supplementary Figures 2 and 3.
To test how these treatments affected carotenoid production separately and in concert, pCrtB/I/Y BSCs were cultured with 1x puromycin +/− ketoconazole and 4x puromycin +/− ketoconazole. A clear increase in orange pigmentation was observed in cells cultured with 4x puromycin + ketoconazole (Figure 5b), and quantitative HPLC showed a significant increase in β-carotene production for these cells (Figure 5c). Specifically, optimized BSCs produced 10-times more β-carotene than unoptimized BSCs (22.6 vs. 2.08 μg/g protein, respectively). In comparison with the low levels in unoptimized CrtB/I/Y BSCs previously mentioned, optimized levels were ~7 times greater than literature values for β-carotene (in ug/g protein) in beef from pasture-raised cattle (1.6 ug/g protein), and ~14 times greater than beef from feedlot-raised cattle (2.9 ug/g protein) (Simonne et al., 1996). Ketoconazole treatment appears to be the primary driver of optimization, though puromycin conditioning seems to contribute as well. Here, the fact that puromycin conditioning did not greatly affect the percent of GFP-positive cells (Supplementary Figure 5) but did significantly affect gene expression per cell (Supplementary Figure 4) indicates that the driving factor is indeed enzyme levels per cell, rather than population effects. After optimization in BSCs, the best-performing treatment (4x puromycin + ketoconazole) was then used to optimize pCrtB/I/Y C2C12s. The mean β-carotene concentration for un-optimized and optimized C2C12s was 35.9 and 43.0 μg/g protein, respectively, though this difference was not statistically significant. Here, in contrast to BSCs, the fact that puromycin conditioning affected both the level of gene expression per cell (Supplementary Figure 4), and the number of stably-engineered C2C12s (Supplementary figure 5) makes it difficult to conclusively determine the role of puromycin conditioning in these cells. Analysis of the full carotenoid profiles of optimized BSCs and C2C12s revealed that the trend of accumulation in the terminal compound (β-carotene) held true in all cases (Supplementary Figure 6).
The ability of both enzyme and precursor enhancement to increase carotenoids suggests that both enzyme and precursors are limiting in the system, which is likely due to the heterogenous nature of enzyme expression in cells. Specifically, in cells with high baseline enzyme levels, precursors are rate-limiting, and in cells with low baseline enzyme levels, enzyme capacity is rate-limiting. The efficacy of both optimization techniques suggests the utility of pursuing multiple avenues for optimization when engineering cultured meat. While the use of ketoconazole as a means of inducing precursor accumulation was useful for this proof-of-concept, a production-scheme for nutritionally enhanced cultured meat would likely rely on genetic strategies to achieve the same effect.
3.6. Lipid oxidation and antioxidant functionality
The capacity for endogenous carotenoids to offer nutritional and food function was determined to be the primary measure of engineering success and nutritional enhancement in this project. Specifically, lipid oxidation is a key mechanistic link between red or processed meat consumption and colorectal cancer, as well as a major cause of non-microbial meat quality degradation during storage (Falowo et al., 2014; Wolk, 2017). We therefore analyzed cellular malondialdehyde (MDA) levels by thiobarbituric acid reactive substance (TBARS) assay in order to probe the ability of endogenous carotenoid antioxidants to reduce lipid oxidation in vitro, both before and after refrigerated storage, and in both “raw” unheated cells, and in “cooked” heated cells (Figure 6). In pGFP BSCs, unheated and heated samples showed 2.2 and 4.9 mg MDA/g protein, respectively after one day of storage, and 2.1 and 8.0 mg MDA/g protein, respectively after eight days of storage, indicating a significant effect of heating methods in promoting lipid oxidation, and of storage in promoting lipid oxidation of cooked samples. BSCs engineered with pCrtB showed an increase in lipid oxidation compared to pGFP controls for unheated samples after one day of storage, though no significant effect on one-day lipid oxidation after heating (Figure 6a). More, after eight days of storage, pCrtB no longer increased lipid oxidation in unheated cells, and significantly reduced lipid oxidation in heated samples (Figure 6b). All cells engineered with pCrtB/I and pCrtB/I/Y showed significant reductions in lipid oxidation compared controls in both unheated and heated samples, and after both one day and eight days of storage.
Figure 6.
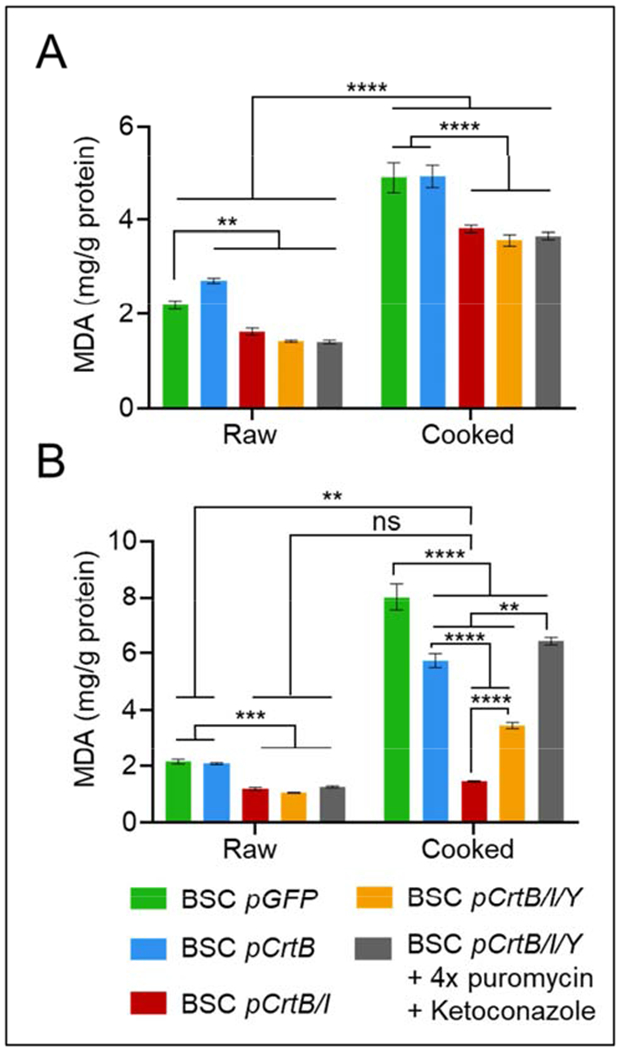
Thiobarbituric acid reactive substances (TBARS) assay for engineered BSCs. A) samples stored for one day at 4°C and with or without heating. pCrtB expression increases or does not affect lipid oxidation compared with pGFP controls, while BSCs expressing pCrtB/I and pCrtb/I/Y significantly reduce lipid oxidation both with and without heating. B) samples stored for eight days at 4°C and with or without heating. pCrtB expression does not affect or decreases lipid oxidation compared with controls, and pCrtB/I and pCrtB/I/Y significantly reduce lipid oxidation both with and without heating. Carotenoids in pCrtB/I cells are able to completely recover pre-challenge (before storage and/or heating) lipid oxidation levels of all cell types. n = 3 distinct samples for both plots; statistical significance was calculated by two-way ANOVA, and is indicated by asterisks, in which p < 0.05 (*), p <0.01 (**), p < 0.001 (***), and p < 0.0001 (****).
It is notable that cells with lycopene and/or β-carotene offered more antioxidant capacity than cells with phytoene alone, despite total carotenoid levels being highest pCrtB cells. This could be due to the varying antioxidant capacity of these carotenoids, with phytoene offering the least(Martínez et al., 2014). Also of note is the fact that optimized pCrtB/I/Y cells offered reduced antioxidant capacity in heated samples after eight days of storage compared to un-optimized pCrtB/I/Y cells, despite offering significantly higher carotenoid concentrations. This could have to do with the impact of optimization (i.e., puromycin and/or ketoconazole) on oxidative processes or on the levels of other cellular antioxidants. For instance, cholesterol—the synthesis of which is inhibited by ketoconazole—can improve membrane antioxidant capacity, so its inhibition with ketoconazole could confound the effects of increased carotenoid production(López-Revuelta et al., 2006). It would therefore be worthwhile to measure total oxidation (including protein) to decouple the role of ketoconazole in affecting cholesterol-associated membrane lipid stabilization. That said, the simplicity and ubiquity of TBARS assays for meat science applications make this technique highly relevant, and the significant reduction in lipid oxidation for all samples containing endogenously produced lycopene and/or β-carotene indicates that these nutrients would offer significant impact to nutrition and food-quality of engineered cultured meat products. Specifically, lycopene-producing pCrtB/I BSCs were able to rescue pre-challenge lipid oxidation levels after storage and cooking (one-day and eight-day non-heated pCrtB/I BSC levels are 1.6 and 1.2 mg MDA/g protein, respectively, and eight-day heated pCrtB/I BSC levels are 1.4 mg MDA/g protein). This points to a promising technique for meaningfully improving cultured meat nutrition via endogenous carotenoid production.
4. Conclusions
Metabolic engineering efforts in plants, yeast and bacteria have exploited numerous pathways from across taxonomies towards diverse applications (Heider and Wendisch, 2015; Nielsen, 2015; Sack et al., 2015). That same breadth has not yet been realized in mammalian systems, where the majority of efforts have focused on biopharmaceuticals(Ceroni and Ellis, 2018; Davy et al., 2017). While these efforts are by no means inferior to those in other systems, the difference in scope is stark. To date, this discrepancy is likely due at least in part to the lack of a compelling case for engineering animal cells with metabolic pathways from other taxonomies; from a bioprocess standpoint, the production of recombinant proteins, small molecules and biofuels is cheaper in bacteria, yeast or plant systems, and only the need for species-specific post-translational modifications makes mammalian bioprocesses preferable(Davy et al., 2017; Giddings, 2001). The possibility of cultured meat offers a new framework for mammalian metabolic engineering. In cultured meat production, the product is the cells themselves, and so endogenously synthesizing additional compounds becomes a purely additive endeavor, at least insofar as those efforts are biologically possible and do not hinder the bioprocess parameters or product value. Here, the fact that cultured meat is dependent only on cell growth rather than whole-animal viability—which is inherently limiting for animal transgenics—allows the consideration of an even wider range of metabolites which might be untenable in animals but harmless or even beneficial in cell culture.
In this work, we demonstrate the possibility of generating nutritionally enhanced meat products through cell culture by engineering the endogenous production of non-native dietary carotenoids into primary bovine and immortalized murine skeletal muscle cells. While past speculation has suggested the nutritional enhancement of cultured meat through exogenous nutrient addition, the endogenous production of nutrients could be advantageous from a bioprocess perspective at scale, and from the positive implications that endogenous nutrients could have for nutrient bioavailability or growth kinetics(Desmarchelier and Borel, 2017; Le Moal et al., 2017). We show that carotenoids are produced at levels capable of significantly reducing lipid oxidation, are optimizable through a range of strategies, and that optimized levels are substantially higher than those found to accumulate in beef. These compounds, along with their general nutritive value and specific relevance to meat-associated disease, offer functionality in their ability to combat lipid oxidation’s role in impairing shelf-life, color stability, and flavor. They are therefore compelling candidates for a proof-of-principle of how metabolic engineering can affect numerous meat quality metrics.
Additionally, the positive impact that carotenoid synthesis showed on C2C12 growth suggests an exciting commensurate benefit to this approach. Namely, the improvement of cell growth could help to substantially lower the cost of production for cultured meat while simultaneously generating a more nutritious product. A limitation of this study was the dependence on primary bovine satellite cells, as immortalized bovine cells would have enabled the exploration of this possibility in a more meat-relevant cell line uncoupled from the confounding impacts of primary cell senescence. Further, an immortalized cell line would have allowed for the use of less-efficient targeted gene insertion techniques (such as CRISPR/Cas9), which would have enabled the production of a homologous cell population that could more clearly elucidate achievable carotenoid yields before and after optimization. An industrial cultured meat production scheme would likely use targeted engineering of immortalized cells and avoid antibiotic selection, so follow-up exploration of carotenoid synthesis in one-such cell population would be valuable.
From consumer acceptance perspective, it has yet to be seen how genetic engineering in a cultured meat context will be received. On one hand, consumer aversions to genetically modified (GM) foods often align with their aversions to cultured meat (e.g., perceived unnaturalness, neophobia, and distrust of science), which could suggest that GM cultured meat would compound consumer aversion(Tuorila and Hartmann, 2020; Wilks et al., 2019). On the other hand, this similarity could instead suggest that that consumers who would be put off by genetic modifications are already less likely to consume cultured meat at all, and so the overlap would less severely affect likely consumers. Another factor in consumer apprehension towards cultured meat stems from concerns around the nutritional content of cultured meat(Bryant and Barnett, 2018). As such, it is possible that a nutritionally enhanced product could improve consumers’ willingness to purchase. A recent prospective study (currently in preprint) showed that, indeed, nutritional enhancement improves consumer perceptions of cultured meat as healthy, disease-preventing, and beneficial for society, though improvements in general attitude were not statistically significant (p = 0.067), and perceptions about sensory properties were reduced(Baumann and Bryant, 2019). This study did not touch on genetic modification, which could affect participant responses, though studies on GM foods outside of the context of cultured meat have shown increased willingness to purchase for nutritionally enhanced products(Canavari and Nayga, 2009). Ultimately, more research is required to determine the impact that genetic engineering could have on consumer acceptance of nutritionally enhanced cultured meats. From a regulatory standpoint, genetic engineering for cultured meat is equally uncertain. GM regulation varies significantly between governments, and while regulation of cultured meat products is still in development, it will likely face similar geographic diversity. How these regulatory frameworks interact is yet to be seen; however, the recent approval of GM salmon by the US Food and Drug Administration (FDA) and the recent commitment by the FDA and the US Department of Agriculture (USDA) to jointly regulate cultured meats point to a potential path towards regulatory approval of GM cultured meats(FDA, 2019, 2017).
Future work should explore the range of possibilities that follow this proof-of-concept. First, additional optimization of this system can be explored in a number of ways. Alternate engineering strategies (such as targeted engineering and the use of immortalized bovine cells) can be explored as previously mentioned, and additional carotenoids and nutrients can be explored. At the same time, specific control over individual enzyme levels (in contrast to the stoichiometric expression pursued here) and genetic control of upstream or downstream metabolic processes could further optimize yields or tune them towards specific nutrient profiles. Beyond carotenoids and nutritional enhancement of cultured meat, this work lays the foundation for broad application of cross-taxa metabolic engineering of mammalian in both food and nutrition, as well as medical applications. From a food standpoint, the production of flavor or aromatic compounds could impact sensory aspects of cultured meat. Further, the endogenous production of therapeutic compounds could enable the production of “therapeutic foods,” which would offer an entirely novel form of oral (food-based) drug delivery which could hold significant implications for drug absorption, patient compliance, cost savings for consumers and drug activity. Finally, within the medical realm, antioxidants have been shown to improve stem cell fate with potential applications for diabetic wound healing or treating various retinopathies(Wang et al., 2016; Zhang et al., 2014). These studies have focused on endogenous native or exogenous synthetic antioxidants, but the endogenous production of natural, non-native antioxidants from diverse species expands possible targets and could enable novel approaches to gene therapy or regenerative medicine. Ultimately, we expect that the cross-taxa metabolic engineering of mammalian cells, as demonstrated in this paper, could hold diverse applications across disciplines.
Supplementary Material
Highlights.
Meat production via cell culture can enable tight product composition control.
Phytonutrient production in muscle cells can improve cultured meat nutrition.
Carotenoids phytoene, lycopene, and β-carotene are promising engineering targets.
Carotenoid production was achieved at sufficient levels for antioxidant function.
Tissue-engineered food offers new application for mammalian metabolic engineering.
Acknowledgements
We thank New Harvest for their support of this work. We also thank Jessica Krieger of Dr. Min-Ho Kim’s Innate Immunity and Tissue Engineering Laboratory, Kent State University, for her insight into cell isolation protocols, John Yuen and Natalie Rubio for their assistance with the satellite cell isolations, and Scott Brundage for his help obtaining bovine tissues. Thanks Natalie Rubio, John Yuen, and Kyle Fish for their scientific input. Lastly, thanks to Dr. Xiang-Dong Wang and Connie Hu of the Jean Mayer USDA Human Nutrition Research Center on Aging for their advice regarding carotenoid analysis, and Dr. Burcin Yavuz for help with HPLC measurements.
Funding
This work was supported by the New Harvest Graduate Fellowship Program, the National Institutes of Health (P41EB002520), the and the National Institutes of Health Research Infrastructure grant (S10 OD021624).
Footnotes
Publisher's Disclaimer: This is a PDF file of an unedited manuscript that has been accepted for publication. As a service to our customers we are providing this early version of the manuscript. The manuscript will undergo copyediting, typesetting, and review of the resulting proof before it is published in its final form. Please note that during the production process errors may be discovered which could affect the content, and all legal disclaimers that apply to the journal pertain.
Competing interests
The authors declare that the research was conducted in the absence of any commercial or financial relationships that could be construed as a potential conflict of interest.
Data availability
The authors declare that the data supporting this study are available within the article’s Supplementary files. Extra data are available from the corresponding author upon request.
References
- Banerjee P, Bhunia AK, 2009. Mammalian cell-based biosensors for pathogens and toxins. Trends in Biotechnology. 10.1016/j.tibtech.2008.11.006 [DOI] [PubMed] [Google Scholar]
- Baumann F, Bryant C, 2019. Cultured Meat Nutritional Enhancements Report. OSF Preprints. 10.31219/osf.io/tj96x [DOI] [Google Scholar]
- Botella-Pavia P, Rodriguez-Concepcion M, 2006. Carotenoid biotechnology in plants for nutritionally improved foods. Physiologia Plantarum 126, 369–381. 10.1111/j.1399-3054.2006.00632.x [DOI] [Google Scholar]
- Bryant C, Barnett J, 2018. Consumer acceptance of cultured meat: A systematic review. Meat Science. 10.1016/j.meatsci.2018.04.008 [DOI] [PubMed] [Google Scholar]
- Canavari M, Nayga RM, 2009. On consumers’ willingness to purchase nutritionally enhanced genetically modified food. Applied Economics 41, 125–137. 10.1080/00036840701367564 [DOI] [Google Scholar]
- Ceroni F, Ellis T, 2018. The challenges facing synthetic biology in eukaryotes. 10.1038/s41580-018-0013-2 [DOI] [PubMed] [Google Scholar]
- Chitchumroonchokchai C, Diretto G, Parisi B, Giuliano G, Failla ML, 2017. Potential of golden potatoes to improve vitamin A and vitamin E status in developing countries. PLOS ONE 12, e0187102 10.1371/journal.pone.0187102 [DOI] [PMC free article] [PubMed] [Google Scholar]
- Davy AM, Kildegaard HF, Andersen MR, 2017. Cell Factory Engineering. Cell Systems. 10.1016/j.cels.2017.02.010 [DOI] [PubMed] [Google Scholar]
- Desmarchelier C, Borel P, 2017. Overview of carotenoid bioavailability determinants: From dietary factors to host genetic variations. Trends in Food Science & Technology 69, 270–280. 10.1016/TTIFS.2017.03.002 [DOI] [Google Scholar]
- Ding S, Swennen GNM, Messmer T, Gagliardi M, Molin DGM, Li C, Zhou G, Post MJ, 2018. Maintaining bovine satellite cells stemness through p38 pathway. Scientific Reports 8, 10808 10.1038/s41598-018-28746-7 [DOI] [PMC free article] [PubMed] [Google Scholar]
- Falowo AB, Fayemi PO, Muchenje V, 2014. Natural antioxidants against lipid-protein oxidative deterioration in meat and meat products: A review. Food Research International 64, 171–181. 10.1016/TFOODRES.2014.06.022 [DOI] [PubMed] [Google Scholar]
- FDA, 2019. Formal Agreement Between FDA and USDA Regarding Oversight of Human Food Produced Using Animal Cell Technology Derived from Cell Lines of USDA-amenable Species [WWW Document]. URL https://www.fda.gov/food/domestic-interagency-agreements-food/formal-agreement-between-fda-and-usda-regarding-oversight-human-food-produced-using-animal-cell (accessed 4.6.20).
- FDA, 2017. AquAdvantage Salmon Approval Letter and Appendix [WWW Document]. URL https://www.fda.gov/animal-veterinary/animals-intentional-genomic-alterations/aquadvantage-salmon-approval-letter-and-appendix (accessed 4.6.20).
- Geurts AM, Yang Y, Clark KJ, Liu G, Cui Z, Dupuy AJ, Bell JB, Largaespada DA, Hackett PB, 2003. Gene transfer into genomes of human cells by the sleeping beauty transposon system. Molecular Therapy 8, 108–117. 10.1016/S1525-0016(03)00099-6 [DOI] [PubMed] [Google Scholar]
- Giddings G, 2001. Transgenic plants as protein factories. Current Opinion in Biotechnology. 10.1016/S0958-1669(00)00244-5 [DOI] [PubMed] [Google Scholar]
- Heider SAE, Wendisch VF, 2015. Engineering microbial cell factories: Metabolic engineering of Corynebacterium glutamicum with a focus on non-natural products. Biotechnology Journal. 10.1002/biot.201400590 [DOI] [PubMed] [Google Scholar]
- Izsvák Z, Ivics Z, Plasterk RH, 2000. Sleeping Beauty, a wide host-range transposon vector for genetic transformation in vertebrates. Journal of Molecular Biology 302, 93–102. 10.1006/JMBI.2000.4047 [DOI] [PubMed] [Google Scholar]
- Keasling JD, 2010. Manufacturing molecules through metabolic engineering. Science. 10.1126/science.1193990 [DOI] [PubMed] [Google Scholar]
- Kowarz E, Löscher D, Marschalek R, 2015a. Optimized Sleeping Beauty transposons rapidly generate stable transgenic cell lines. Biotechnology Journal 10, 647–653. 10.1002/biot.201400821 [DOI] [PubMed] [Google Scholar]
- Kowarz E, Löscher D, Marschalek R, 2015b. Optimized Sleeping Beauty transposons rapidly generate stable transgenic cell lines. Biotechnology Journal 10, 647–653. 10.1002/biot.201400821 [DOI] [PubMed] [Google Scholar]
- Le Moal E, Pialoux V, Juban G, Groussard C, Zouhal H, Chazaud B, Mounier R, 2017. Redox Control of Skeletal Muscle Regeneration. Antioxidants & redox signaling 27, 276–310. 10.1089/ars.2016.6782 [DOI] [PMC free article] [PubMed] [Google Scholar]
- Lee S, Tak E, Lee J, Rashid M, Murphy MP, Ha J, Kim SS, 2011. Mitochondrial H2 O2 generated from electron transport chain complex i stimulates muscle differentiation. Cell Research 21, 817–834. 10.1038/cr.2011.55 [DOI] [PMC free article] [PubMed] [Google Scholar]
- Lindqvist A, He YG, Andersson S, 2005. Cell type-specific expression of β-carotene 9′,10′-monooxygenase in human tissues. Journal of Histochemistry and Cytochemistry 53, 1403–1412. 10.1369/jhc.5A6705.2005 [DOI] [PubMed] [Google Scholar]
- López-Revuelta A, Sánchez-Gallego JI, Hernández-Hernández A, Sánchez-Yagüe J, Llanillo M, 2006. Membrane cholesterol contents influence the protective effects of quercetin and rutin in erythrocytes damaged by oxidative stress. Chemico-Biological Interactions 161, 79–91. 10.1016/j.cbi.2006.03.004 [DOI] [PubMed] [Google Scholar]
- Martínez A, Stinco CM, Meléndez-Martínez AJ, 2014. Free radical scavenging properties of Phytofluene and Phytoene isomers as compared to Lycopene: A combined experimental and theoretical study. Journal of Physical Chemistry B 118, 9819–9825. 10.1021/jp503227j [DOI] [PubMed] [Google Scholar]
- Mátés L, Chuah MKL, Belay E, Jerchow B, Manoj N, Acosta-Sanchez A, Grzela DP, Schmitt A, Becker K, Matrai J, Ma L, Samara-Kuko E, Gysemans C, Pryputniewicz D, Miskey C, Fletcher B, VandenDriessche T, Ivics Z, Izsvák Z, 2009. Molecular evolution of a novel hyperactive Sleeping Beauty transposase enables robust stable gene transfer in vertebrates. Nature Genetics 41, 753–761. 10.1038/ng.343 [DOI] [PubMed] [Google Scholar]
- Matsuda T, Cepko CL, 2004. Electroporation and RNA interference in the rodent retina in vivo and in vitro. Proceedings of the National Academy of Sciences 101, 16–22. 10.1073/pnas.2235688100 [DOI] [PMC free article] [PubMed] [Google Scholar]
- Mattick CS, Landis AE, Allenby BR, Genovese NJ, 2015. Anticipatory Life Cycle Analysis of In Vitro Biomass Cultivation for Cultured Meat Production in the United States. Environmental Science & Technology 49, 11941–11949. 10.1021/acs.est.5b01614 [DOI] [PubMed] [Google Scholar]
- Melendez-Martinez AJ, Stinco CM, Liu C, Wang X-D, 2013. A simple HPLC method for the comprehensive analysis of cis/trans (Z/E) geometrical isomers of carotenoids for nutritional studies. Food Chemistry 138, 1341–1350. 10.1016/J.FOODCHEM.2012.10.067 [DOI] [PubMed] [Google Scholar]
- Mojica FJM, Montoliu L, 2016. On the Origin of CRISPR-Cas Technology: From Prokaryotes to Mammals. Trends in Microbiology. 10.1016/j.tim.2016.06.005 [DOI] [PubMed] [Google Scholar]
- Nielsen J, 2015. Yeast cell factories on the horizon: Metabolic engineering in yeast gets increasingly more versatile. Science. 10.1126/science.aad2081 [DOI] [Google Scholar]
- Piao YJ, Seo YH, Hong F, Kim JH, Kim YJ, Kang MH, Kim BS, Jo SA, Jo I, Jue DM, Kang I, Ha J, Kim SS, 2005. Nox 2 stimulates muscle differentiation via NF-κB/iNOS pathway. Free Radical Biology and Medicine 38, 989–1001. 10.1016/j.freeradbiomed.2004.11.011 [DOI] [PubMed] [Google Scholar]
- Post MJ, 2012. Cultured meat from stem cells: Challenges and prospects. Meat Science 92, 297–301. 10.1016/J.MEATSCI.2012.04.008 [DOI] [PubMed] [Google Scholar]
- Rubio NR, Fish KD, Trimmer BA, Kaplan DL, 2019. In Vitro Insect Muscle for Tissue Engineering Applications. ACS Biomaterials Science & Engineering 5, 1071–1082. 10.1021/acsbiomaterials.8b01261 [DOI] [PubMed] [Google Scholar]
- Sack M, Rademacher T, Spiegel H, Boes A, Hellwig S, Drossard J, Stoger E, Fischer R, 2015. From gene to harvest: Insights into upstream process development for the GMP production of a monoclonal antibody in transgenic tobacco plants. Plant Biotechnology Journal. 10.1111/pbi.12438 [DOI] [PubMed] [Google Scholar]
- Satomi Y, Yoshida T, Aoki K, MIsAwA N, Masuda M, Murakoshi M, Takasuka N, Sugimura T, 1995. Production of Phytoene, an Oxidative Mammalian Cells by Introduction of Isolated from a Bacterium Stress Protective Carotenoid, in Phytoene Synthase Gene crtB Erwinia uredovora. Proc. Japan Acad 71. [Google Scholar]
- Schukur L, Fussenegger M, 2016. Engineering of synthetic gene circuits for (re-)balancing physiological processes in chronic diseases. Wiley Interdisciplinary Reviews: Systems Biology and Medicine 8, 402–422. 10.1002/wsbm.1345 [DOI] [PubMed] [Google Scholar]
- Seale P, Sabourin LA, Girgis-Gabardo A, Mansouri A, Gruss P, Rudnicki MA, 2000. Pax7 is required for the specification of myogenic satellite cells. Cell 102, 777–786. 10.1016/S0092-8674(00)00066-0 [DOI] [PubMed] [Google Scholar]
- Simonne AH, Green NR, Bransby DI, 1996. Consumer Acceptability and p-Carotene Content of Beef as Related to Cattle Finishing Diets. Journal of Food Science 61, 1254–1257. 10.1111/j.1365-2621.1996.tb10973.x [DOI] [Google Scholar]
- Simsa R, Yuen J, Stout A, Rubio N, Fogelstrand P, Kaplan DL, 2019. Extracellular Heme Proteins Influence Bovine Myosatellite Cell Proliferation and the Color of Cell-Based Meat. Foods 2019, Vol. 8, Page 521 8, 521 10.3390/FOODS8100521 [DOI] [PMC free article] [PubMed] [Google Scholar]
- Sun Y, Yuan Q-P, Vriesekoop F, 2007. Effect of two ergosterol biosynthesis inhibitors on lycopene production by Blakeslea trispora. Process Biochemistry 42, 1460–1464. 10.1016/J.PROCBIO.2007.06.006 [DOI] [Google Scholar]
- Szymczak AL, Workman CJ, Wang Y, Vignali KM, Dilioglou S, Vanin EF, Vignali DAA, 2004. Correction of multi-gene deficiency in vivo using a single “self-cleaving” 2A peptide–based retroviral vector. Nature Biotechnology 22, 589–594. 10.1038/nbt957 [DOI] [PubMed] [Google Scholar]
- Tuorila H, Hartmann C, 2020. Consumer responses to novel and unfamiliar foods. Current Opinion in Food Science. 10.1016/j.cofs.2019.09.004 [DOI] [Google Scholar]
- Wang Z, Li H, Guo R, Wang Q, Zhang D, 2016. Antioxidants inhibit advanced glycosylation end-product-induced apoptosis by downregulation of miR-223 in human adipose tissue-derived stem cells. Scientific Reports 6 10.1038/srep23021 [DOI] [PMC free article] [PubMed] [Google Scholar]
- Wilks M, Phillips CJC, Fielding K, Hornsey MJ, 2019. Testing potential psychological predictors of attitudes towards cultured meat. Appetite 136, 137–145. 10.1016/j.appet.2019.01.027 [DOI] [PubMed] [Google Scholar]
- Wolk A, 2017. Potential health hazards of eating red meat. Journal of Internal Medicine 281, 106–122. 10.1111/joim.12543 [DOI] [PubMed] [Google Scholar]
- Yaffe D, Saxel O, 1977. Serial passaging and differentiation of myogenic cells isolated from dystrophic mouse muscle. Nature 270, 725–727. 10.1038/270725a0 [DOI] [PubMed] [Google Scholar]
- Ye X, Al-Babili S, Kloti A, Zhang J, Lucca P, Beyer P, Potrykus I, 2000. Engineering the provitamin A (beta-carotene) biosynthetic pathway into (carotenoid-free) rice endosperm. Science (New York, N.Y.) 287, 303–5. 10.1126/SCIENCE.287.5451.303 [DOI] [PubMed] [Google Scholar]
- Zhang F, Wang LP, Boyden ES, Deisseroth K, 2006. Channelrhodopsin-2 and optical control of excitable cells. Nature Methods 3, 785–792. 10.1038/nmeth936 [DOI] [PubMed] [Google Scholar]
- Zhang L, Xia H, Han Q, Chen B, 2014. Effects of antioxidant gene therapy on the development of diabetic retinopathy and the metabolic memory phenomenon. Graefe’s Archive for Clinical and Experimental Ophthalmology 253, 249–259. 10.1007/s00417-014-2827-8 [DOI] [PubMed] [Google Scholar]
Associated Data
This section collects any data citations, data availability statements, or supplementary materials included in this article.