

Abstract
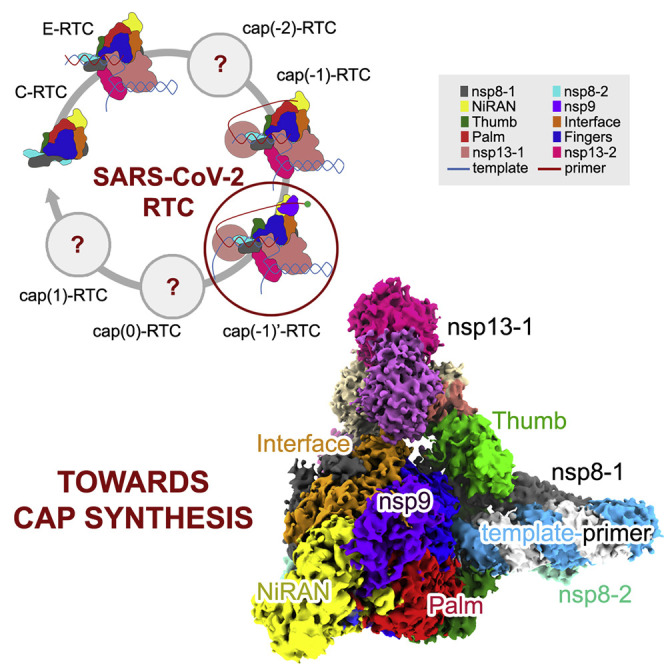
Transcription of SARS-CoV-2 mRNA requires sequential reactions facilitated by the replication and transcription complex (RTC). Here, we present a structural snapshot of SARS-CoV-2 RTC as it transitions toward cap structure synthesis. We determine the atomic cryo-EM structure of an extended RTC assembled by nsp7-nsp82-nsp12-nsp132-RNA and a single RNA-binding protein, nsp9. Nsp9 binds tightly to nsp12 (RdRp) NiRAN, allowing nsp9 N terminus inserting into the catalytic center of nsp12 NiRAN, which then inhibits activity. We also show that nsp12 NiRAN possesses guanylyltransferase activity, catalyzing the formation of cap core structure (GpppA). The orientation of nsp13 that anchors the 5′ extension of template RNA shows a remarkable conformational shift, resulting in zinc finger 3 of its ZBD inserting into a minor groove of paired template-primer RNA. These results reason an intermediate state of RTC toward mRNA synthesis, pave a way to understand the RTC architecture, and provide a target for antiviral development.
Keywords: SARS-CoV-2, replication and transcription complex, nsp9, cap, mRNA synthesis, cryo-EM
Graphical Abstract
Yan et al. present a cryo-EM structure of the SARS-CoV-2 replication and transcription complex that includes the single RNA-binding protein nsp9. The structural snapshot provides insight into how the viral machinery catalyzes a crucial step in viral mRNA cap synthesis, which is important for virus survival.
Introduction
Coronavirus disease 2019 (COVID-19) caused by severe acute respiratory syndrome coronavirus 2 (SARS-CoV-2) has resulted in 27 million infections and over 872,000 deaths (Chan et al., 2020; Chen et al., 2020b; Li et al., 2020; Tan et al., 2020; Wang et al., 2020a; WHO, 2020; Zhu et al., 2020). However, to date there are no effective therapeutic drugs available to treat this disease. Therefore, new insights into the proteins that are essential to its life cycle and replication are needed to help inform the discovery of new COVID-19 therapeutics.
SARS-CoV-2 has a positive-sense single-stranded RNA (ssRNA) genome (Ziebuhr, 2005). The replicase gene open reading frames 1a (ORF1a) and ORF1b are translated into large polyproteins, which are proteolytically processed by two viral proteases to yield 16 mature nonstructural proteins (nsps) (Ziebuhr, 2005). For efficient proliferation, a set of nsps assemble a replication and transcription complex (RTC) to synthesize the negative-strand template, the positive-strand genomic RNA, and subgenomic mRNAs.
The cap structure at the 5′ end of viral mRNAs plays essential roles in the life cycle of a virus by promoting initiation of translation, protecting mRNAs, and helping the virus escape host immune recognition (Daffis et al., 2010). The formation of cap structure in CoVs involves four sequential enzymatic reactions: (1) a 5′ RNA triphosphatase (RTPase) in nsp13 removes the γ-phosphate of 5′-triphosphate end (pppA) of the nascent mRNA to generate 5′-diphosphate end (ppA) (Ivanov et al., 2004; Ivanov and Ziebuhr, 2004), (2) an unknown guanylyltransferase (GTase) transfers a GMP to the remaining 5′-diphosphate end to yield the cap core structure (GpppA), (3) an N7-MTase in nsp14 methylates the cap guanine at the N7-position, thus producing the cap(0) structure (7MeGpppA) (Chen et al., 2009), and (4) a 2′-O-MTase in nsp16 converts cap(0) into cap(1) (7MeGpppA2’OMe) by methylating the ribose 2′-O-position of the first transcribed nucleotide (Bouvet et al., 2010; Chen et al., 2009; Decroly et al., 2008). For ease of description, ppA is referred to here as cap(−2), GpppA as cap(−1), analogous to the widely used 7MeGpppA as cap(0), and 7MeGpppA2’OMe as cap(1). Previous studies have shown that nsp13, nsp14, and nsp16 carryout the first, third, and fourth steps of cap synthesis (Bouvet et al., 2010; Chen et al., 2009; Decroly et al., 2008; Ivanov et al., 2004; Ivanov and Ziebuhr, 2004). However, knowledge of the enzyme that catalyzes the second step, as well as its architecture and mechanism of RTC during cap formation and mRNA synthesis, has remained unclear.
Previously, the structures of RNA-dependent RNA polymerase (nsp12) in complex with polymerase cofactors nsp7 and nsp8–nsp12 and template-primer RNA (nsp7-nsp82-nsp12-RNA; we name it the central RTC or C-RTC) (Gao et al., 2020; Wang et al., 2020b), and a mini RTC composed of helicase (nsp13) with C-RTC for the elongation of nucleic acid (nsp7-nsp82-nsp12-nsp132-RNA; we name it the elongation RTC or E-RTC) (Chen et al., 2020a; Yan et al., 2020), have been determined. We aim to provide an insight into the architecture of the complete RTC, as well as its variations, and working mechanism during replication and transcription. CoV-encoded nsp9 is a single-chain nucleic acid-binding protein and has been shown to co-localize with viral nsps and is therefore likely to be a key constituent of RTC (Bost et al., 2000; Brockway et al., 2003; Egloff et al., 2004; Sutton et al., 2004). Being indicated by the atomic structure of an extended E-RTC composed by E-RTC and nsp9 determined here, we provide evidence that the nidovirus RdRp-associated nucleotidyltransferase (NiRAN) domain of nsp12 is responsible for the second step of cap structure synthesis through its GTase activity and reveal a mechanism for how nsp9 inhibits nsp12 NiRAN GTase activity in an intermediate state of RTC for further cap(0) structure synthesis.
Results
Overall Architecture
We expressed and purified the full-length SARS-CoV-2 nsp9 (residues N1–Q113) in E. coli and incubated with E-RTC (nsp7-nsp82-nsp12-nsp132-RNA) to form an extended E-RTC in the presence of guanosine diphosphate (GDP)⋅BeF3 − (Figures 1A and 1B). Native gel electrophoretic mobility shift assays (EMSAs) reveal the formation of a complex with upper shift compared to C-RTC and E-RTC (Figure 1C). After collecting and processing 8,597 cryoelectron microscopy (cryo-EM) micrograph movies, the class that represented the extended E-RTC were identified and reconstructed to the overall resolution of 2.83 Å (with 67,540 particles). The local resolution for the density of the nsp7-nsp82-nsp9-nsp12 part is ranging from 2.0 Å to 3.0 Å, except the density for the central β sheet of nsp9 is with the local resolution around 4.0 Å. The local resolution for the densities for two nsp13 molecules varies from 3.0 Å to 7.0 Å, and the poor-quality regions are mainly distributed beyond residue E145, possibly due to lack of intermolecular interaction. Nevertheless, the good quality of the density for the N-terminal part of nsp13, particularly in the interaction regions with other components in the extended E-RTC, allows us to rigid-body fit two nsp13 molecules into the density (Figure S1 ; Table S1).
Figure 1.

Purification of the SARS-CoV-2 Nsp7-Nsp82-Nsp9-Nsp12-Nsp132-RNA Complex
(A) The scaffold of RNA used in the structural study.
(B) SDS-PAGE analysis of the complex and individual components. Lane 1, marker; lane 2, nsp12-nsp7-nsp8-nsp13-nsp9 and RNA complex; lane 3, the nsp12-7-8 complex purified by mono Q 5/50 ion-exchange chromatography; lane 4, the nsp7-8 complex; lane 5, nsp13; lane 6, nsp9. The 10% SDS-PAGE gel was stained with Coomassie blue.
(C) Native gel electrophoretic mobility shift assay reveals the formation of the complex. The 6% polyacrylamide gel was visualized with ethidium bromide to stain the RNA.
Figure S1.

Cryo-EM Reconstruction, Related to Figure 2
(A) Raw image of SARS-CoV-2 cap(−1) RTC particles in vitreous ice recorded at defocus values from −1.0 to −1.8 μm. Scale bar, 50 nm.
(B) Power spectrum of the image shown in (A), with plot of the rotationally averaged intensity versus resolution. White circle indicates the spatial frequency corresponding to 3.0 Å resolution.
(C) Representative class averages. The edge of each square is ∼367 Å.
(D) Flowchart of SARS-CoV-2 cap(−1) RTC reconstruction. Local resolution estimation is shown at the bottom panel.
(E) Fourier shell correlation (FSC) of the final 3D reconstruction following gold standard refinement. FSC curves are plotted before and after masking.
(F) Angular distribution heatmap of particles used for the refinement.
(G) The 3DFSC sphericity analyzed with 3DFSC in cryoSPARC (Punjani et al., 2017).
The extended E-RTC is composed of one nsp7, two nsp8 (identified as nsp8-1 and nsp8-2; Gao et al., 2020), one nsp12, two nsp13 (identified as nsp13-1 and nsp13-2 as indicated in Figure 2 ), a paired template-primer RNA, and an nsp9 (Figure 2). The cryo-EM density with good quality clearly indicates the existence of nsp9 bound close to the catalytic center of nsp12 NiRAN. The template-primer RNA, nsp7, nsp8, and nsp12 assemble C-RTC with a similar architecture as previously reported (Gao et al., 2020; Hillen et al., 2020; Wang et al., 2020b). The paired portion of the template-primer RNA is tightly clamped by nsp12 and the helical stalks of the two nsp8 protomers. Two nsp13 protomers bind to the plane region formed by the two nsp8 protomers and nsp12. Nsp13-1 binds to nsp12 and nsp8-1 to stabilize the architecture of RTC, while nsp13-2 channels the unpaired 5′ extension of the RNA template through an RNA-binding channel formed by its 1A, 2A, and 1B domains. By comparison to E-RTC, the orientation of nsp13-2 has a distinct shift (will be discussed later).
Figure 2.

Architecture of the Extended E-RTC
(A) Domain organization of each component in the extended E-RTC. The color scheme for nsp7, nsp8, nsp12, and nsp13 is generally the same as that used in our previous work (Gao et al., 2020) with modifications. Nsp7, deep purple; nsp8-1, gray; nsp8-2, green cyan; nsp9, magenta; nsp12 NiRAN, yellow; nsp12 Interface, orange; nsp12 Fingers, blue; nsp12 Palm, red; nsp12 Thumb, green; nsp13 ZBD, light green; nsp13 S, light salmon; nsp13 1B, light magenta; nsp13 1A, sand; nsp13 2A, red pink.
(B) Cryo-EM densities (upper panels) and cartoon representations (lower panels) of the extended E-RTC shown in three perpendicular views.
Interaction of Nsp9 with Nsp12
In the extended E-RTC, nsp9 tightly binds with nsp12 adjacent to the catalytic center of nsp12 NiRAN (Figure 3 A; Table S2). The nsp9-nsp12 buried interface is 928 Å2 compared to ∼3,000 Å2 for the total surface area of nsp9. Though the overall folding of nsp9 in the extended E-RTC and in the crystallographic structure (PDB: 6W9Q) (Littler et al., 2020) are generally similar, nsp9N1-nsp9L9 move by ∼16 Å, allowing it to make contact with nsp12 NiRAN, the Interface and the Palm domains (Figure S2 ).
Figure 3.

Interface between the Nsp9 and Nsp12 Protomers
(A–C) Two regions at the nsp9-nsp12 interface are highlighted by red (A) and blue frames and are enlarged in (B) and (C). The extended E-RTC is shown as a cartoon diagram with the color scheme the same as in Figure 1. Key residues at the nsp9-nsp12 interface are shown as colored sticks. The dashed lines indicated the bonds with the distance less than 3.5 Å.
(D and E) Sequence alignments of the key regions at the nsp9-nsp12 interface (D), GDP binding (E) (related to Figure 4). The key contact residues are highlighted by colored backgrounds with the same color as the domain or protein where they are located.
Figure S2.

Comparison of Nsp9 in RTC and in a Crystal Structure, Related to Figure 3
(A) The structures of SARS-CoV-2 nsp9 in RTC (purple) and in a crystal structure (PDB: 6W9Q) (Littler et al., 2020) (green) aligned.
(B and C) Surface representation of the structure of nsp9 in RTC (B) and (C) the crystal structure of nsp9. The key interacting residues of nsp9 with nsp12 in RTC or the inter-protomer interaction sites in the dimeric crystal structure are highlighted in yellow and with labels.
The nsp9-nsp12 interface has two defined regions. Region 1 is formed by nsp9 N terminus, Palm domain, and a previously identified β-hairpin motif (Gao et al., 2020) in NiRAN of nsp12 (Figure 3A). In region 1, the side chains of nsp12D36 (β-hairpin), nsp12Y728 (Palm), and nsp12R733 (Palm) form hydrogen bonds with nsp9N2 (Figure 3B). The backbone amide and the carbonyl oxygen atoms of nsp9E3 interact with the carbonyl oxygen atoms of nsp12Y38 (β-hairpin) and nsp12R733 (Palm), respectively. In region 2, a flat region in nsp12 NiRAN interacts with the C-terminal α helix of nsp9, which is stabilized by several hydrophobic interactions and three hydrogen bonds (Figure 3C). In this region, nsp12V202-V204-I223-V231 makes hydrophobic contacts with nsp9L4 and nsp9L103. The side chain of nsp9N96 forms hydrogen bonds with the carbonyl oxygen atoms of nsp12P232 and nsp12Y289. Moreover, the backbone amide of nsp9N96 contacts with nsp12D291 (Interface). All these interacting residues are highly conserved in SARS-CoV-2, SARS-CoV, Middle East respiratory syndrome (MERS)-CoV, and RaTG13 (Figure 3D), suggesting a conserved nsp9-nsp12 interaction.
Interestingly, crystallographic structures of CoV-encoded nsp9 have shown that nsp9 is presumed to form a biological dimer utilizing the interaction between the C-terminal α helices (Egloff et al., 2004; Littler et al., 2020; Sutton et al., 2004). Two key conserved glycine residues (G100 and G104) in a GXXXG motif (Kleiger et al., 2002; Miknis et al., 2009) of the C-terminal α helix were shown to play an essential role in nsp9 dimerization, and the substitutions of them as glutamate residues significantly attenuated viral proliferation (Miknis et al., 2009). In the extended E-RTC, G100 and G104 directly face nsp12 and participate in the formation of the nsp9-nsp12 interface (Figure 3C; Figure S2; Table S2), indicating nsp9G100E and nsp9G104E mutations have multiple roles in virus life cycle. Moreover, nsp9N2 and nsp9E3 are also included in both contacts with nsp12 in the extended E-RTC or with another nsp9 monomer in the dimeric crystal structure (Figure S2). It is likely that nsp9 may have an intermediate from a homodimeric state (possibly appears immediately after translation) to a monomeric state to be further assembled into RTC.
Contact of Nsp9 N Terminus with Nsp12 NiRAN Catalytic Center
To form the extended E-RTC, E-RTC was incubated with nsp9 in the presence of GDP⋅BeF3 −. In the extended E-RTC, a GDP molecule is bound at the catalytic center of nsp12 NiRAN (Figure 4 A; Figure S3 A). Its diphosphate moiety is buried in a positively charged pocket formed by the side chains of nsp12K50, nsp12N52, nsp12K73, and nsp12R116 in nsp12 NiRAN. A magnesium ion (Mg2+) is coordinated by the diphosphate group of the bound GDP and the side chains of N209 and D218. The hydrophilic side chains of nsp12D218 and nsp12R116 form close contacts with the β-phosphate of the bound GDP. The side chain amide atom of nsp12K73, which corresponds to K94 in EAV nsp9 and was suggested to be the conserved catalytic residue for nidoviral NiRAN (Lehmann et al., 2015), is 3.9 Å to the phosphoester oxygen between the α- and β-phosphate of the bound GDP. The imidazole group of nsp12H75 stacks with the base of GDP to stabilize the conformation.
Figure 4.

Nsp9 Inhibits Nsp12 GTase Activity
(A) Structure of nsp9 N terminus inserting into the catalytic center of nsp12 NiRAN. The polypeptides of nsp9 and nsp12 are shown as cartoon diagrams with the same color scheme in Figure 2. A GDP bound at the catalytic center of nsp12 NiRAN is shown as colored sticks (C, green; O, red; N, blue; P, gold). Key residues are represented as colored sticks with labels. The magnesium ion is shown as a gray sphere. The cryo-EM density for the bound GDP and key residues are shown in mesh. The sequence comparison of these key residues with other CoVs is shown in Figure 3E.
(B) MS/MS (tandem mass spectrometry) spectrum of a peptide ion of nsp9 incubated with nsp12 in the absence or presence of NTP. The concentration of nsp9 is 1 mg/mL. For the reaction, 1 mg/mL nsp9 was incubated with 10 mg/mL nsp12 and 2 mM NTP for 30 min at 25°C. The proteins were excised from SDS-PAGE stained with Coomassie blue. Gel samples were reduced and alkylated using DTT and iodoacetamide, respectively. Samples were digested by Asp-N overnight at 37°C and de-salted using solid phase extraction (SPE) prior to mass spectrometry analysis. The peptide sequence is shown on top with the Asp-N digestion-induced fragmentation pattern. The b and y ions are shown in red and blue/black, respectively. Two residues from the expression vector are colored in green.
(C) Nucleotidylation activities of WT nsp12 alone, WT nsp12 incubated with WT nsp9, nsp12 with the nsp12K73A mutant (mutant-1), nsp9Δ5 (mutant-2), nsp9N96A (mutant-3), nsp9G100E (mutant-4), and nsp9G104E (mutant-5). The results were shown as the mean ± SD from three independent experiments.
(D) Results of GTase activity assays. The components used in each lane are labeled. In lanes 5–7, nsp12 is incubated with nsp9 in molar ratio of 1:2 (denoted as +), 1:4 (denoted as 2+), and 1:6 (denoted as 3+). The integrated densities of the bands in lanes 4–7 corresponding to apo-nsp12, plus nsp9, plus 2+ nsp9, and plus 3+ nsp9, 27,887, 16,412, 12,563, and 10,614, respectively were calculated using ImageJ Fiji software (Schindelin et al., 2012). The result is a representative of three independent experiments.
Figure S3.

Structural Detail of the Nsp9 N Terminus Inserting into the Catalytic Center of Nsp12 NiRAN and the Comparison of Nsp12 NiRAN with SelO, Related to Figure 4
(A) A perpendicular view of Figure 4A. The dashed lines show the interaction with labeled distances.
(B) The aligned structures of SARS-CoV-2 nsp12 (yellow) and SelO (PDB: 6EAC) (magenta). GDP and AMP-PNP bound to nsp12 NiRAN and SelO, respectively are shown as colored sticks.
The N terminus of nsp9 inserts deep into the catalytic center of nsp12 NiRAN and makes bonds with the bound GDP (Figure 4A; Figure S3A). The side chain of nsp9N1 makes an interaction with α-phosphate of the bound GDP, and the connecting density suggests the formation of a bond. Again, the residues that contact with GDP are highly conserved among SARS-CoV-2, SARS-CoV, MERS-CoV, and RatG13 (Figure 3D). In contrast to GDP binding with nsp12 NiRAN, BeF3 − is not observed in the density (Figure 4A; Figure S3A), and furthermore, there is no space in the active site of nsp12 NiRAN to accommodate BeF3 −. Previous structural studies suggest that when GDP⋅BeF3 − is bound to the active site of an enzyme it mimics the pre-hydrolysis state, while the release of BeF3 − mimics progress of hydrolysis (Korhonen et al., 2014). The lack of GDP⋅BeF3 − in the extended E-RTC suggests it may be captured in an intermediate state during nsp12 NiRAN catalytic reaction.
Biochemical Implications of the Nsp9-Nsp12 Interaction
Being indicated by nsp9-nsp12 interaction, we further explored the function of nsp12 and the impact of nsp9 on it. Previous studies have shown the nsp12 NiRAN domain has structural similarity with pseudokinase selenoprotein-O (SelO) (Figure S3B), which has AMPylation activity whereby AMP is transferred from ATP to Ser/Thr/Tyr residues on protein substrates (Sreelatha et al., 2018). Because the N terminus of nsp9 inserts into the catalytic center of nsp12 NiRAN and makes a bond with GDP, we first verified whether nsp9 is a possible substrate of nsp12 NiRAN. To do this, we incubated nsp9 with nsp12 in the presence of NTP and did not detect a peak corresponding to the NTP-modified N-terminal peptide of nsp9 in mass spectrum (Figure 4B). Since the residue of nsp9 that contacts with bound GDP is an asparagine residue, this result is not surprising.
Another study has shown that the NiRAN domain in nidoviral RdRp has nucleotidylation activity with uridine-5ʹ-triphosphate (UTP)/guanosine 5′-triphosphate (GTP) preference (Lehmann et al., 2015). We next assessed whether SARS-CoV-2 nsp12 has nucleotidylation activity. Using a pyrophosphate assay, we demonstrated that SARS-CoV-2 nsp12 indeed has the nucleotidylation activity in the presence of GTP or UTP (Figure 4C). The mutation of the catalytic residue nsp12K73A eliminated the nucleotidylation activity of nsp12 and this activity was attenuated in the presence of wild-type (WT) nsp9. Moreover, we made several mutants of residues that are involved in the nsp9-nsp12 interaction, including nsp9 truncated by five N-terminal residues, (nsp9Δ5), nsp9N96A, nsp9G100E, and nsp9G104E, and found that all these mutations restore the nucleotidylation activity of nsp12. These results further suggest that the association of nsp9 inhibits the nucleotidylation activity of nsp12.
We then investigated whether the nucleotidylation activity of nsp12 may function as 5′ end cap GTase to transfer a GMP to ppA to produce GpppA for the further formation of cap(0) structure. In an in vitro GTase assay, we found that nsp12 catalyzes the transfer of GMP to ppA-RNA to form GpppA-RNA in the presence of nsp13, which is known to function as a CoV RTPase to yield ppA-RNA from pppA-RNA (Ivanov et al., 2004; Ivanov and Ziebuhr, 2004) (Figure 4D). In the presence of nsp9, the signal corresponding to the radioactive-labeled GpppA-RNA is attenuated more so than in the absence of nsp9; however, a certain extent of the signal still exists. Since the nucleotidylation activity of nsp12 still remains in the presence of nsp9 (Figure 4C), this result is not surprising. Alternatively, in the absence of nsp13, the amount of synthesis of GpppA-RNA is negligible. All these results support the concept that nsp12 NiRAN functions as a GTase to catalyze the formation of cap core structure (GpppA) and the association with nsp9 inhibits this process.
Structural Rearrangements of Nsp13
Previous studies show that two nsp13 protomers and their interactions play an essential role in template binding and RNA unwinding (Chen et al., 2020a; Yan et al., 2020). Comparison of the nsp13 protomers in E-RTC and the extended E-RTC shows that the conformation of nsp13-1 is conserved; however, the orientation of nsp13-2 has a notable difference (Figures 5A and 5B; Figure S4 ).
Figure 5.

Conformational Changes in Nsp13-2 upon Nsp9 Binding
(A and B) Structures of E-RTC (A) and the extended E-RTC (B) are aligned with the guidance of nsp7-nsp8-nsp12 and are shown in the same two perpendicular views. In each panel, nsp13-2 and nsp9 are colored as in Figure 1. Other components in RTC have white molecular surfaces. Two purple circles indicate the position for nsp9 binding. Two regions with conformational changes are framed and are enlarged in (C–F).
(C and D) Conformational changes for nsp13-2 ZBD ZF3 in E-RTC (C) and in the extended E-RTC (D).
(E and F) Conformational changes for nsp13-2 1B domain in E-RTC (E) and in the extended E-RTC (F).
Figure S4.

Orientation Differences of Nsp13-2 in Extended E-RTC and E-RTC, Related to Figure 5
(A and B) Structure of the extended E-RTC (A) and E-RTC (B) aligned to the extended E-RTC and in the same two perpendicular views.
(C) Comparison of the extended E-RTC and E-RTC. The structural regions with high similarity in two RTCs, including nsp7-nsp8-nsp12-RNA and nsp13-1, are shown as a molecular surface with the same color scheme in Figure 2. Nsp13-2 in the two RTCs are displayed as colored cartoons.
(D) The interaction of nsp8-1Y71 with nsp13-2 ZBD in the extended E-RTC. The dashed line represents a potential hydrogen bond.
In the extended E-RTC, nsp13-2, as a rigid body, moves downward to the template-primer RNA clamped by nsp8-1 and nsp8-2. As a consequence, the zinc finger 3 (ZF3) motif of nsp13-2 ZBD (zinc-binding domain) and the adjacent loop (spanning residues G66–S80) insert into the groove that is formed by nsp8-1 and nsp8-2 to clamp the paired template-primer in the extended E-RTC. The insertion part of nsp13-2 ZBD is closed to the second minor groove (originated from the polymerase center of nsp12) of the paired template-primer RNA (Figure 5D; Figure S5 A; Table S3). But in E-RTC, ZF3 is distant from this groove (Figure 5C; Figure S5A). Because ZF3 has been shown to play essential roles in nidovirus mRNA synthesis without impact on the helicase activity (Seybert et al., 2005; van Dinten et al., 1997; 2000), the movement of nsp13-2 looks to be a necessary step that occurs in CoV mRNA synthesis.
Figure S5.

The Conformational Difference of Nsp13-2 ZBD ZF3 and a Potential RNA-Binding Groove at the Nsp9-Nsp12 Interface, Related to Figures 5C, 5D, and 6
(A) nsp13-2 ZBD ZF3 conformational changes between in E-RTC compared to the extended E-RTC. The view is perpendicular to Figures 5C and 5D.
(B) A potential RNA binding groove. Nsp9 and nsp12 are displayed as colored cartoons in the left panel and are covered by electrostatic potential surfaces in the right panel. GDP bound to nsp12 NiRAN is shown as colored sticks to indicate the catalytic center of nsp12 NiRAN. The dashed lines indicate a potential RNA binding groove through nsp12 NiRAN to nsp9.
Another interesting observation is that the movement of nsp13-2 ZBD toward nsp13-1 ZBD and nsp8-1 with a large distance of 35 Å results in a hydrogen-bond formed by the carbonyl oxygen atom of nsp13-2P53 and nsp8-1Y71 (Figure S4D; Table S4). In contrast, nsp8-1Y71 interacts with nsp13-1 and has no contact with nsp13-2 in the E-RTC. The movement of nsp13-2 also results in a loosening of the contact between 1B domains of the two nsp13s (Figures 5E and 5F).
Discussion
The formation of the cap structure is essential to synthesize CoV mRNA. Among the four sequential steps for CoV cap structure formation, the activities of RTPase, N7-MTase, and 2′-O-Mtase, which are deployed by nsp13, nsp14, and nsp16, respectively, facilitate the first, third, and fourth step and are well established (Bouvet et al., 2010; Chen et al., 2009; Decroly et al., 2008; Ivanov et al., 2004; Ivanov and Ziebuhr, 2004). In this work, we show evidence that nsp12 NiRAN biochemically catalyzes the transfer of a GMP to ppA to form the GpppA cap core structure, supporting that nsp12 NiRAN is an enzyme that catalyzes the second step of cap structure synthesis. This finding provides complementary key information to understand the circle of CoV mRNA synthesis. We note here that nsp12 NiRAN can also catalyze the transfer of an uridine 5′-monophosphate (UMP) to ppA to form UpppA (Figure S6 ). However, because the subsequent methyl transfer reaction for cap synthesis requires nsp14 that has N7-guanine MTase activity (Bouvet et al., 2010; Chen et al., 2009; Jin et al., 2013), a possible UpppA-RNA substrate is not likely to be a biologically relevant substrate for further cap synthesis.
Figure S6.

Results of GTase Activity Assays with [α-32P]-UTP, Related to Figure 4D
The components used in each lane are labeled. In lane 5-7, nsp12 is incubated with nsp9 in molar ratio of 1:2 (denoted as +), 1:4 (denoted as 2+) and 1:6 (denoted as 3+). The reaction condition is the same as that used in Figure 4D.
Interestingly, nsp9 tightly contacts with nsp12 NiRAN and inhibits its enzymatic activity in the extended E-RTC. CoV-encoded nsp9 has been known to have RNA- and DNA-binding ability and to co-localize with nsps in the virus life cycle, suggesting it is a key component of RTC (Bost et al., 2000; Brockway et al., 2003; Egloff et al., 2004; Sutton et al., 2004). Upon nsp9 binding to nsp12 NiRAN, the residues in the N-terminal β-hairpin spanning residues V31-K50 of nsp12 NiRAN and the residues in the central β sheet of nsp9 form a positively charged groove, extending from the catalytic center of nsp12 NiRAN to nsp9 (Figure S5B). This groove may represent a potential RNA-binding groove to stabilize the conformation of the released 5′ end of GpppA-RNA after catalytic reaction, standing by for its subsequent processing by nsp14 and nsp16 to form the cap structure and the mature mRNAs. In this context, ZF3 of nsp13-2 ZBD might function as a “brake” to temporarily suspend the elongation of nascent RNA by inserting into the minor groove of the double-stranded nascent RNA-template pair.
According to current structural information of CoV RTCs, we propose a speculative model for SARS-CoV-2 RTC to catalyze the synthesis of mRNA (Figure 6 ). In the initial step, nsp7, nsp8, and nsp12 compose the C-RTC. In the second step, C-RTC recruits two nsp13 molecules and template-primer RNA to form the E-RTC that catalyzes the elongation of nascent RNA with 5′ triphosphate (pppA-RNA) under the guidance of template RNA. In the third step, a nsp13 molecule may catalyze the remove of the 5′ γ-phosphate group of pppA-RNA to generate ppA-RNA. Because two nsp13 molecules observed in this work are remote from the 5′ end of the nascent RNA, it is likely that another nsp13 might be recruited in an unidentified position for this step. We name this RTC cap(−2)-RTC. In the fourth step, the 5′ diphosphate end of ppA-RNA would be delivered to nsp12 NiRAN to form GpppA-RNA in a so-called cap(−1)-RTC. When the enzymatic reaction of nsp12 NiRAN is finished, an nsp9 will be recruited to form a cap(−1)’-RTC as an intermediate state, in which nsp9 stabilize the 5′ end of GpppA-RNA in the potential RNA-binding groove. It is worthy to note that the observed 5′ end of the product is around 110 Å from nsp12 NiRAN catalytic center in cap(−1)’-RTC. It is likely that some other nsps would be assembled into cap(−1)-RTC and serve as structural building blocks to mediate the transferring of 5′ end of the nascent ssRNA to nsp12 NiRAN catalytic center. This might be a necessary prerequisite for the correct function of the complete RTC. In the fifth step, nsp14 would be recruited to form a cap(0)-RTC to catalyze the methylation of the cap guanine at the N7-position to yield 7MeGpppA-RNA. And in the last step, nsp16 would be recruited to form a cap(1)-RTC to catalyze the methylation of the ribose 2′-O-position of the first transcribed nucleotide to produce mature mRNA with 7MeGpppA2’OMe cap(1) structure.
Figure 6.

A Model for mRNA Synthesis by SARS-CoV-2 RTC
The representative building blocks in the RTCs are indicated in the upper panel.
Several crystallographic structures of nsp9 present a dimeric form of nsp9, in which the dimerization was shown to be important for efficient virus proliferation (Egloff et al., 2004; Littler et al., 2020; Miknis et al., 2009; Sutton et al., 2004). Since the interfaces for nsp9 dimerization and nsp9-nsp12 interaction are overlapped, it is likely that the homodimeric form of nsp9 exists after it is immediately translated and that an intermediate from dimer to monomer is necessary for the further assembly of nsp9 into cap(−1)′-RTC. Moreover, the orientation of nsp13 in cap(−1)′-RTC changes compared with its orientation in E-RTC, though there is no direct association between nsp9 and nsp13. The function underlying the structural rearrangement of helicase in the RTCs during RTC warrants further investigation.
Finally, nsp12 NiRAN plays an essential role in mRNA synthesis of SARS-CoV-2. Because the binding pocket of the N-terminal peptide of nsp9 in nsp12 NiRAN (region 1) is a deep groove, it is conceivable that a reagent that occupies this groove with higher binding affinity may inhibit mRNA synthesis of SARS-CoV-2. In this pocket, the hydrophilic residues would play a central role to stabilize the interaction of a potential inhibitor. Moreover, a compound that can bind to the GDP binding site in nsp12 NiRAN catalytic center, e.g., a nucleotide analog (possibly in a diphosphate form), would also be likely to function as an inhibitor. Thus, this complex is a potential new target for antiviral development against SARS-CoV-2.
STAR★Methods
Key Resources Table
| REAGENT or RESOURCE | SOURCE | IDENTIFIER |
|---|---|---|
| Bacterial and Virus Strains | ||
| E. coli TOP10 | WEIDI | Cat#DL1010S |
| E. coli BL21 (DE3) | TIANGEN | Cat#CB105 |
| Chemicals, Peptides, and Recombinant Proteins | ||
| NaCl | GENERAL-REAGENT | Cat#7647145 |
| MgCl2 | AMRESCO | Cat#7791186 |
| TRIS | AMRESCO | Cat#77861 |
| HEPES | AMRESCO | Cat#7365459 |
| (α-32P)-GTP | PerkinElmer | Cat#NEG506H250UC |
| Deposited Data | ||
| cap(−1)’-RTC EM map | This paper | EMD: 30504 |
| cap(−1)’-RTC coordinate | This paper | PDB: 7CYQ |
| Oligonucleotides | ||
| Template RNA: 5′-CAUGCCAUGGCCUCU AAAAUGUCAGCUGCUCCCUAGCAUGCUA CUACCGCGUAGCAUG-3′ |
Takara | N/A |
| Primer RNA: 5′-GCGGUAGUAGCAUGC UAGGGAGCAG-3′ |
Takara | N/A |
| Recombinant DNA | ||
| pET22b-nsp12 | This paper | N/A |
| pET22b-nsp7 | This paper | N/A |
| pET28b-SUMO-nsp8 | This paper | N/A |
| pET28a-nsp13 | This paper | N/A |
| pET28a-nsp9 | This paper | N/A |
| Software and Algorithms | ||
| SerialEM | (Mastronarde, 2005) | https://bio3d.colorado.edu/SerialEM |
| MotionCor2 | (Zheng et al., 2017) | https://emcore.ucsf.edu/ucsf-software |
| RELION 3.0 | (Scheres, 2012) | https://www3.mrc-lmb.cam.ac.uk/relion |
| cryoSPARC | (Punjani et al., 2017) | https://cryosparc.com/ |
| UCSF Chimera | (Pettersen et al., 2004) | https://www.cgl.ucsf.edu/chimera |
| COOT | (Emsley et al., 2010) | https://www.cgl.ucsf.edu/chimera |
| PHENIX | (Afonine et al., 2018) | https://www.phenix-online.org |
| PyMOL | Schrodinger, LLC | Schrodinger |
| ImageJ Fiji distribution | (Schindelin et al., 2012) | https://imagej.net/Fiji |
| GraphPad Prism | GraphPad | https://www.graphpad.com/scientific-software/prism/ |
| Other | ||
| Superdex-200 10/300 Increase | GE Healthcare | Cat#28990944 |
| Hitrap-Q HP | GE Healthcare | Cat#17115401 |
| Hitrap-SP HP | GE Healthcare | Cat#17115201 |
| Mono-Q 5/50 GL | GE Healthcare | Cat#17516601 |
| 10 kDa cutoff concentrators | Millipore | Cat#UFC901096 |
| 100 kDa cutoff concentrators | Millipore | Cat#UFC910096 |
| R0.6/1.0 200 mesh Cu holey carbon grids | Quantifoil | Cat#Q250CR-06 |
Resource Availability
Lead Contact
Further information and requests for resources and reagents should be directed to and will be fulfilled by the Lead Contact, Zihe Rao (raozh@tsinghua.edu.cn).
Materials Availability
This study did not generate new unique reagents.
Data and Code Availability
The cryo-EM density map and the structure were deposited into the Electron Microscopy Data Bank (EMDB) and Protein Data Bank (PDB) with the accession numbers 30504 and 7CYQ. Additional supplemental items are available from Mendeley Data at https://doi.org/10.17632/3t26cmw7k2.1.
Experimental Model and Subject Details
Proteins were obtained through recombinant expression in E. coli BL21 (DE3).
Method Details
Protein production and purification
The gene for SARS-CoV-2 nsp9 possessing a 6 × His-tag N terminus was cloned into a modified pET-28b-SUMO vector. E. coli strain BL21 (DE3) cells were then transformed by inclusion of this vector. The cells were grown to an optical density (OD600) of 0.8 at 37°C, and protein expression was then induced by addition of 0.2 mM isopropyl-β-D-thiogalactoside (IPTG). The culture was allowed to grow overnight at 16°C. The cells were centrifugation at 4,500 rpm for 10 min, and the pellets were resuspended in lysis buffer (20 mM HEPES, pH 7.0 and 150 mM NaCl) and homogenized with an ultra-high-pressure cell disrupter at 4°C. After homogenization, the lysate was centrifuged at 12,000 rpm for 30 min to remove cell debris. The fusion protein was purified by Ni-NTA (Novagen, USA) affinity chromatography and by application to a Superdex 200 10/300 Increase column (GE Healthcare, USA) in lysis buffer. Purified nsp9 was concentrated to 5 mg/mL and stored at 4°C.
Full-length SARS-CoV-2 nsp7 and nsp8 were co-expressed in E. coli BL21 (DE3) cells as a no-tagged protein and a 6 × His-SUMO fusion protein, respectively. After purification by Ni-NTA (Novagen, USA) affinity chromatography, the nsp7-nsp8 complex was eluted through on-column tag cleavage by ULP protease. The complex was further purified by using a Hitrap Q ion-exchange column (GE Healthcare, USA) and a Superdex 200 10/300 Increase column (GE Healthcare, USA) in a buffer containing 20 mM Tris-HCl, pH 7.5, 250 mM NaCl, 4 mM MgCl2.
The SARS-CoV-2 nsp12 (GenBank: MN908947) gene was cloned into a modified pET-22b vector, with the C terminus possessing a 10 × His-tag. E. coli BL21 (DE3), were transformed by inclusion of these plasmids. The transformed cells were cultured at 37°C in LB media containing 100 mg/L ampicillin. After the OD600 reached 0.8, the culture was cooled to 16°C and supplemented with 0.5 mM IPTG. After overnight induction, the cells were harvested through centrifugation, and the pellets were resuspended in buffer 1 (20 mM Tris-HCl, pH 8.0, 150 mM NaCl, 4 mM MgCl2, 10% glycerol) and homogenized with an ultra-high-pressure cell disrupter at 4°C. The insoluble material was removed by centrifugation at 14,000 rpm, 50 min. The fusion protein was first purified by Ni-NTA (Novagen, USA) affinity chromatography and then further purified by passage through a Hitrap Q ion-exchange column (GE Healthcare, USA) with buffer A (20 mM Tris-HCl, pH 8.0, 4 mM MgCl2, 10% glycerol, 4 mM DTT) and buffer B (20 mM Tris-HCl, pH 8.0, 1M NaCl, 4 mM MgCl2, 10% glycerol, 4 mM DTT). Then it was loaded onto a Superdex 200 10/300 Increase column (GE Healthcare, USA) with buffer 2 (20 mM Tris-HCl, pH 7.5, 250 mM NaCl 4 mM MgCl2, 2 mM GDP and 2 mM BeF3 -). Purified nsp12 was concentrated to 4.8 mg/mL and stored at 4°C.
The SARS-CoV-2 nsp13 (GenBank: MN908947) gene was inserted into the modified pET-28a vector with a 6 × His tag attached at its N terminus. E. coli BL21 (DE3) cells were then transformed by introduction of this plasmid. Bacteria were grown in LB medium at 37°C until the OD600 was 0.8. Protein expression was induced by addition of 0.2 mM IPTG and grown at 16°C for 16-18 h. Cells were harvested and resuspended in buffer 3 (20 mM HEPES, pH 7.0, 150 mM NaCl, 4 mM MgCl2, 10% glycerol). The cells were centrifuged at 14,000 rpm for 40 min and then lysed by high-pressure homogenization and sonication. After purification by Ni-NTA (Novagen, USA) affinity chromatography, the protein eluted with 200 mM imidazole. The eluate was then further purified by Hitrap S ion-exchange column (GE Healthcare, USA) before loading onto a Superdex 200 10/300 Increase column (GE Healthcare, USA) in the buffer 4 (20 mM HEPES, pH 7.0, 150 mM NaCl, 4 mM MgCl2, 4mM DTT). Purified nsp13 was concentrated to 4 mg/mL and stored at 4°C.
Assembly of the extended E-RTC
To assemble C-RTC, nsp12 was incubated with nsp7 and nsp8 at 4°C for three h with a molar ratio of 1: 2: 2 in a buffer containing 20 mM Tris-HCl, pH 7.5, 250 mM NaCl and 4 mM MgCl2. Then the mixture was purified by mono Q 5/50 ion-exchange chromatography (GE Healthcare, USA), resulting in a stable nsp7-nsp8-nsp12 complex. A 58-mer oligoribonucleotide as the template and a 32-mer oligoribonucleotide as the primer were chemically synthesized by TAKARA (Figure 1A). The template and primer oligoribonucleotides were annealed by heating the solution to 70°C and gradually cooling to 4°C. The annealed RNA scaffold was incubated with nsp7-nsp8-nsp12 complex for 30 min at 25°C to form C-RTC. The mixture was incubated with 8 mg/mL nsp13 and pretreated with 2 mM GDP⋅BeF3 - and 5 mg/mL nsp9 for 30 min at 30°C to assemble the extended E-RTC.
Pyrophosphate assay
The pyrophosphate assays were performed as previously reported(Kottur and Nair, 2018; Yi et al., 2012) by using a Pyrophosphate Assay Kit (Sigma-Aldrich, Germany) following the manufacturer’s protocol. Assays were performed at room temperature (25°C) in a black 96-well plate. 50 μl kit Assay Buffer was supplemented with 3 μM nsp12 or relevant mutants, 3 μM nsp9 or relevant mutants and was first loaded into the black 96-well. 50 μl kit Master Reaction Mix containing PPi sensor was supplemented with 1 mM GTP or UTP and was subsequently loaded to form a 100 μl reaction system. The emitted fluorescence (excitation 316 nm, emission 456 nm) was measured every 30 s (Thermo Fluoroskan, ThermoFisher Scientific, USA) to yield the reaction curves. All measurements were performed in triplicate. The fitting function is the one-phase association in Graphpad Prism.
GTase activity assay
DNA fragments including the optimized T7 class II promoter Ф2.5 with ATP as initial nucleotide and 5′-ACCCCCCCCCCCCCCCCCCC-3′ were used as a template for in vitro transcription. We used the nsp12 and nsp13 and [α-32P]-GTP or [α-32P]-UTP to label the 5′ terminus of the RNA to G∗pppA-RNA. After reaction, the reaction systems were centrifuged at 14,000 rpm for 10 min, and the supernatant were spotted on polyethylenimine cellulose plates. To improve the efficiency of the reaction, 0.05 U inorganic pyrophosphatase (New England Biolabs, USA) was added in the reaction system. The marker G∗pppA-RNA was prepared with the Vaccinia capping system (except for SAM) (New England Biolabs, USA).
QExactive Mass Spectrometry Analysis
Proteins were separated by SDS-PAGE and the bands of interest were excised from the gel, reduced with 5 mM of dithiotreitol, and alkylated with 11 mM iodoacetamide. In-gel digestion was carried out with sequencing grade modified trypsin in 50 mM ammonium bicarbonate at 37°C overnight. The peptides were extracted twice with 0.1% trifluoroacetic acid in 50% acetonitrile aqueous solution for 30 min. Extracts were then centrifuged in a SpeedVac to concentrate the sample. Tryptic peptides were redissolved in 20 μL 0.1% TFA and analyzed by LC-MS/MS.
For LC-MS/MS analysis, the peptides were separated by a 85 min gradient elution at a flow rate 0.30 μL/min with a Thermo-Dionex Ultimate 3000 HPLC system, which was directly interfaced with a Thermo Scientific Q Exactive mass spectrometer. The analytical column was a home-made fused silica capillary column (75 μm ID, 150 mm length; Upchurch, Oak Harbor, WA) packed with C-18 resin (300 Å, 5 μm, Varian, Lexington, MA). Mobile phase A consisted of 0.1% formic acid, and mobile phase B consisted of 80% acetonitrile and 0.1% formic acid. The Q Exactive mass spectrometer was operated in data-dependent acquisition mode using Xcalibur 2.1.2 software and there was a single full-scan mass spectrum in the orbitrap (300-1800 m/z, 70,000 resolution) followed by 20 data-dependent MS/MS scans at 27% normalized collision energy (HCD).
The MS/MS spectra from each LC-MS/MS run were searched against the SARS-CoV-2 nsp9.fasta using an in-house Proteome Discoverer (Version PD1.4, Thermo-Fisher Scientific, USA). The search criteria were as follows: full tryptic specificity was required; two missed cleavage was allowed; Carbamidomethyl (C) were set as the fixed modifications; the oxidation (M) was set as the variable modification; precursor ion mass tolerances were set at 20 ppm for all MS acquired in an orbitrap mass analyzer; and the fragment ion mass tolerance was set at 0.02Da for all MS2 spectra acquired. The peptide false discovery rate (FDR) was calculated using Percolator provided by PD. When the q value was smaller than 1%, the peptide spectrum match (PSM) was considered to be correct. FDR was determined based on PSMs when searched against the reverse, decoy database. Peptides only assigned to a given protein group were considered as unique. The false discovery rate (FDR) was also set to 0.01 for protein identifications.
Cryo-EM sample preparation and data collection
In total, 3 μL of protein solution at 3 mg/mL (added with 0.025% DDM) was applied onto a H2/O2 glow-discharged, 200-mesh Quantifoil R0.6/1.0 grid (Quantifoil, Micro Tools GmbH, Germany). The grid was then blotted for 3.0 s with a blot force of 0 at 8°C and 100% humidity and plunge-frozen in liquid ethane using a Vitrobot (Thermo Fisher Scientific, USA). Cryo-EM data were collected with a 300 keV Titan Krios electron microscope (Thermo Fisher Scientific, USA) and a K3 direct electron detector (Gatan, USA). Images were recorded at 29000 × magnification and calibrated super-resolution pixel size 0.82 Å/pixel. The exposure time was set to 2 s with a total accumulated dose of 60 electrons per Å2. All images were automatically recorded using SerialEM (Mastronarde, 2005). A total of 4107 images were collected with a defocus range from −2.0 μm to −1.0 μm. Statistics for data collection and refinement are in Table S1.
Cryo-EM image processing
All dose-fractioned images were motion-corrected and dose-weighted by MotionCorr2 (Zheng et al., 2017) software and their contrast transfer functions were estimated by ctffind4 (Rohou and Grigorieff, 2015). A total of 529,588 particles were auto-picked using blob picker and extracted with a box size of 448 pixels in cryoSPARC (Punjani et al., 2017). The following 2D, 3D classifications and refinements were all performed in cryoSPARC. 188,021 particles were selected after two rounds of 2D classification based on the complex integrality. This particle set was used to do Ab-Initio reconstruction in six classes, which were then used as 3D volume templates for heterogeneous refinement, with 67,540 particles converged into one nsp12-nsp7-nsp82-nsp9-nsp132-RNA complex class. Next, these particles were imported into RELION 3.03 (Scheres, 2012) to perform local classification to obtain one class particle with final resolution 2.83 Å.
Model building and refinement
To solve the structure of SARS-CoV-2 mini RTC complex, the structure of the SARS-CoV-2 nsp12 and nsp7-8 complex (PDB: 7BTF), SARS-CoV-2 nsp13 (PDB: 6ZSL) and nsp9 (PDB: 6W9Q) were individually placed and rigid-body fitted into the cryo-EM map using UCSF Chimera (Pettersen et al., 2004). The model was manually built in Coot (Emsley et al., 2010) with the guidance of the cryo-EM map, and in combination with real space refinement using Phenix (Afonine et al., 2018). The data validation statistics are shown in Table S1.
Quantification and Statistical Analysis
In Figure 4C, the activity of nsp12 NiRAN domain in pyrophosphate assays were calculated by using GraphPad Prism as mean ± SD from three independent experiments as indicated in the legend of Figure 4C.
In Figure 4D, the integrate densities of the bands in lane 4-7, which are corresponding to apo-nsp12, nsp12 plus nsp9, nsp12 plus 2∗nsp9, and nsp12 plus 3∗nsp9, were calculated by IamgeJ Fiji distribution (Schindelin et al., 2012) as indicated in the legend of Figure 4D.
In Figure S1, resolution estimations of cryo-EM density maps are based on the 0.143 Fourier Shell Correlation (FSC) criterion (Chen et al., 2013; Rosenthal and Henderson, 2003).
Acknowledgments
We thank Prof. Haiteng Deng and Dr. Meng Han of Tsinghua University for their assistance for mass spectrum analysis. We also must express our gratitude to the Bio-Electron Microscopy Facility of ShanghaiTech University for data collection. This work was supported by the National Program on Key Research Project of China (2020YFA0707500 and 2017YFC0840300) and Tsinghua University Spring Breeze Fund.
Author Contributions
Z.R. and Z. Lou conceived the project and designed the experiments. L.Y., J.G., L.Z., Y.Z., Y.G., T.W., Y.Y., S.G., M.L., Z. Liu, H.W., and Y.L. performed experiments. L.Y., Y.H., Y.C., Q.W., Z. Lou, and Z.R. analyzed the data. Z.R., Z. Lou, L.Y., and L.W.G. wrote the manuscript. All authors discussed the experiments and read and approved the manuscript.
Declaration of Interests
The authors declare no competing interests.
Published: November 14, 2020
Footnotes
Supplemental Information can be found online at https://doi.org/10.1016/j.cell.2020.11.016.
Supplemental Information
References
- Afonine P.V., Klaholz B.P., Moriarty N.W., Poon B.K., Sobolev O.V., Terwilliger T.C., Adams P.D., Urzhumtsev A. New tools for the analysis and validation of cryo-EM maps and atomic models. Acta Crystallogr. D Struct. Biol. 2018;74:814–840. doi: 10.1107/S2059798318009324. [DOI] [PMC free article] [PubMed] [Google Scholar]
- Bost A.G., Carnahan R.H., Lu X.T., Denison M.R. Four proteins processed from the replicase gene polyprotein of mouse hepatitis virus colocalize in the cell periphery and adjacent to sites of virion assembly. J. Virol. 2000;74:3379–3387. doi: 10.1128/jvi.74.7.3379-3387.2000. [DOI] [PMC free article] [PubMed] [Google Scholar]
- Bouvet M., Debarnot C., Imbert I., Selisko B., Snijder E.J., Canard B., Decroly E. In vitro reconstitution of SARS-coronavirus mRNA cap methylation. PLoS Pathog. 2010;6:e1000863. doi: 10.1371/journal.ppat.1000863. [DOI] [PMC free article] [PubMed] [Google Scholar]
- Brockway S.M., Clay C.T., Lu X.T., Denison M.R. Characterization of the expression, intracellular localization, and replication complex association of the putative mouse hepatitis virus RNA-dependent RNA polymerase. J. Virol. 2003;77:10515–10527. doi: 10.1128/JVI.77.19.10515-10527.2003. [DOI] [PMC free article] [PubMed] [Google Scholar]
- Chan J.F., Yuan S., Kok K.H., To K.K., Chu H., Yang J., Xing F., Liu J., Yip C.C., Poon R.W., et al. A familial cluster of pneumonia associated with the 2019 novel coronavirus indicating person-to-person transmission: a study of a family cluster. Lancet. 2020;395:514–523. doi: 10.1016/S0140-6736(20)30154-9. [DOI] [PMC free article] [PubMed] [Google Scholar]
- Chen Y., Cai H., Pan J., Xiang N., Tien P., Ahola T., Guo D. Functional screen reveals SARS coronavirus nonstructural protein nsp14 as a novel cap N7 methyltransferase. Proc. Natl. Acad. Sci. USA. 2009;106:3484–3489. doi: 10.1073/pnas.0808790106. [DOI] [PMC free article] [PubMed] [Google Scholar]
- Chen S., McMullan G., Faruqi A.R., Murshudov G.N., Short J.M., Scheres S.H., Henderson R. High-resolution noise substitution to measure overfitting and validate resolution in 3D structure determination by single particle electron cryomicroscopy. Ultramicroscopy. 2013;135:24–35. doi: 10.1016/j.ultramic.2013.06.004. [DOI] [PMC free article] [PubMed] [Google Scholar]
- Chen J., Malone B., Llewellyn E., Grasso M., Shelton P.M.M., Olinares P.D.B., Maruthi K., Eng E.T., Vatandaslar H., Chait B.T., et al. Structural Basis for Helicase-Polymerase Coupling in the SARS-CoV-2 Replication-Transcription Complex. Cell. 2020;182:1560–1573.e13. doi: 10.1016/j.cell.2020.07.033. [DOI] [PMC free article] [PubMed] [Google Scholar]
- Chen N., Zhou M., Dong X., Qu J., Gong F., Han Y., Qiu Y., Wang J., Liu Y., Wei Y., et al. Epidemiological and clinical characteristics of 99 cases of 2019 novel coronavirus pneumonia in Wuhan, China: a descriptive study. Lancet. 2020;395:507–513. doi: 10.1016/S0140-6736(20)30211-7. [DOI] [PMC free article] [PubMed] [Google Scholar]
- Daffis S., Szretter K.J., Schriewer J., Li J., Youn S., Errett J., Lin T.Y., Schneller S., Zust R., Dong H., et al. 2′-O methylation of the viral mRNA cap evades host restriction by IFIT family members. Nature. 2010;468:452–456. doi: 10.1038/nature09489. [DOI] [PMC free article] [PubMed] [Google Scholar]
- Decroly E., Imbert I., Coutard B., Bouvet M., Selisko B., Alvarez K., Gorbalenya A.E., Snijder E.J., Canard B. Coronavirus nonstructural protein 16 is a cap-0 binding enzyme possessing (nucleoside-2'O)-methyltransferase activity. J. Virol. 2008;82:8071–8084. doi: 10.1128/JVI.00407-08. [DOI] [PMC free article] [PubMed] [Google Scholar]
- Egloff M.P., Ferron F., Campanacci V., Longhi S., Rancurel C., Dutartre H., Snijder E.J., Gorbalenya A.E., Cambillau C., Canard B. The severe acute respiratory syndrome-coronavirus replicative protein nsp9 is a single-stranded RNA-binding subunit unique in the RNA virus world. Proc. Natl. Acad. Sci. USA. 2004;101:3792–3796. doi: 10.1073/pnas.0307877101. [DOI] [PMC free article] [PubMed] [Google Scholar]
- Emsley P., Lohkamp B., Scott W.G., Cowtan K. Features and development of Coot. Acta Crystallogr. D Biol. Crystallogr. 2010;66:486–501. doi: 10.1107/S0907444910007493. [DOI] [PMC free article] [PubMed] [Google Scholar]
- Gao Y., Yan L., Huang Y., Liu F., Zhao Y., Cao L., Wang T., Sun Q., Ming Z., Zhang L., et al. Structure of the RNA-dependent RNA polymerase from COVID-19 virus. Science. 2020;368:779–782. doi: 10.1126/science.abb7498. [DOI] [PMC free article] [PubMed] [Google Scholar]
- Hillen H.S., Kokic G., Farnung L., Dienemann C., Tegunov D., Cramer P. Structure of replicating SARS-CoV-2 polymerase. Nature. 2020;584:154–156. doi: 10.1038/s41586-020-2368-8. [DOI] [PubMed] [Google Scholar]
- Ivanov K.A., Ziebuhr J. Human coronavirus 229E nonstructural protein 13: characterization of duplex-unwinding, nucleoside triphosphatase, and RNA 5′-triphosphatase activities. J. Virol. 2004;78:7833–7838. doi: 10.1128/JVI.78.14.7833-7838.2004. [DOI] [PMC free article] [PubMed] [Google Scholar]
- Ivanov K.A., Thiel V., Dobbe J.C., van der Meer Y., Snijder E.J., Ziebuhr J. Multiple enzymatic activities associated with severe acute respiratory syndrome coronavirus helicase. J. Virol. 2004;78:5619–5632. doi: 10.1128/JVI.78.11.5619-5632.2004. [DOI] [PMC free article] [PubMed] [Google Scholar]
- Jin X., Chen Y., Sun Y., Zeng C., Wang Y., Tao J., Wu A., Yu X., Zhang Z., Tian J., Guo D. Characterization of the guanine-N7 methyltransferase activity of coronavirus nsp14 on nucleotide GTP. Virus Res. 2013;176:45–52. doi: 10.1016/j.virusres.2013.05.001. [DOI] [PMC free article] [PubMed] [Google Scholar]
- Kleiger G., Grothe R., Mallick P., Eisenberg D. GXXXG and AXXXA: common α-helical interaction motifs in proteins, particularly in extremophiles. Biochemistry. 2002;41:5990–5997. doi: 10.1021/bi0200763. [DOI] [PubMed] [Google Scholar]
- Korhonen H.J., Conway L.P., Hodgson D.R. Phosphate analogues in the dissection of mechanism. Curr. Opin. Chem. Biol. 2014;21:63–72. doi: 10.1016/j.cbpa.2014.05.001. [DOI] [PubMed] [Google Scholar]
- Kottur J., Nair D.T. Pyrophosphate hydrolysis is an intrinsic and critical step of the DNA synthesis reaction. Nucleic Acids Res. 2018;46:5875–5885. doi: 10.1093/nar/gky402. [DOI] [PMC free article] [PubMed] [Google Scholar]
- Lehmann K.C., Gulyaeva A., Zevenhoven-Dobbe J.C., Janssen G.M., Ruben M., Overkleeft H.S., van Veelen P.A., Samborskiy D.V., Kravchenko A.A., Leontovich A.M., et al. Discovery of an essential nucleotidylating activity associated with a newly delineated conserved domain in the RNA polymerase-containing protein of all nidoviruses. Nucleic Acids Res. 2015;43:8416–8434. doi: 10.1093/nar/gkv838. [DOI] [PMC free article] [PubMed] [Google Scholar]
- Li Q., Guan X., Wu P., Wang X., Zhou L., Tong Y., Ren R., Leung K.S.M., Lau E.H.Y., Wong J.Y., et al. Early Transmission Dynamics in Wuhan, China, of Novel Coronavirus-Infected Pneumonia. N. Engl. J. Med. 2020;382:1199–1207. doi: 10.1056/NEJMoa2001316. [DOI] [PMC free article] [PubMed] [Google Scholar]
- Littler D.R., Gully B.S., Colson R.N., Rossjohn J. Crystal Structure of the SARS-CoV-2 Non-structural Protein 9, Nsp9. iScience. 2020;23:101258. doi: 10.1016/j.isci.2020.101258. [DOI] [PMC free article] [PubMed] [Google Scholar]
- Mastronarde D.N. Automated electron microscope tomography using robust prediction of specimen movements. J. Struct. Biol. 2005;152:36–51. doi: 10.1016/j.jsb.2005.07.007. [DOI] [PubMed] [Google Scholar]
- Miknis Z.J., Donaldson E.F., Umland T.C., Rimmer R.A., Baric R.S., Schultz L.W. Severe acute respiratory syndrome coronavirus nsp9 dimerization is essential for efficient viral growth. J. Virol. 2009;83:3007–3018. doi: 10.1128/JVI.01505-08. [DOI] [PMC free article] [PubMed] [Google Scholar]
- Pettersen E.F., Goddard T.D., Huang C.C., Couch G.S., Greenblatt D.M., Meng E.C., Ferrin T.E. UCSF Chimera--a visualization system for exploratory research and analysis. J. Comput. Chem. 2004;25:1605–1612. doi: 10.1002/jcc.20084. [DOI] [PubMed] [Google Scholar]
- Punjani A., Rubinstein J.L., Fleet D.J., Brubaker M.A. cryoSPARC: algorithms for rapid unsupervised cryo-EM structure determination. Nat. Methods. 2017;14:290–296. doi: 10.1038/nmeth.4169. [DOI] [PubMed] [Google Scholar]
- Rohou A., Grigorieff N. CTFFIND4: Fast and accurate defocus estimation from electron micrographs. J. Struct. Biol. 2015;192:216–221. doi: 10.1016/j.jsb.2015.08.008. [DOI] [PMC free article] [PubMed] [Google Scholar]
- Rosenthal P.B., Henderson R. Optimal determination of particle orientation, absolute hand, and contrast loss in single-particle electron cryomicroscopy. J. Mol. Biol. 2003;333:721–745. doi: 10.1016/j.jmb.2003.07.013. [DOI] [PubMed] [Google Scholar]
- Scheres S.H. RELION: implementation of a Bayesian approach to cryo-EM structure determination. J. Struct. Biol. 2012;180:519–530. doi: 10.1016/j.jsb.2012.09.006. [DOI] [PMC free article] [PubMed] [Google Scholar]
- Schindelin J., Arganda-Carreras I., Frise E., Kaynig V., Longair M., Pietzsch T., Preibisch S., Rueden C., Saalfeld S., Schmid B., et al. Fiji: an open-source platform for biological-image analysis. Nat. Methods. 2012;9:676–682. doi: 10.1038/nmeth.2019. [DOI] [PMC free article] [PubMed] [Google Scholar]
- Seybert A., Posthuma C.C., van Dinten L.C., Snijder E.J., Gorbalenya A.E., Ziebuhr J. A complex zinc finger controls the enzymatic activities of nidovirus helicases. J. Virol. 2005;79:696–704. doi: 10.1128/JVI.79.2.696-704.2005. [DOI] [PMC free article] [PubMed] [Google Scholar]
- Sreelatha A., Yee S.S., Lopez V.A., Park B.C., Kinch L.N., Pilch S., Servage K.A., Zhang J., Jiou J., Karasiewicz-Urbańska M., et al. Protein AMPylation by an Evolutionarily Conserved Pseudokinase. Cell. 2018;175:809–821.e19. doi: 10.1016/j.cell.2018.08.046. [DOI] [PMC free article] [PubMed] [Google Scholar]
- Sutton G., Fry E., Carter L., Sainsbury S., Walter T., Nettleship J., Berrow N., Owens R., Gilbert R., Davidson A., et al. The nsp9 replicase protein of SARS-coronavirus, structure and functional insights. Structure. 2004;12:341–353. doi: 10.1016/j.str.2004.01.016. [DOI] [PMC free article] [PubMed] [Google Scholar]
- Tan W.J., Zhao X., Ma X.J., Wang W.L., Niu P.H., Xu W.B., Gao G.F., Wu G. A novel coronavirus genome identified in a cluster of pneumonia cases—Wuhan, China 2019−2020. China CDC Weekly. 2020;2:61–62. [PMC free article] [PubMed] [Google Scholar]
- van Dinten L.C., den Boon J.A., Wassenaar A.L., Spaan W.J., Snijder E.J. An infectious arterivirus cDNA clone: identification of a replicase point mutation that abolishes discontinuous mRNA transcription. Proc. Natl. Acad. Sci. USA. 1997;94:991–996. doi: 10.1073/pnas.94.3.991. [DOI] [PMC free article] [PubMed] [Google Scholar]
- van Dinten L.C., van Tol H., Gorbalenya A.E., Snijder E.J. The predicted metal-binding region of the arterivirus helicase protein is involved in subgenomic mRNA synthesis, genome replication, and virion biogenesis. J. Virol. 2000;74:5213–5223. doi: 10.1128/jvi.74.11.5213-5223.2000. [DOI] [PMC free article] [PubMed] [Google Scholar]
- Wang C., Horby P.W., Hayden F.G., Gao G.F. A novel coronavirus outbreak of global health concern. Lancet. 2020;395:470–473. doi: 10.1016/S0140-6736(20)30185-9. [DOI] [PMC free article] [PubMed] [Google Scholar]
- Wang Q., Wu J., Wang H., Gao Y., Liu Q., Mu A., Ji W., Yan L., Zhu Y., Zhu C., et al. Structural Basis for RNA Replication by the SARS-CoV-2 Polymerase. Cell. 2020;182:417–428.e13. doi: 10.1016/j.cell.2020.05.034. [DOI] [PMC free article] [PubMed] [Google Scholar]
- WHO . Dashboard; 2020. WHO Coronavirus Disease (COVID-19) [Google Scholar]
- Yan L., Zhang Y., Ge J., Zheng L., Gao Y., Wang T., Jia Z., Wang H., Huang Y., Li M., et al. Architecture of a SARS-CoV-2 mini replication and transcription complex. Nature Communications. 2020;11:5874. doi: 10.1038/s41467-020-19770-1. [DOI] [PMC free article] [PubMed] [Google Scholar]
- Yi Y.J., Sutovsky M., Kennedy C., Sutovsky P. Identification of the inorganic pyrophosphate metabolizing, ATP substituting pathway in mammalian spermatozoa. PLoS ONE. 2012;7:e34524. doi: 10.1371/journal.pone.0034524. [DOI] [PMC free article] [PubMed] [Google Scholar]
- Zheng S.Q., Palovcak E., Armache J.P., Verba K.A., Cheng Y., Agard D.A. MotionCor2: anisotropic correction of beam-induced motion for improved cryo-electron microscopy. Nat. Methods. 2017;14:331–332. doi: 10.1038/nmeth.4193. [DOI] [PMC free article] [PubMed] [Google Scholar]
- Zhu N., Zhang D., Wang W., Li X., Yang B., Song J., Zhao X., Huang B., Shi W., Lu R., et al. China Novel Coronavirus Investigating and Research Team A Novel Coronavirus from Patients with Pneumonia in China, 2019. N. Engl. J. Med. 2020;382:727–733. doi: 10.1056/NEJMoa2001017. [DOI] [PMC free article] [PubMed] [Google Scholar]
- Ziebuhr J. The coronavirus replicase. Curr. Top. Microbiol. Immunol. 2005;287:57–94. doi: 10.1007/3-540-26765-4_3. [DOI] [PMC free article] [PubMed] [Google Scholar]
Associated Data
This section collects any data citations, data availability statements, or supplementary materials included in this article.
Supplementary Materials
Data Availability Statement
The cryo-EM density map and the structure were deposited into the Electron Microscopy Data Bank (EMDB) and Protein Data Bank (PDB) with the accession numbers 30504 and 7CYQ. Additional supplemental items are available from Mendeley Data at https://doi.org/10.17632/3t26cmw7k2.1.