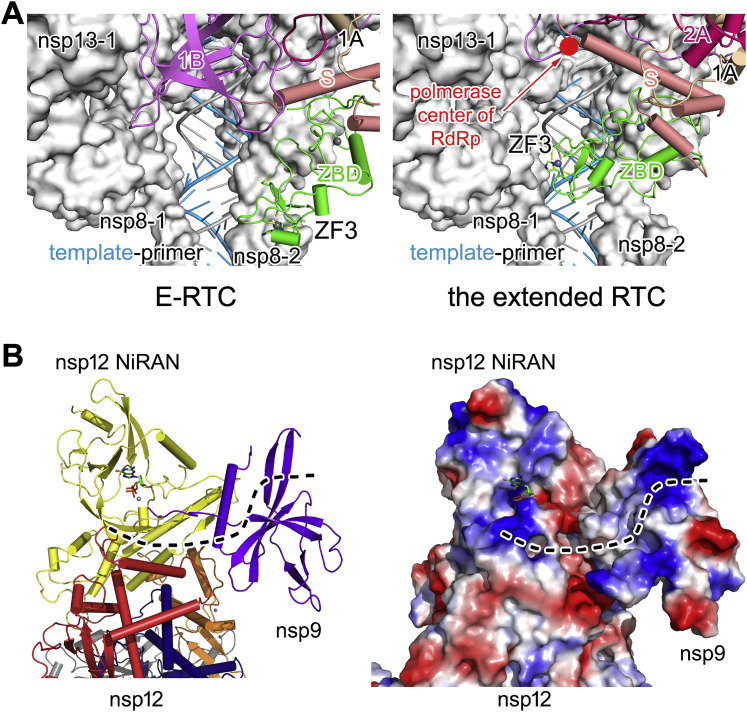
Figure S5.
The Conformational Difference of Nsp13-2 ZBD ZF3 and a Potential RNA-Binding Groove at the Nsp9-Nsp12 Interface, Related to Figures 5C, 5D, and 6
(A) nsp13-2 ZBD ZF3 conformational changes between in E-RTC compared to the extended E-RTC. The view is perpendicular to Figures 5C and 5D.
(B) A potential RNA binding groove. Nsp9 and nsp12 are displayed as colored cartoons in the left panel and are covered by electrostatic potential surfaces in the right panel. GDP bound to nsp12 NiRAN is shown as colored sticks to indicate the catalytic center of nsp12 NiRAN. The dashed lines indicate a potential RNA binding groove through nsp12 NiRAN to nsp9.

