Abstract
In the present paper, province-level variations of novel coronavirus (COVID-19) disease incidence across Iran were investigated. To this end, a geo-database from infected cases, deaths, total population, death-to-population ratio, and infected case-to-death ratio for 31 provinces of Iran and during seven successive periods of February 18–March 19 (P1), March 20–April 8 (P2), April 9–April 28 (P3), April 29–May 20 (P4), May 21–June 20 (P5), June 21–September 21 (P6), and September 22–October 21 (P7) of 2020 was built. Based on the last reports of the population and housing census (2018), Iran is home to 81.8 million people. Nationwide case series of 536,181 and 29,403 infected cases and deaths respectively with COVID-19 were reported to Iran’s Minister of Health from February 18 to October 21, 2020. Of the infected cases, 5.48% have died. The spatiotemporal patterns of COVID-19 were different throughout the 31 study provinces. Firstly, the central, north, and northwest of Iran were the main hosts of this virus. Shortly after, other parts of Iran, most notably the west and southwest regions, experienced a momentous rise in the numeral of infected cases and deaths. In the first study period, Tehran, West Azerbaijan, Mazandaran, Qom, and Gilan had the most infected cases (> 1000). In the second to fourth periods, the number of provinces with higher than 1000 infected cases, respectively, reached 12, 10, and 17. For the last three periods (P5–P7), 31 provinces were assigned higher than 1000 infected cases. Tehran had the most deaths with an increasing trend for all study periods among other provinces. The areas around Kohgiluyeh and Boyer-Ahmad, Bushehr, Chaharmahal and Bakhtiari, South Khorasan, and Ilam had the least death cases. The numbers of infected (death) cases in Iran for the first to seventh periods (P1–P7) respectively were 16,730 (1208), 41,285 (1595), 28,530 (1876), 16,366 (1856), 80,694 (6588), 201,585 (6232), and 128,336 (6953). The location quotient (LQ) index showed that most provinces of Iran have the LQ > 1 indicating a high degree of COVID-19 concentration in most of the province’s area in comparison with the nation, especially in the last study period (P7).
Keywords: 2019-nCoV, Environmental concern, GIS analysis, Infectious disease, Monitoring, Pattern change
Introduction
For history, several diseases had various consequences on different aspects of human well-being and changed the social, economic, technological, ecological, and human behavior styles at global and local scales (Garchitorena et al. 2017). For example, it could be said that the pandemic diseases of Plague of Justinian (541–542), The Black Death (1346–1353), and HIV/AIDS (at its peak, 2005–2012) killed some 25, 75–200, 20–50, and 36 million people around the world (e.g., Cohn and Weaver 2006; Wagner et al. 2014). Today, the world has faced zoonotic coronavirus disease 2019 (also called COVID-19 or 2019-nCoV or β-coronavirus) that is recognized as a novel, pandemic, atypical pneumonia, and public health emergency of international concern (Binti Hamzah et al. 2020). COVID-19 is a new kind of coronavirus which was beforehand known as 2019-nCoV in the directives of the World Health Organization (WHO) (Binti Hamzah et al. 2020). This disease is initiated by Wuhan, the capital of Hubei Province, on December 31, 2019. COVID-19 has been long-lasting for about 10 months, and its pandemic nature was declared by WHO on March 11, 2020. In a report published on August 5, 2020, WHO has proved that more than 210 countries are challenging with COVID-19, with a total of 18,354,342 cases and 696,147 deaths (WHO 2020b). Undoubtedly, with this severe spreading around the world, it influences the diverse dimensions of human life. Liu et al. (2020a) conducted a review regarding the primary reproduction number (R0) of the COVID-19 virus. They found that mean R0 was around 3.28, with a median of 2.79 and interquartile range (IQR) of 1.16, indicating an increase in the number of infected probability that is in line with the estimation of WHO reported the reproduction number of 1.95. It is interesting to note that the people aged 30–79 years old are more at risk of severe disease and if they have serious health problems, such as heart, diabetes, respiratory, and cancer diseases, they will be very vulnerable to COVID-19 that is confirmed by Liu et al. (2020b).
In line with WHO objectives, different studies and researches started to publish the essential information and statistical analysis on COVID-19. For instance, under CoronaTracker community funding, Binti Hamzah et al. (2020) predicted COVID-19 cases, deaths, and recoveries through predictive modeling, globally. They used the Susceptible-Exposed-Infected-Removed (SEIR) system for analyzing the data of 240 days from January 20 to March 3, 2020. The results showed an increasing steadily trend in the total number of confirmed cases for all countries and regions. According to this study, the cases increased rapidly with significant outbreaks in South Korea, Italy, Iran, and the USA. Sharma and Verma (2020) also applied Medical Geographic Information Systems (Medical GIS) to zoning the five parameters of the total number of infected cases country-wise; country-wise air passenger’s pressure from top 10 busy airports of China including Wuhan; world population density, world meat consumption; world health ranking (country-wise). Finally, they developed a global alertness scale to combat the pandemic COVID-19. They found that China, Japan, South Korea, Iran, Greece, Italy, Germany, Netherlands, France, Spain, the UK, Canada, the USA, and Australia are at a high risk and prone to critical outburst pandemic.
Besides, Yang et al. (2020) integrated population migration data of Hubei, Guangdong, and Zhejiang provinces in China before and after January 23, 2020, and most updated COVID-19 epidemiological data into the SEIR model to derive the epidemic curve. They also predicted the epidemic using the long-short-term memory (LSTM) model. The results proved that Guangdong and Zhejiang were the two most affected provinces after Hubei. However, the slowed epidemic growth in these two provinces compared to Hubei was found that proved the usefulness of quarantine and control actions. It was also found that the migration index out of Guangdong and Zhejiang provinces was higher than the inflow and was largest between January 7 and 23, 2020. Huang et al. (2020) also analyzed the spatial-temporal distribution of COVID-19 in China using the Moran index. Their analysis of the data extended from January 13 to March 9, 2020, showed that COVID-19 had a significant spatial correlation in China. The COVID-19 condition in Hubei Province is more severe than others, and the existing transmission still showed a growing tendency. They concluded that the epidemic could be successfully controlled since March 1, 2020. Besides, Murugesan et al. (2020) investigated the distribution and trend analysis of COVID-19 in India. The most extensive spread of infectious issues due to COVID-19 cases has been amplified daily. Delhi, Gujarat, Telangana, Uttar Pradesh (city), and Rajasthan (city) were the most affected areas. Chen et al. (2020) also studied the distribution of COVID-19 and the correlation with population emigration from Wuhan, China. According to their results, the correlation coefficient between the provincial number of cases and emigration from Wuhan was to be 0.943 with a significant relationship.
Mollalo et al. (2020) compiled a geo-database of 35 variables to explain the spatial variability of COVID-19 incidence in the USA. They suggest that a combination of four variables of median household income, income inequality, percentage of nurse practitioners, and percentage of black female population could explain a relatively high variability of the disease incidence in the continental United States. Besides, Ramírez-Aldana et al. (2020) studied the spatial distribution of COVID-19 cases in Iran. They identified significant spatial clusters of cases and the effect of socio-economic features of Iranian provinces on the number of cases. They found a spatial correlation within Iranian provinces in terms of COVID-19. The main determinant factors in COVID-19 spreading are older age, high degrees of urbanization, province interconnectedness, higher average temperatures, lower literacy rates, and the physician’s numbers. Ahmadi et al. (2020) analyzed the effect of nine climatology parameters on COVID-19 outbreak in Iran between February 19 and March 22, 2020. They reached a direct correlation (P < 0.05) between the number of infected people, population density, movement, and days of infection and an inverse correlation (P > 0.05) between humidity and solar radiation with infection rate. As the literature review showed that different studies had been carried out on the different dimensions of COVID-19, all of them emphasized conducting more researches and updating the scientific outlooks on this virus. Since information from articles played an essential role in empowering authorities and peoples during an epidemic period, the present paper has been conducted to conclude on the number, density, and trend of cases and deaths that occurred due to COVID-19 in Iran from its emergence time up to now. The results help to interpret the governing spatial-temporal patterns and trends and to provide a rapid information source around the spatial dynamics of COVID-19.
Case study
The analysis of the present study has been conducted for Iran (The Islamic Republic of), the second largest nation in the Middle East, Asia. This country had a total area of 1,873,959 km2. Different climates of arid, semi-arid, cold semi-arid, hyper-arid, and subtropical have been governed in different parts of Iran (Modarres and Silva 2007). According to the political conditions, Iran has been divided into 31 provinces (Table 1). The first symptoms of COVID-19 in Iran (Qom Province that imported from Wuhan, China) were observed on February 19, 2020. Some research mentioned Iran as one of the most affected countries, globally, almost among the first fifth countries (e.g., Sharma and Verma 2020; Binti Hamzah et al. 2020). As Shojaee et al. (2020) reported that the countries with the highest number of confirmed cases and deaths after China are Italy, Iran, and South Korea. It was also confirmed that these countries had the uppermost number of days of involvement with the virus than most countries. The mortality rates were also reported between 5.19 and 10.76, indicating the high risk of Iran (Shojaee et al. 2020). Based on the latest WHO (2020b) report, Iran, with total confirmed cases of 314,786 and total deaths of 17,617, stands at the first rank among Eastern Mediterranean countries.
Table 1.
Used provinces for spatial analysis of COVID-19 in Iran
| No. used in the figures | Province | No. used in the figures | Province |
|---|---|---|---|
| 1 | Ardabil | 17 | Zanjan |
| 2 | East Azerbaijan | 18 | Lorestan |
| 3 | West Azerbaijan | 19 | Hamadan |
| 4 | Kurdistan | 20 | Chaharmahal and Bakhtiari |
| 5 | Kermanshah | 21 | Kohgiluyeh and Boyer-Ahmad |
| 6 | Ilam | 22 | Fars |
| 7 | Khuzestan | 23 | Kerman |
| 8 | Bushehr | 24 | Yazd |
| 9 | Hormozgan | 25 | Semnan |
| 10 | Sistan and Baluchestan | 26 | Tehran |
| 11 | South Khorasan | 27 | Alborz |
| 12 | Razavi Khorasan | 28 | Qazvin |
| 13 | North Khorasan | 29 | Markazi |
| 14 | Golestan | 30 | Isfahan |
| 15 | Mazandaran | 31 | Qom |
| 16 | Gilan | - | - |
Data sources and analysis
COVID-19 pneumonia was analyzed for spatial and temporal changes throughout 31 provinces of Iran from February 18 to October 21, 2020. In this regard, a geo-database from infected cases, deaths, total population, death-to-population ratio, and infected case-to-death ratio was built. The primary data on the COVID-19 information was derived from Iran’s Minister of Health (http://ird.behdasht.gov.ir/), and the population at the province level is collected from the latest reports of the national census of population and housing (https://www.amar.org.ir/). For better analysis, the obtained data were divided into seven periods (P1–P7), viz., February 18–March 19, March 20–April 8, April 9–April 28, April 29–May 20, May 21–June 20, June 21–September 21, and September 22–October 21 of 2020 (Table 2). Finally, all data was introduced to the ArcGIS 10.6 environment, and all essential mapping and charts have been provided and drawn.
Table 2.
Used time periods for temporal analysis of COVID-19 in Iran for 2020
| Symbols used in the figures | P1 | P2 | P3 | P4 | P5 | P6 | P7 |
|---|---|---|---|---|---|---|---|
| Period | February 18–March 19 | March 20–April 8 | April 9–April 28 | April 29–May 20 | May 21–June 20 | June 21–September 21 | September 22–October 21 |
In addition, location quotient (LQ) was computed to measure the geographic concentration of COVID-19 within Iran. LQ could dedicate the uniqueness of a specific province compared to the national average (Florence 1939; Walter 1992; Vandoros et al. 2013; Photis 2016). In this respect, an “Area LQ” for COVID-19 throughout the 31 provinces of Iran was calculated using Eq. 1 (Walter 1992; Vandoros et al. 2013; Photis 2016).
| 1 |
LQ > 1 and LQ < 1 values, respectively, represent the high and low degrees of COVID-19 concentration in a province compared to the whole country, respectively. As well, if the LQ would be equal to 1, it indicates that the concentration is the same as the national average (Walter 1992; Vandoros et al. 2013; Photis 2016).
In addition, in the present study, the spatial autocorrelation (Global Moran’s I) tool was used to measure the spatial autocorrelation based on both feature locations and feature values, simultaneously. Global Moran’s I, according to the set of features and an associated attribute, evaluates whether the COVID-19 pattern is clustered, dispersed, or random (Huang et al. 2020) Equation 2 was used for Global Moran’s I calculation as suggested by Legendre and Legendre (1998).
| 2 |
Here, n is the total number of points, W is the number of pairs of points having distances within the distance class, and whi is a weight function such that whi = 1 if points h and i are within the distance class and whi = 0 otherwise (Kronecker delta). The range of the Moran index is varied from − 1 to + 1. Values of − 1, + 1, and 0 respectively mean negative, positive, and no spatial correlation in COVID-19 between different provinces.
Results and discussion
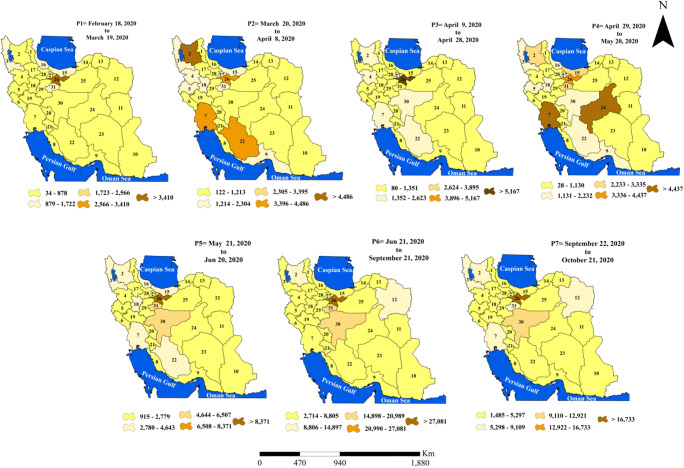
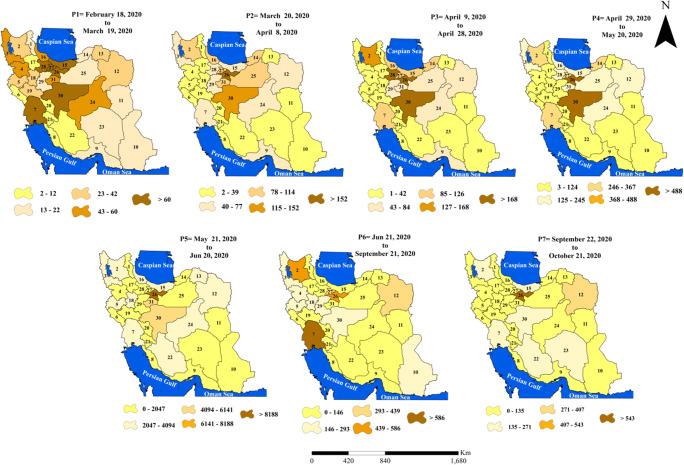
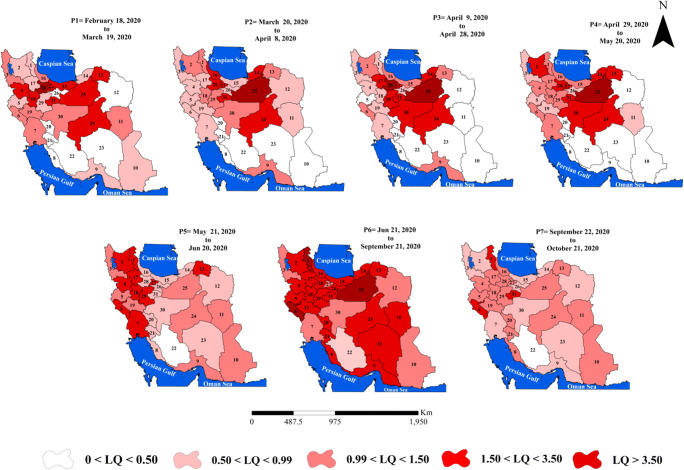
Figure 1 shows the mapping of infected cases from COVID-19 during seven different periods for Iran. The first cases reported by Iran were related to Qom that may be transformed from two merchants who had traveled to China. The results of the study stated that over 536,181 infected and 29,403 death cases had been reported during the first 250 days of the COVID-19 outbreak in Iran, leading to unique socio-economic concerns in the country. A high number of cases and a rapid increase were observed for Iran. COVID-19 infected cases in Iran are well over 16,750 as of March 19, 2020. As seen in Figs. 1 and 2, infected and death cases demonstrated different spatiotemporal patterns at the province level. For example, in the first period (P1), only five provinces, i.e., Tehran (4254), West Azerbaijan (1704), Mazandaran (1371), Qom (1238), and Gilan (1105), have more than 1000 infected cases. However, in the second period (P2), the provinces with more than 1000 infected cases reached 12 provinces, including East Azerbaijan, Tehran, Khuzestan, Fars, Lorestan, West Azerbaijan, Kermanshah, Kurdistan, Alborz, Mazandaran, Hormozgan, and Qom (Fig. 1). In the third period (P3), the total infected cases (28,530) are interim controlled compared to the second period (41,285). The provinces with more than 1000 infected cases during the fourth period (P4) were limited to Tehran, Khuzestan, Alborz, Fars, Isfahan, East Azerbaijan, Khuzestan, Mazandaran, Qom, and West Azerbaijan which were respectively having 6439, 1821, 1725, 1628, 1408, 1399, 1362, 1341, 1088, and 1071 cases. In the fourth period (P4), again, a high increase in infected cases was observed throughout the whole country, mainly ranging from 28 (Hamedan) to 5540 (Khuzestan). The provinces with more than 1000 infected cases were reached 17 of 31 provinces that are mainly having large areas. Furthermore, provinces of Qazvin, Khorasan Razavi, Sistan-Baluchestan, Kerman, and Golestan include 500–1000 infected cases in the fourth study period (P4). After that, the whole 31 provinces of the country are covered by more than 1000 infected cases (except Hamedan that has 915 infected cases in the fifth period (P5)). So, that in the fifth period (P5), provinces of Tehran (10,235), Qom (6125), and Isfahan (5294) have more than 5000 infected cases. Then, in the sixth study period (P6), five provinces, i.e., Tehran (33,173), Qom (16,518), Isfahan (15,200), East Azerbaijan (11,582), and Khorasan Razavi (11,266), impacted by more than 10,000 infected cases. Finally, in the last period (P7), the infected cases were decreased compared to those in the sixth period (P6). It was related to the longer time of P6. Anyhow, Tehran, with 20,545 and 998 infected and death cases, stands at the highest rank. Notably, Khorasan Razavi in the two last periods (P6 and P7) is the second most affected province with more than 1000 infected and more than 400 death cases. Mashhad is the capital city of this province, and it is the second largest holy city in the world, where annually it is a host of more than 20 million tourists and pilgrims (Arab-Mazar et al. 2020). Ahmadi et al. (2020) attributed the high susceptibility of Tehran, Mazandaran, Alborz, Gilan, and Qom to the high population density, intra-provincial movements, and high humidity rate compared to the southern provinces of Iran.
Fig. 1.
Distribution of infected cases from COVID-19 for four study periods at the province-based scale
Fig. 2.
Distribution of death cases from COVID-19 for four study periods at the province-based scale
The prominent infected and death cases are observed in the west, north, and northwest of Iran (Figs. 1 and 2). This strange incidence is related to the cold climate of these regions during the winter and spring days (November–May), which was simultaneous with the spreading of COVID-19. This statement verified the results of Ma et al. (2020) who related the COVID-19 severity with the temperature in China. The data analysis showed the peak of existing infected cases of 41,285 and 201,585, arriving on the second and sixth study periods (P2 and P6, respectively). This finding is consistent with others that reported the increased number of infected COVID-19 during March, globally (Mollalo et al. 2020; Murugesan et al. 2020; WHO 2020a, b). This is related to the people who travel to the COVID-19-affected regions (Murugesan et al. 2020). It could be associated with several factors as Mollalo et al. (2020) stated that income inequality, median household income, the percentage of nurse practitioners, and the percentage of the black female population are the most significant factors affecting the spatial incidence of COVID-19 in the USA.
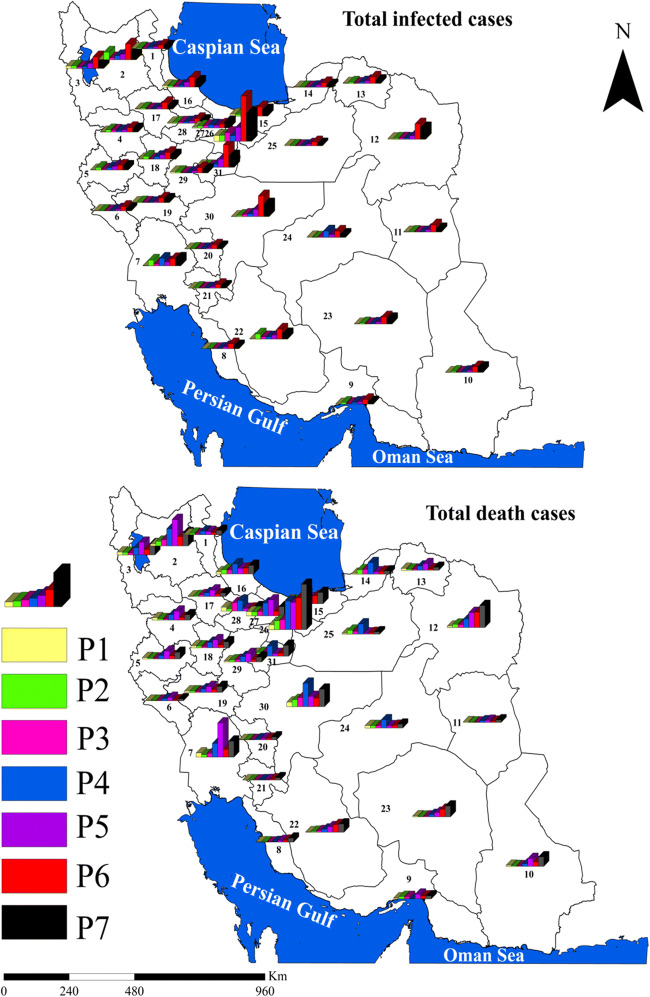
The prevalent extent of deaths due to COVID-19 has been increased daily from 1208 on March 19 to 6953 on October 20, 2020, where the reported increase in deaths is concentrated primarily (P1) in Tehran (100), Isfahan (98), Alborz (90), Khuzestan (90), Qazvin (82), and Mazandaran (80) (Figs. 2 and 3). Nevertheless, in the other six study periods (P2–P7), the death cases were extensively extended to other provinces of Iran (Figs. 2 and 3). From the GIS-based maps, it is clear that the maximum death cases were rated for Tehran and Isfahan with 100 and 98, 190 and 152, 210 and 198, and 610 and 502 deaths during the first to fourth periods (P1–P4).
Fig. 3.
Variations of total infected and death cases from COVID-19 for four study periods at the province-based scale
For the fifth and sixth periods (P5 and P6), the maximum infected cases were attributed to Tehran (10,235 and 6125) and Qom (33,173 and 16,518). The same statistics were reported for Tehran (20,545) and Isfahan (9300) for the last study period (P7). The maximum death cases were also rated for Tehran (768) and Khuzestan (765) in the fifth study period (P5). Ultimately, for the last two periods under consideration (P6 and P7), both Tehran and Khorasan Razavi, respectively, with the maximum death cases of 1010 and 409, and 998 and 510, were recognized as the most vulnerable provinces.
The total deaths during first to seventh periods (P1–P7) are observed as 1208, 1595, 1876, 1856, 5686, 6232, and 6953, respectively. Clearly, death rates have an increasing trend in the whole country. The increasing temporal trend of deaths verified that the COVID-19 spread speedily between people, as stated by Murugesan et al. (2020) who studied the spatial trend of COVID-19 in India. A decrease or a slower increase in temporal trend in infected people is shown during the study period for some provinces that indicates the effectiveness of rigorous government control policies such as isolation and protective procedures. However, the deaths were increased sharply after the fourth period (Fig. 3).
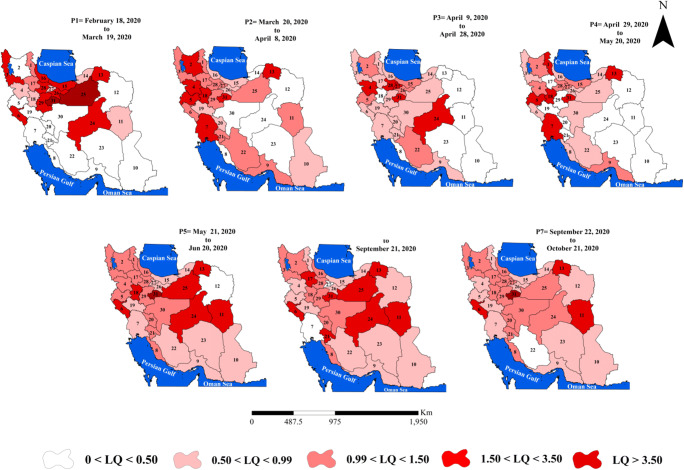
The relative concentration of COVID-19 in each province compared to the country was done using the LQ analysis. The LQ analysis (Tables 3 and 4) showed that most provinces of Iran have the LQ > 1 indicating a high degree of COVID-19 concentration in most of the area of the province compared to the nation (Figs. 4 and 5). Some provinces located in the north, northeast, northwest, central, south, southwest, and west were categorized in classes with a high LQ index (LQ ≥ 1.5) for the sixth period (P6), although these provinces are less affected by COVID-19 in the next period (P7). In these provinces that had the LQ less than 0.50 (i.e., located in the south, southeast, east, northeast, and east) in the previous period, now they are positively impacted by COVID-19 (0.99 ≤ LQ < 1.50). Twenty-four among 31 had been categorized in the class of 0.99 ≤ LQ < 1.50. In this period, only Qom had a very high LQ (i.e., LQ ≥ 1.50) and provinces of Kurdestan (west), Golestan (north), Chaharmahal and Bakhtiari, Kohgiluyeh and Boyer-Ahmad, Fars, and Hormozgan had attributed to 0.50 ≤ LQ < 0.99.
Table 3.
Location quotient (LQ) changes of total infected and death cases from COVID-19 at the province-based scale for Iran
| No. used in the figures | Province | LQdeath | LQinfected | No. used in the figures | Province | LQdeath | LQinfected |
|---|---|---|---|---|---|---|---|
| 1 | Ardabil | 1.58 | 1.01 | 17 | Zanjan | 1.47 | 1.43 |
| 2 | East Azerbaijan | 1.29 | 1.24 | 18 | Lorestan | 1.15 | 1.33 |
| 3 | West Azerbaijan | 0.92 | 1.09 | 19 | Hamadan | 0.98 | 0.67 |
| 4 | Kurdistan | 1.25 | 1.09 | 20 | Chaharmahal and Bakhtiari | 0.92 | 0.99 |
| 5 | Kermanshah | 0.94 | 1.04 | 21 | Kohgiluyeh and Boyer-Ahmad | 0.95 | 1.28 |
| 6 | Ilam | 1.68 | 1.85 | 22 | Fars | 0.42 | 0.67 |
| 7 | Khuzestan | 1.11 | 0.80 | 23 | Kerman | 0.63 | 0.60 |
| 8 | Bushehr | 0.75 | 1.00 | 24 | Yazd | 1.61 | 1.39 |
| 9 | Hormozgan | 0.77 | 0.83 | 25 | Semnan | 2.52 | 1.51 |
| 10 | Sistan and Baluchestan | 0.71 | 0.59 | 26 | Tehran | 0.80 | 0.93 |
| 11 | South Khorasan | 1.26 | 1.99 | 27 | Alborz | 1.28 | 0.85 |
| 12 | Razavi Khorasan | 0.68 | 0.59 | 28 | Qazvin | 1.93 | 1.21 |
| 13 | North Khorasan | 1.77 | 2.01 | 29 | Markazi | 1.35 | 1.05 |
| 14 | Golestan | 1.15 | 0.68 | 30 | Isfahan | 1.03 | 1.00 |
| 15 | Mazandaran | 0.94 | 0.96 | 31 | Qom | 2.00 | 4.26 |
| 16 | Gilan | 1.10 | 1.13 | - | - | - | - |
Table 4.
Distributions of populations, infected cases, deaths, and location quotient (LQ) through total study period at the province-based scale for Iran
| No. used in the figures | Province | Population | Total deaths | Total infected cases |
|---|---|---|---|---|
| 1 | Ardabil | 1,270,420 | 738 | 8579 |
| 2 | East Azerbaijan | 3,909,652 | 1851 | 32,567 |
| 3 | West Azerbaijan | 3,265,219 | 1104 | 23,942 |
| 4 | Kurdistan | 1,603,011 | 734 | 11,679 |
| 5 | Kermanshah | 1,952,434 | 677 | 13,562 |
| 6 | Ilam | 580,158 | 359 | 7217 |
| 7 | Khuzestan | 4,710,509 | 1920 | 25,158 |
| 8 | Bushehr | 1,163,400 | 320 | 7834 |
| 9 | Hormozgan | 1,776,415 | 500 | 9885 |
| 10 | Sistan and Baluchestan | 2,775,014 | 727 | 10,904 |
| 11 | South Khorasan | 768,898 | 355 | 10,243 |
| 12 | North Khorasan | 6,434,501 | 1616 | 25440 |
| 13 | Razavi Khorasan | 863,092 | 563 | 11,637 |
| 14 | Golestan | 1,868,819 | 794 | 8519 |
| 15 | Mazandaran | 3,283,582 | 1141 | 21,176 |
| 16 | Gilan | 2,530,696 | 1024 | 19,176 |
| 17 | Zanjan | 1,057,461 | 570 | 10,131 |
| 18 | Lorestan | 1,760,649 | 743 | 15,750 |
| 19 | Hamadan | 1738234 | 626 | 7823 |
| 20 | Chaharmahal and Bakhtiari | 947,763 | 320 | 6315 |
| 21 | Kohgiluyeh and Boyer-Ahmad | 713,052 | 250 | 6101 |
| 22 | Fars | 4,851,274 | 746 | 21,731 |
| 23 | Kerman | 3,164,718 | 736 | 12,728 |
| 24 | Yazd | 1,138,533 | 673 | 10,584 |
| 25 | Semnan | 702,360 | 650 | 7134 |
| 26 | Tehran | 13,267,637 | 3886 | 83,207 |
| 27 | Alborz | 2,712,400 | 1280 | 15,480 |
| 28 | Qazvin | 1,273,761 | 902 | 10,339 |
| 29 | Markazi | 1,429,475 | 712 | 10,084 |
| 30 | Isfahan | 5,120,850 | 1934 | 34,287 |
| 31 | Qom | 1,292,283 | 950 | 36,968 |
The data is derived from census statistical reports, 2018 (https://www.amar.org.ir/english), and Iran’s Minister of Health (http://ird.behdasht.gov.ir/)
Fig. 4.
Location quotient (LQ) changes of infected cases from COVID-19 for four study periods at the province-based scale
Fig. 5.
Location quotient (LQ) changes of death cases from COVID-19 for four study periods at the province-based scale
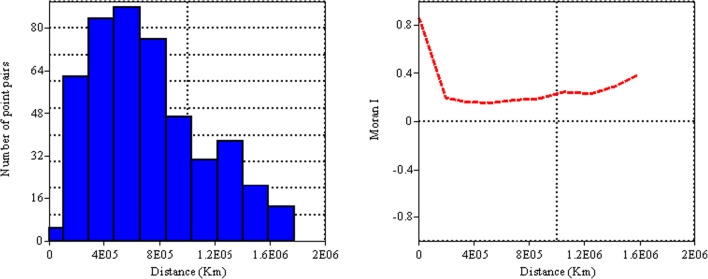
The results of the Moran index for testing the spatial autocorrelation of COVID-19 in Iran through February 18 to October 20 of 2020 are shown in Table 5 and Fig. 6. The Z-score values proved an existing correlation between provinces but not significant at the significance level of 5% for infected and death cases (P value > 0.78), spatially. In addition, the negative and close to zero values of the Moran index emphasized the spreading direction of COVID-19 in Iran.
Table 5.
Results of Moran index analysis
| Cases | Moran index | Z-score | P value |
|---|---|---|---|
| Infected | − 0.04 | − 0.22 | 0.82 |
| Death | − 0.03 | 0.29 | 0.78 |
Fig. 6.
Graphical results of the Moran index throughout Iran provinces
Conclusions
Since there is much uncertainty about the novel virus of COVID-19, worldwide, it is very beneficial to conduct studies that offer valuable spatiotemporal information about the global pandemic of the twenty-first century. Iran’s Minister of Health had reported that the total infected cases in 2020 for February 18–March 19 (P1) ca. 16,730, for March 20–April 8 (P2) ca. 41,285, for April 8–April 28 (P3) ca. 28,530, and for April 29–May (P4) ca. 16,366. In addition, the same statistics but with rapid increase were reported for May 21–June 20 (P5) ca. 80,694, for June 21–September 21 (P6) ca. 201,585, and for September 22–October 21 (P7) ca. 128,336 which total infected cases are equal to 536,181. In cases of deaths, Tehran had more deaths ranging from 100 to 1010 cases during the first to seventh study periods (P1–P7), and the areas around Kohgiluyeh and Boyer-Ahmad, Bushehr, Chaharmahal and Bakhtiari, South Khorasan, and Ilam have the least death cases in all study periods. The most populated provinces in Iran are Tehran, Khorasan Razavi, and Isfahan, with 13,267,637, 6,434,501, and 5,120,850 persons, respectively. The LQ results verified that almost provinces have a higher than average concentration of COVID-19. The Moran index is also showed no significant spatial correlation between 31 study provinces. Since COVID-19 pandemic is a risk for every country, the obtained results will help healthcare professionals during the pandemic COVID-19. The results obtained from spatiotemporal pattern analysis of COVID-19 could offer valuable information and statistics to support government monitoring and effective policy-making of associated agencies in medical, social, economic, and environmental aspects.
Authors’ contributions
Conceptualization, methodology, data curation, software, analysis, writing, review, and editing: Z. Hazbavi and R. Mostafazadeh; resources, data curation, software, analysis: N. Alaei and E. Azizi
Data availability
Available upon request.
Compliance with ethical standards
Ethical approval
Not applicable.
Consent to participate
Not applicable.
Consent to publish
Not applicable.
Competing interests
The authors declare that they have no competing interests.
Footnotes
Publisher’s note
Springer Nature remains neutral with regard to jurisdictional claims in published maps and institutional affiliations.
References
- Ahmadi M, Sharifi A, Dorosti S, Jafarzadeh Ghoushchi S, Ghanbari N. Investigation of effective climatology parameters on COVID-19 outbreak in Iran. Sci Total Environ. 2020;729:138705. doi: 10.1016/j.scitotenv.2020.138705. [DOI] [PMC free article] [PubMed] [Google Scholar]
- Arab-Mazar Z, Sah R, Rabaan AA, Dhama K, Rodriguez-Morales AJ. Mapping the incidence of the COVID-19 hotspot in Iran– implications for travellers. Travel Med Infect Dis. 2020;34:101630. doi: 10.1016/j.tmaid.2020.101630. [DOI] [PMC free article] [PubMed] [Google Scholar]
- Binti Hamzah FA, Lau C, Nazri H, Ligot DV, Lee G, Tan CL (2020) CoronaTracker: worldwide COVID-19 outbreak data analysis and prediction. [Preprint]. Bull World Health Organ. 10.2471/BLT.20.255695
- Chen ZL, Zhang Q, Lu Y, Guo ZM, Zhang X, Zhang WJ, Guo C, Liao CH, Li QL, Han XH, Lu JH (2020) Distribution of the COVID-19 epidemic and correlation with population emigration from Wuhan, China. Chin Med J. 10.1097/CM9.0000000000000782 [DOI] [PMC free article] [PubMed]
- Cohn SK, Weaver LT. The Black Death and AIDS: CCR5-Δ32 in genetics and history. QJM-Int J Med. 2006;99(8):497–503. doi: 10.1093/qjmed/hcl076. [DOI] [PubMed] [Google Scholar]
- Florence PS (1939) Report on the location of industry. Political and Economic Planning, London
- Garchitorena A, Sokolow SH, Roche B, Ngonghala CN, Jocque M, Lund A, Barry M, Mordecai EA, Daily GC, Jones JH, Andrews JR, Bendavid E, Luby SP, LaBeaud AD, Seetah K, Guégan JF, Bonds MH, de Leo GA. Disease ecology, health and the environment: a framework to account for ecological and socio-economic drivers in the control of neglected tropical diseases. Philos Trans R Soc Lond Ser B Biol Sci. 2017;372(1722):20160128. doi: 10.1098/rstb.2016.0128. [DOI] [PMC free article] [PubMed] [Google Scholar]
- Huang H, Liu M, Ding Y. Spatial-temporal distribution of COVID-19 in China and its prediction: a data-driven modeling analysis. J Infect Dev Countr. 2020;14(3):246–253. doi: 10.3855/jidc.12585. [DOI] [PubMed] [Google Scholar]
- Legendre P, Legendre L (1998) Numerical ecology, 2nd edn. Elsevier 853 pp
- Liu Y, Gayle AA, Wilder-Smith A, Rocklöv J (2020a) The reproductive number of COVID-19 is higher compared to SARS coronavirus. J Travel Medi 27(2). 10.1093/jtm/taaa021 [DOI] [PMC free article] [PubMed]
- Liu Z, Bing X, Zhi XZ. The epidemiological characteristics of an outbreak of 2019 novel coronavirus diseases (COVID-19) in China. Chin Center Dis Control Prev. 2020;41(2):145–151. doi: 10.3760/cma.j.issn.0254-6450.2020.02.003. [DOI] [PubMed] [Google Scholar]
- Ma Y, Zhao Y, Liu J, He X, Wang B, Fu S, Yan J, Niu J, Zhou J, Luo B (2020) Effects of temperature variation and humidity on the death of COVID-19 in Wuhan, China. Sci Total Environ 724:138226.10.1016/j.scitotenv.2020.138226 [DOI] [PMC free article] [PubMed]
- Modarres R, Silva VPR. Rainfall trends in arid and semi-arid regions of Iran. J Arid Environ. 2007;70:344–355. doi: 10.1016/j.jaridenv.2006.12.024. [DOI] [Google Scholar]
- Mollalo A, Vahedi B, Rivera KM. GIS-based spatial modeling of COVID-19 incidence rate in the continental United States. Sci Total Environ. 2020;728:138884. doi: 10.1016/j.scitotenv.2020.138884. [DOI] [PMC free article] [PubMed] [Google Scholar]
- Murugesan B, Karuppannan S, Mengistie AT, Ranganathan M, Gopalakrishnan G. Distribution and trend analysis of COVID-19 in India: geospatial approach. J Geogr Stud. 2020;4(1):1–9. doi: 10.21523/gcj5.20040101. [DOI] [Google Scholar]
- Photis YN. Disease and health care geographies: mapping trends and patterns in a GIS, Jordan. Health Sci J. 2016;10:3. [Google Scholar]
- Ramírez-Aldana R, Gomez-Verjan JC, BelloChavolla OY (2020) Spatial analysis of COVID-19 spread in Iran: insights into geographical and structural transmission determinants at a province level. medRxiv 2020.04.19. 20071605. 10.1101/2020.04.19.20071605 [DOI] [PMC free article] [PubMed]
- Sharma LK, Verma RK (2020) Latent blowout of COVID-19 globally: an effort to healthcare alertness via medical GIS approach. 10.1101/2020.04.27.20082503
- Shojaee S, Pourhoseingholi MA, Ashtari S, Vahedian-Azimi A, Asadzadeh-Aghdaei H, Zali MR. Predicting the mortality due to COVID-19 by the next month for Italy, Iran and South Korea; a simulation study. Gastroenterol Hepatol Bed Bench. 2020;13(2):177–179. [PMC free article] [PubMed] [Google Scholar]
- Vandoros S, Hessel P, Leone T, Avendano M. Have health trends worsened in Greece as a result of the financial crisis? A quasi-experimental approach. Eur J Pub Health. 2013;5:727–731. doi: 10.1093/eurpub/ckt020. [DOI] [PubMed] [Google Scholar]
- Wagner DM, Klunk J, Harbeck M, Devault A, Waglechner N, Sahl JW, Enk J, Birdsell DN, Kuch M, Lumibao C, Poinar D, Pearson T, Fourment M, Golding B, Riehm JM, Earn DJD, DeWitte S, Rouillard JM, Grupe G, Wiechmann I, Bliska JB, Keim PS, Scholz HC, Holmes EC, Poinar H. Yersinia pestis and the plague of Justinian 541-543 AD: a genomic analysis. Lancet Infect Dis. 2014;14(4):319–326. doi: 10.1016/S1473-3099(13)70323-2. [DOI] [PubMed] [Google Scholar]
- Walter SD. The analysis of regional patterns in health data. I. Distributional considerations. Am J Epidemiol. 1992;136:730–741. doi: 10.1093/oxfordjournals.aje.a116552. [DOI] [PubMed] [Google Scholar]
- World Health Organization (WHO) (2020a) Rolling updates on coronavirus disease (COVID-19). Retrieved from. https://www.who.int/emergencies/diseases/novel-coronavirus-2019/events-as-they-happen. Accessed 25 Oct 2020
- World Health Organization (WHO) (2020b) Coronavirus disease (COVID-19). Situation Report – 198, 19 p. https://www.who.int/docs/default-source/coronaviruse/situation-reports/20200805-covid-19-sitrep-198.pdf?sfvrsn=f99d1754_2. Accessed 25 Oct 2020
- Yang Z, Zeng Z, Wang K. Modified SEIR and AI prediction of the epidemics trend of COVID-19 in China under public health interventions. J Thorac Dis. 2020;12(3):165–174. doi: 10.21037/jtd.2020.02.64. [DOI] [PMC free article] [PubMed] [Google Scholar]
Associated Data
This section collects any data citations, data availability statements, or supplementary materials included in this article.
Data Availability Statement
Available upon request.


