Abstract
PURPOSE:
To describe the myocardial cut-off sign, assess its ability to distinguish left ventricular pseudoaneurysms (LV PSAs) from true aneurysms (LVAs), and compare its performance to other imaging findings and quantitative measurements used to differentiate LV PSAs from LVAs.
MATERIALS AND METHODS:
This retrospective single-center study identified patients with preoperative cardiac CT or MRI and surgically confirmed LVAs or LV PSAs over a 10-year period. Seventeen LV PSAs (11 MRI, 6 CT) and 18 LVAs (10 MRI, 8 CT) were included. The myocardial cut-off sign was objectively a greater than 50% decrease in aneurysm sac wall thickness measured at 1 cm from the aneurysmal neck (measurements at 2 cm were also assessed) and subjectively an abrupt “cut-off” of myocardium for the aneurysm sac for PSA compared to a gradual tapering of sac wall thickness for LVA. Two radiologists independently evaluated images for subjective presence of this sign.
RESULTS:
The myocardial cut-off sign was 91% sensitive and 97% specific when measured 1 cm from the aneurysm neck. When measured at 2 cm from the neck, the sign was 100% sensitive and 69% specific. Subjective analysis of whether the myocardium appeared “cut-off” was 94–100% sensitive and 78–94% specific with excellent agreement for both PSA (kappa=0.94) and LVA (kappa=0.83).
CONCLUSION:
The myocardial cut-off sign on cardiac CT and MRI is a sensitive and specific finding of LV PSA. Specificity is improved with objective measurements compared to subjective assessment (97% vs. 78–94%). This sign may help radiologists distinguish between LV PSAs and LVAs.
Keywords: left ventricular pseudoaneurysm, left ventricular aneurysm, left ventricular false aneurysm, cardiac MRI, cardiac CT, myocardial cut-off
INTRODUCTION:
True left ventricular aneurysms (LVAs) are common complications of myocardial infarction (MI) and involve a focal dilation of the cardiac wall in which all three layers of the cardiac wall, the endocardium, myocardium, and epicardium, remain intact. Left ventricular pseudoaneurysms (LV PSAs), also known as false left ventricular aneurysms, are rare complications of MI and can also be post-traumatic in etiology. LV PSAs are essentially contained ruptures in which the cardiac wall has been disrupted and the rupture is most often contained by pericardial adhesions.1 Differentiating between LVAs and LV PSAs is crucial as their treatments are different. LVAs are typically stable and are most often treated conservatively; anticoagulation may be used to treat or prevent thrombus formation within the aneurysm sac. In contrast, LV PSAs are unstable and can rupture at any time, even several years after formation and anticoagulation is often contraindicated. LV PSA rupture usually leads to rapid pericardial tamponade and death.2 Therefore, surgical repair is usually warranted.
Imaging is used to distinguish LVAs from LV PSAs. Traditionally, echocardiography3–6 and angiography6 were utilized. However, cardiac magnetic resonance imaging (CMRI) and cardiac computed tomographic angiography (CCTA) have become mainstays in distinguishing LVAs from LV PSAs.7 Both modalities allow for excellent non-invasive anatomic evaluation of the left ventricle and aneurysm sac. MRI has the added benefit of increased sensitivity for pericardial enhancement, an important characteristic, as pericardial enhancement is more commonly observed in LV PSAs than in LVAs.8
Many different imaging findings have been utilized to help distinguish between LVAs and LV PSAs on cross-sectional imaging. True LVAs are typically associated with a relatively wide neck, are often apical in location, may contain thrombus, and are rarely associated with pericardial enhancement. In contrast, LV PSAs typically have narrow necks, vary in location, often contain thrombus, and are commonly associated with pericardial enhancement.8 Despite these imaging features, differentiation between these two entities is often difficult. The purpose of this article is to describe the myocardial cut-off sign, a new imaging finding, and its ability to differentiate LVAs from LV PSAs.
MATERIALS AND METHODS:
This was an Institutional Review Board-approved single-center retrospective study conducted in accordance with the Health Insurance Portability and Accountability Act. The need to obtain informed consent was waived. Inclusion criteria were patients who had an LVA or LV PSA confirmed at surgery or surgical pathology with preceding preoperative imaging with ECG-gated cardiac CT or MRI. Patients were identified either through an institutional radiology information system search using key phrases including “left ventricular aneurysm” and “left ventricular pseudoaneurysm” or through a search of the cardiothoracic surgery database of patients who had undergone LV PSA repair, left ventricular assist device placement, or a Dor procedure (aneurysm resection). Of the potential patients identified through the radiology and surgical databases, only those who had preoperative imaging of the heart with either electrocardiogram ECG)-gated cardiac CT or MRI and had intra-operative and/or pathological confirmation of findings were included. In review of the operative report, the surgeons assessed for the presence of false or true aneurysm based on its morphology, pliability, and contractility. At surgical pathology, LVA had myocardium or scar present in the specimen, whereas PSA specimens had identifiable pericardial tissue but no myocardium and were composed of almost entirely thrombus and were interpreted as PSA by the pathologist.
The MRI scans were performed on 1.5T MRI whole body MRI scanners (Aera or Espree, Siemens Medical Systems, Erlangen, Germany) using a torso phased array coil. Sequences included double inversion black blood turbo spin echo, retrospectively ECG-gated cine bright blood balanced steady state free precession (SSFP) gradient echo, and T1-weighted inversion recovery (IR) late gadolinium enhanced (LGE) imaging. LGE imaging was performed 7–10 minutes after a single dose (0.1 mM/Kg) of gadobenate dimeglumine (MultiHance, Bracco, Monroe Township, NJ). The inversion time was set to 200–300ms to null the normal myocardium.
The cardiac CT scans were retrospectively ECG-gated, with pulsed gating, with full tube current at 40–80% of the cardiac cycle (128 AS+ or 64-slice Definition, Siemens Medical Solutions, Erlangen, Germany). Imaging was obtained with a kV of 100–120, tube current based upon body habitus, and a rotation time of 0.33 sec. Between 75–100 mL of intravenously administered ioversol 74% iodinated contrast (Optiray 350, Guerbet) was injected at 4 mL/sec and bolus tracked at the descending aorta, followed by a 15 mL intravenously administered saline chaser at the same injection rate.
A total of 17 patients (10 men) with LV PSAs (11 MRI, 6 CT) and 18 patients (11 men) with LVAs (10 MRI, 8 CT) were eligible for inclusion. The median age of the patients with LVAs was 56 (range 43–79) and the median age of was 55 (range 33–83) for patients with LV PSAs.
The study introduces the myocardial cut-off sign, which subjectively consists of an abrupt “cut-off” of myocardium for the aneurysm sac for PSA compared to a gradual tapering of sac wall thickness for LVA (Figure 1). Objectively, the sign is defined as a greater than 50% decrease in aneurysm sac wall thickness measured at 1 cm from the aneurysmal neck (Figure 2).
Figure 1.
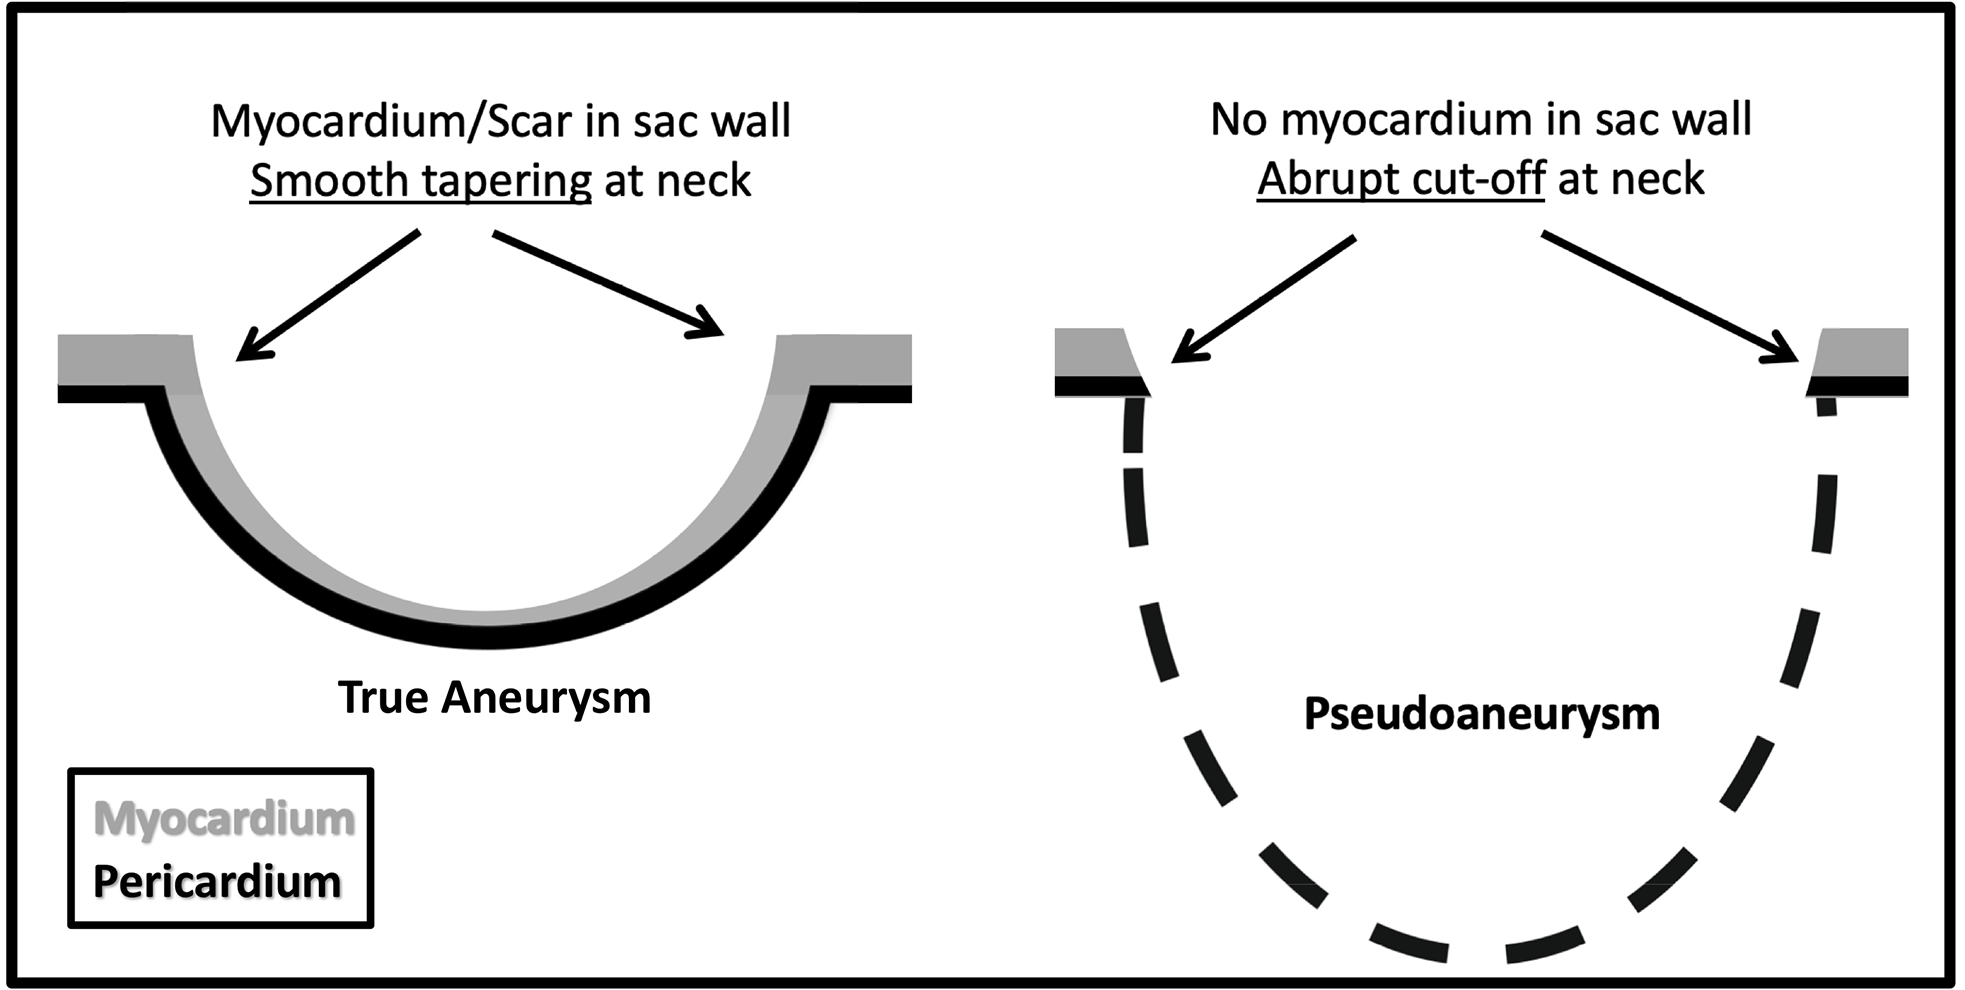
Diagram of the differences between a true left ventricular aneurysm (LVA) and pseudoaneurysm (LV PSA), which illustrate the concept of the myocardial cut-off sign. There is myocardium/scar tissue in the wall of LVA such that there is a more gradual tapering of sac wall thickness. LV PSA is a contained rupture and there is no myocardium in the sac wall. An abrupt “cut-off” of myocardium at the sac neck is present in LV PSA.
Figure 2.
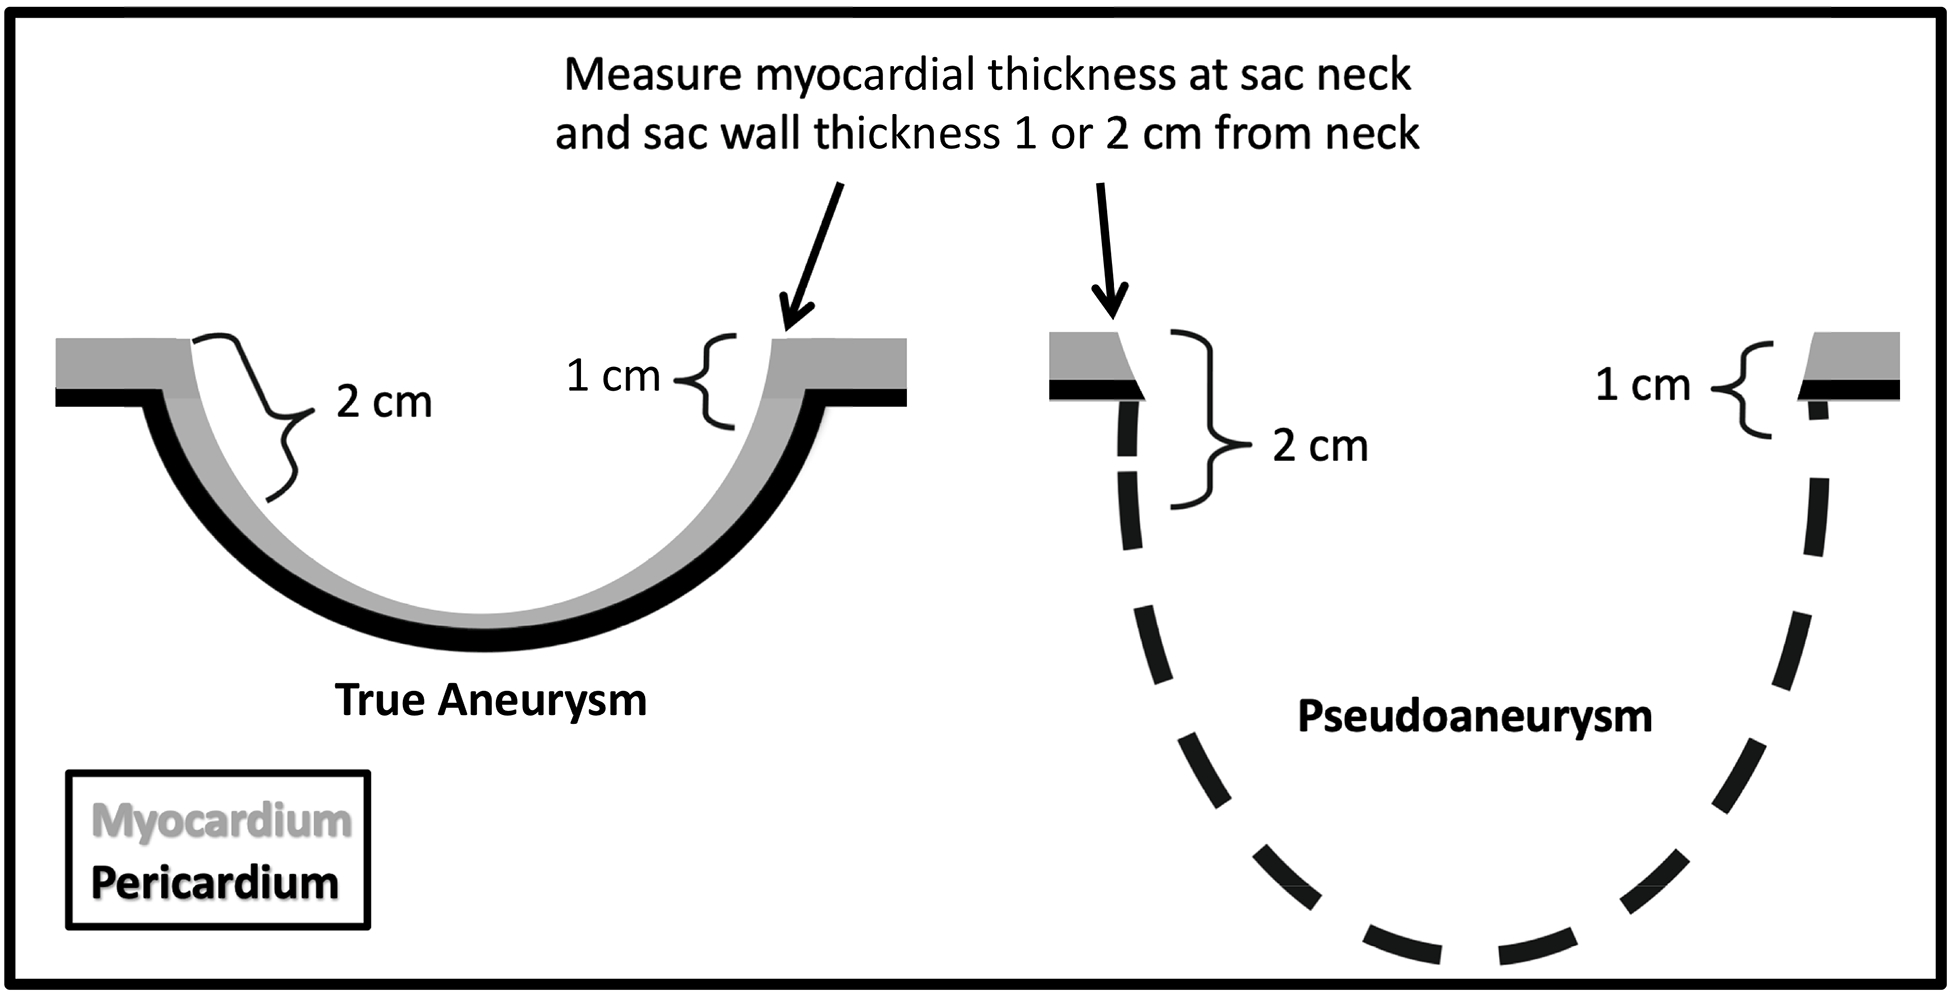
Diagram illustrating the method for quantifying the myocardial cut-off sign. Wall thickness is measured at the neck and compared to sac wall thickness measured at 1 cm and 2 cm distal to neck. All measurements were rounded to the nearest millimeter.
Myocardial sac wall thickness at the aneurysm sac neck and at 1 and 2 cm from the neck was measured on diastolic images and the presence of an objective myocardial cut-off sign (greater than 50% loss of wall thickness) at 1 and 2 cm from the neck was recorded (Figures 2–4). Both sides of the aneurysmal neck were measured for each patient (with the exception of one patient was a morphology of a LVA that did not allow bilateral measurements). Measurements were performed by a study radiologist at the end of diastole using the cine bright blood balance SSFP sequence, or in the diastolic phase acquisition of the CT scan. When thrombus lining the sac was present, predominantly manifesting as apical thrombus in LVA and thrombus lining the sac in LV PSA, the study investigator reviewed additional MR sequence and MR and CT cines if necessity to delineate the thrombus from the aneurysm sac wall. This ensured that the measurement techniques demonstrated in Figure 2 and Supplement Figure 1 were maintained and consistent. An illustration demonstrating typical thrombus distribution is provided in Supplemental Figure 2.
Figure 4.
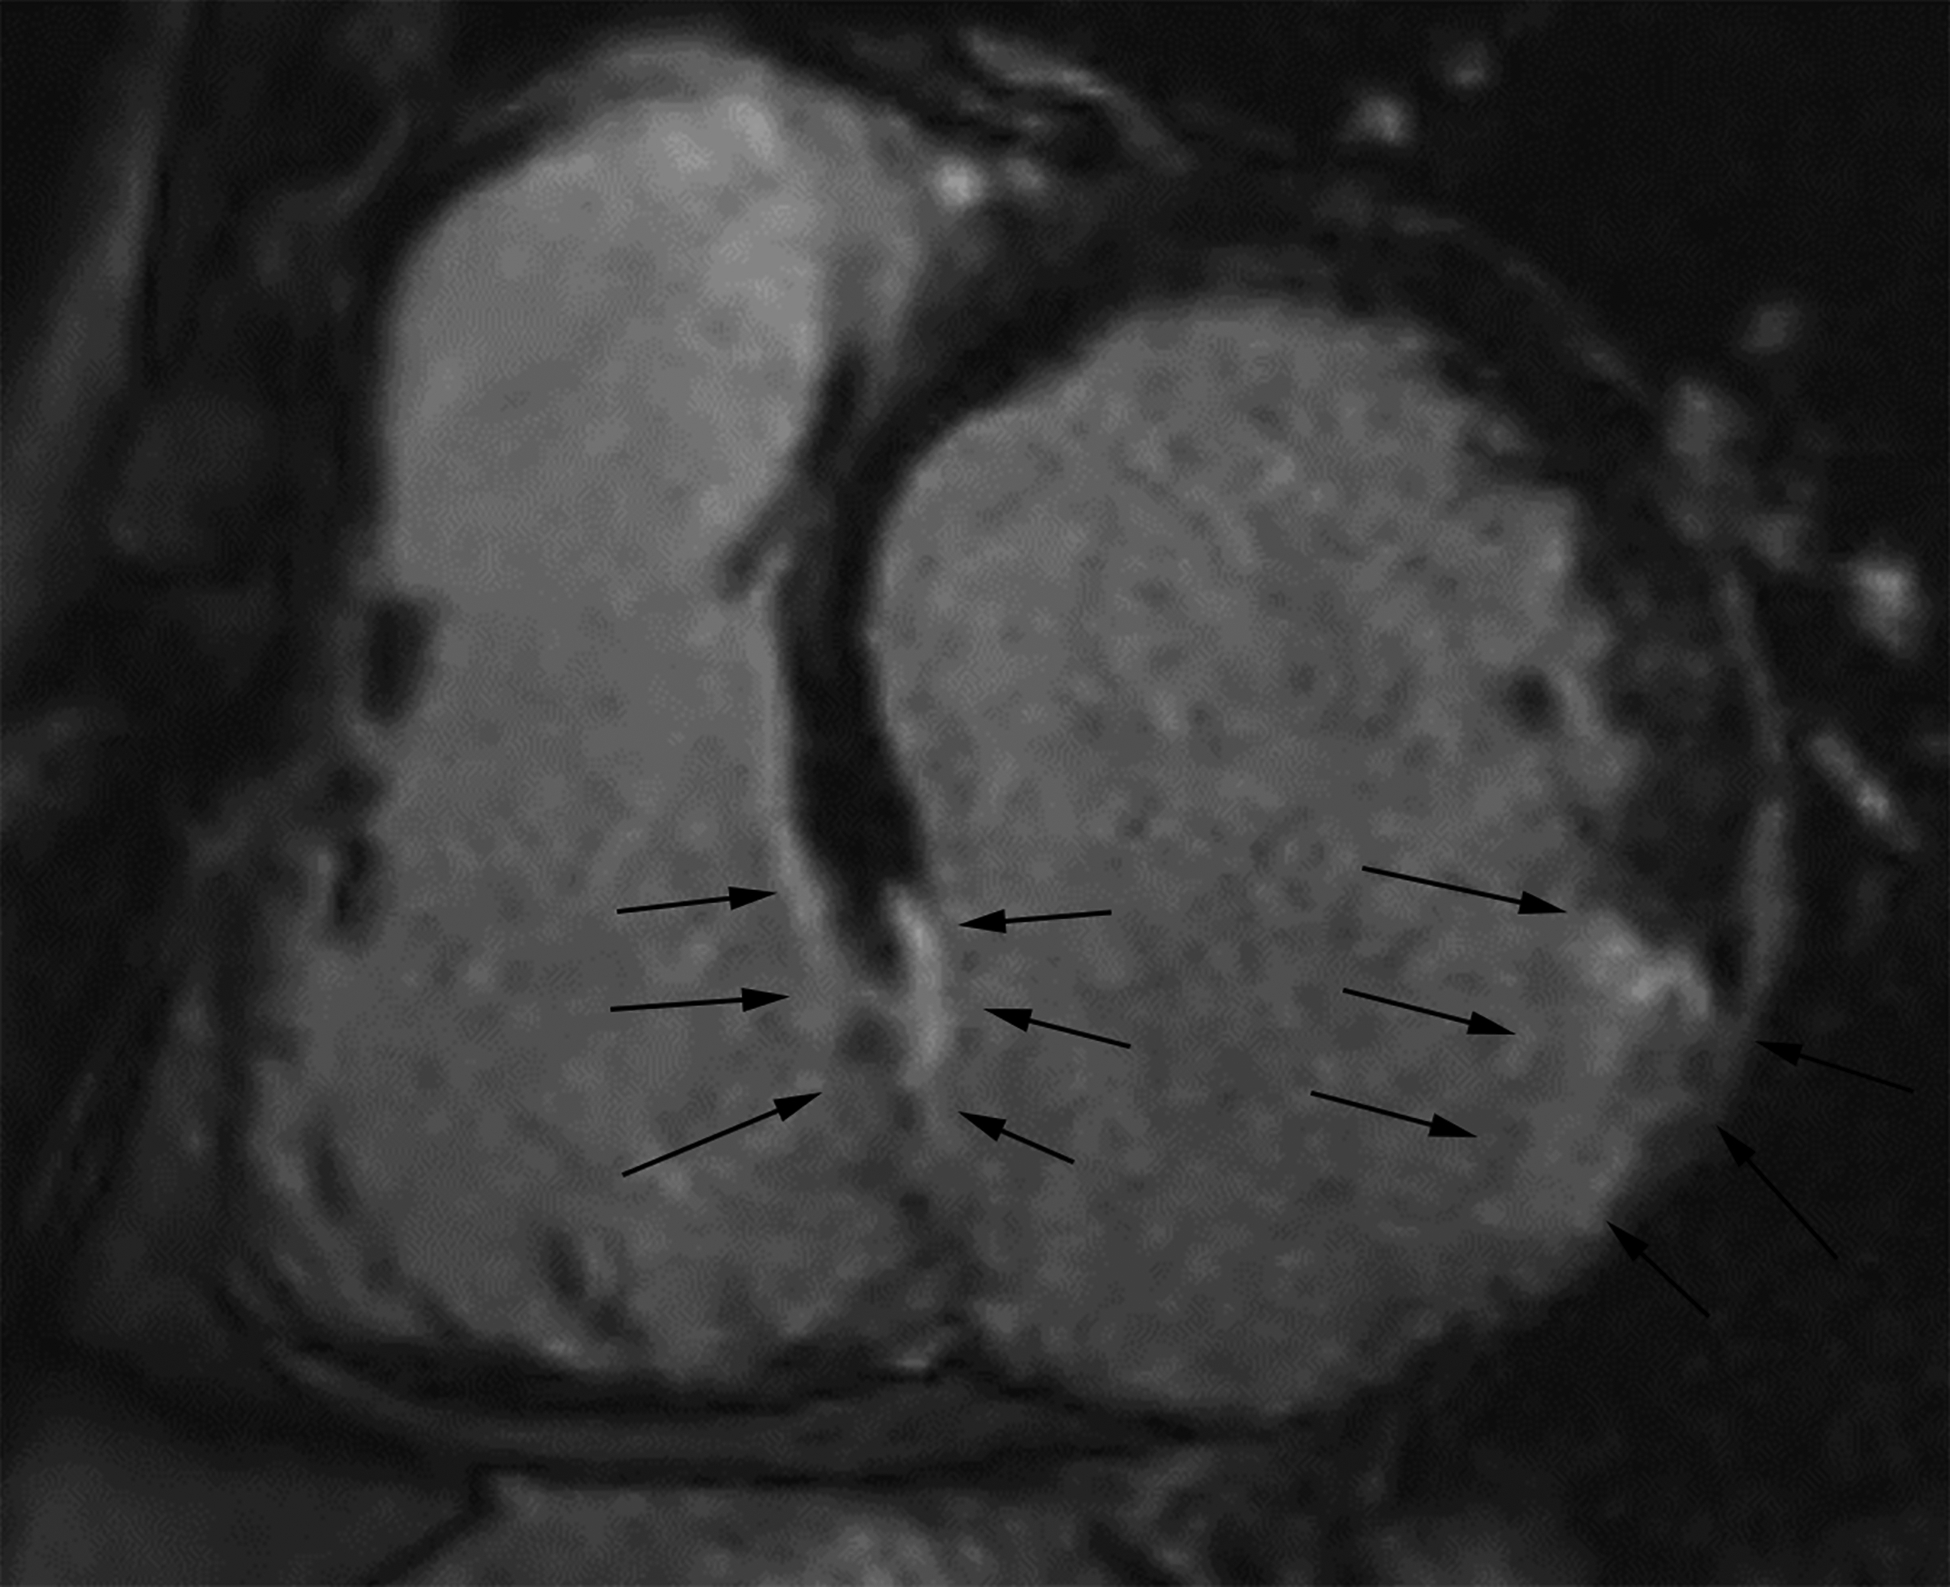
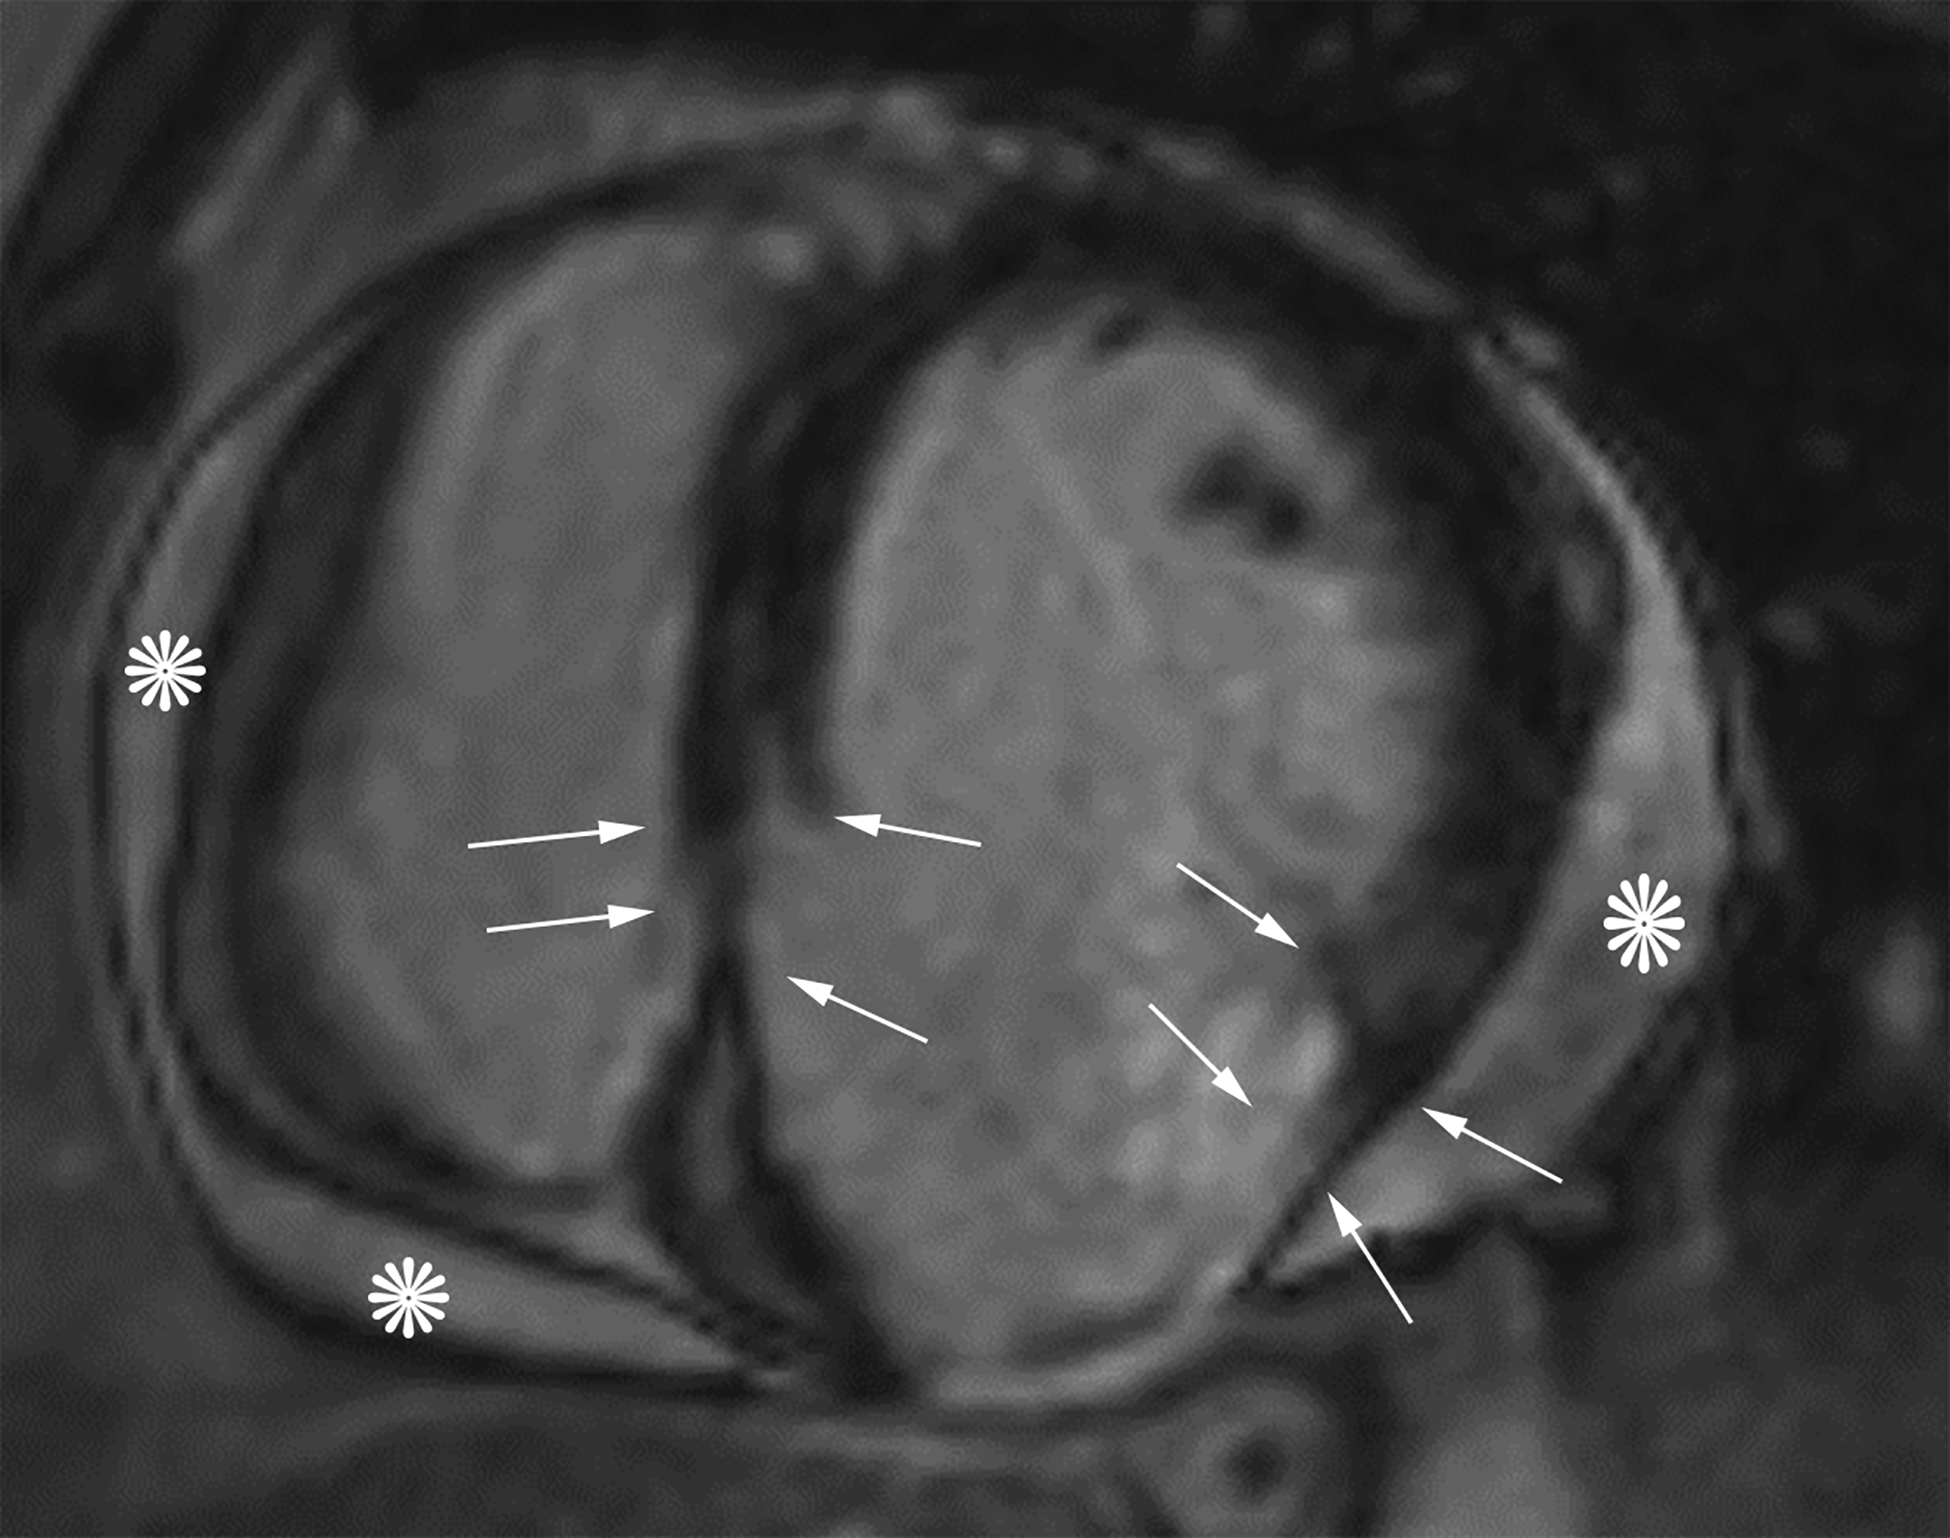
Short axis delayed enhanced CMRI (a) from a patient with an inferior wall true LVA demonstrates relatively gradual tapering of the ventricular wall at the sac neck with enhancing myocardial scar tissue. Wall thickness is measured at the neck and 1 cm and 2 cm distal to the neck (black arrows). Short axis delayed enhanced CMRI (b) from a patient with an inferior wall LV PSA demonstrates relatively abrupt loss of myocardial thickness (white arrows) at the sac neck with pericardial effusion (*). If the decrease in wall thickness from the neck measurement to the sac measurement is ≥50%, then the myocardial cut-off sign is present.
The presence of a subjective myocardial cut-off sign (whether there was a perceived abrupt loss of myocardial thickness within the sac wall at the neck as opposed to more gradual tapering of myocardial thickness) was determined independently by two blinded fellowship-trained cardiothoracic radiologists with 2 and 13 years post-fellowship experience in cardiac CT and MRI) (Figures 1 and 3). The two study radiologists chose the imaging plane that best demonstrated the aneurysm for assessment.
Figure 3.
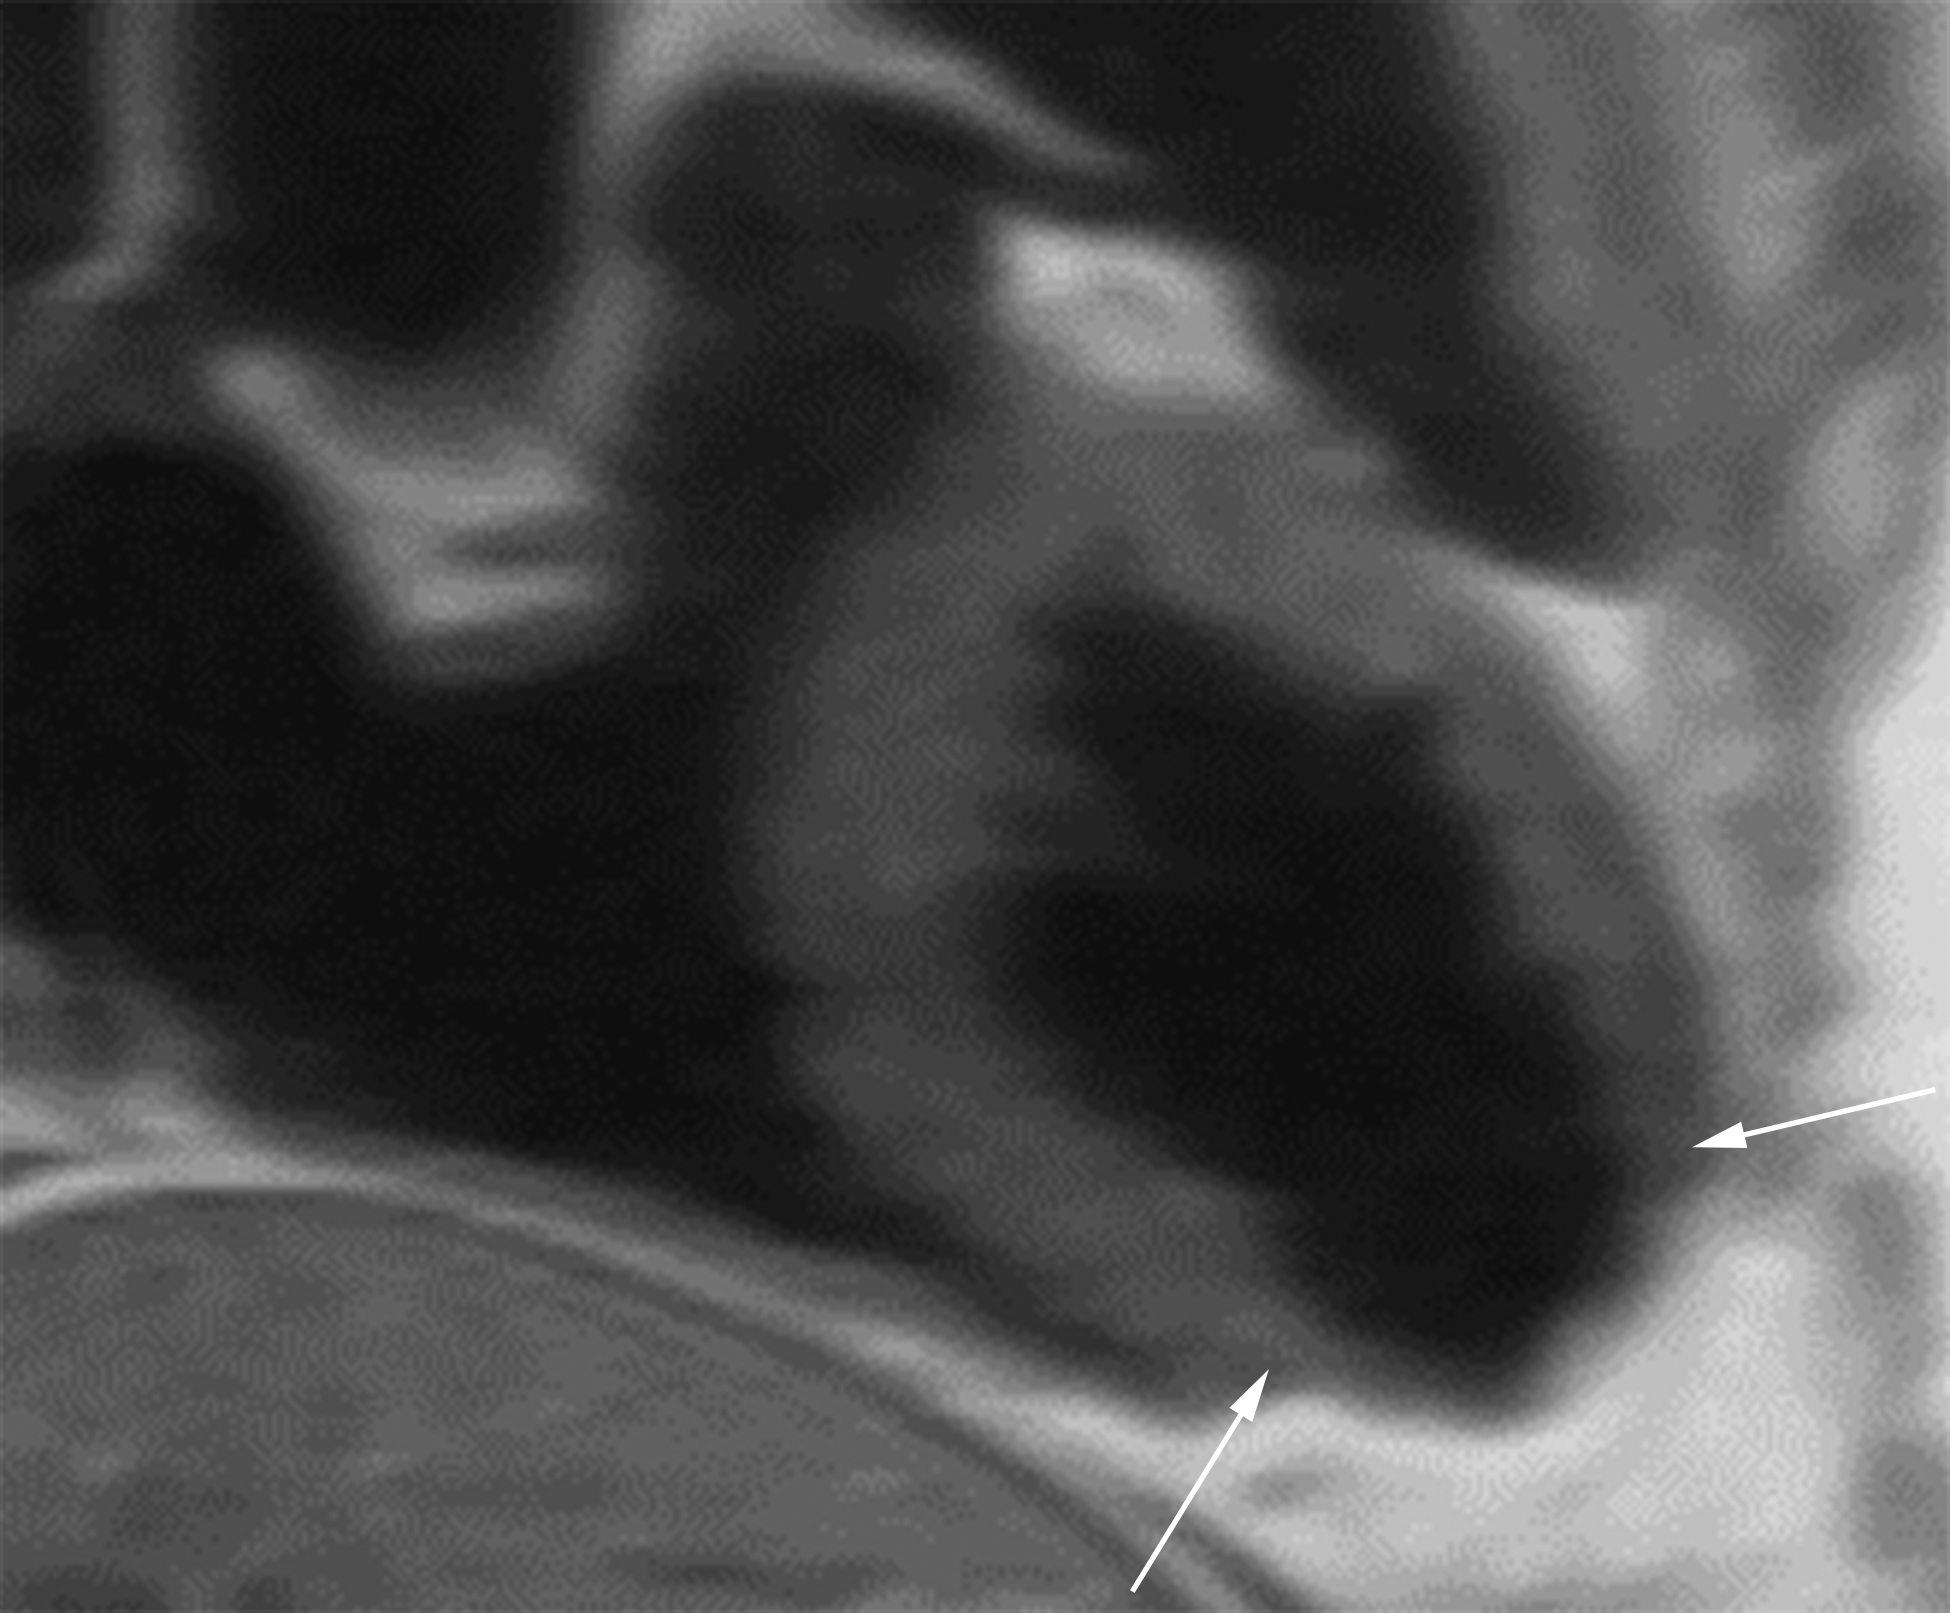
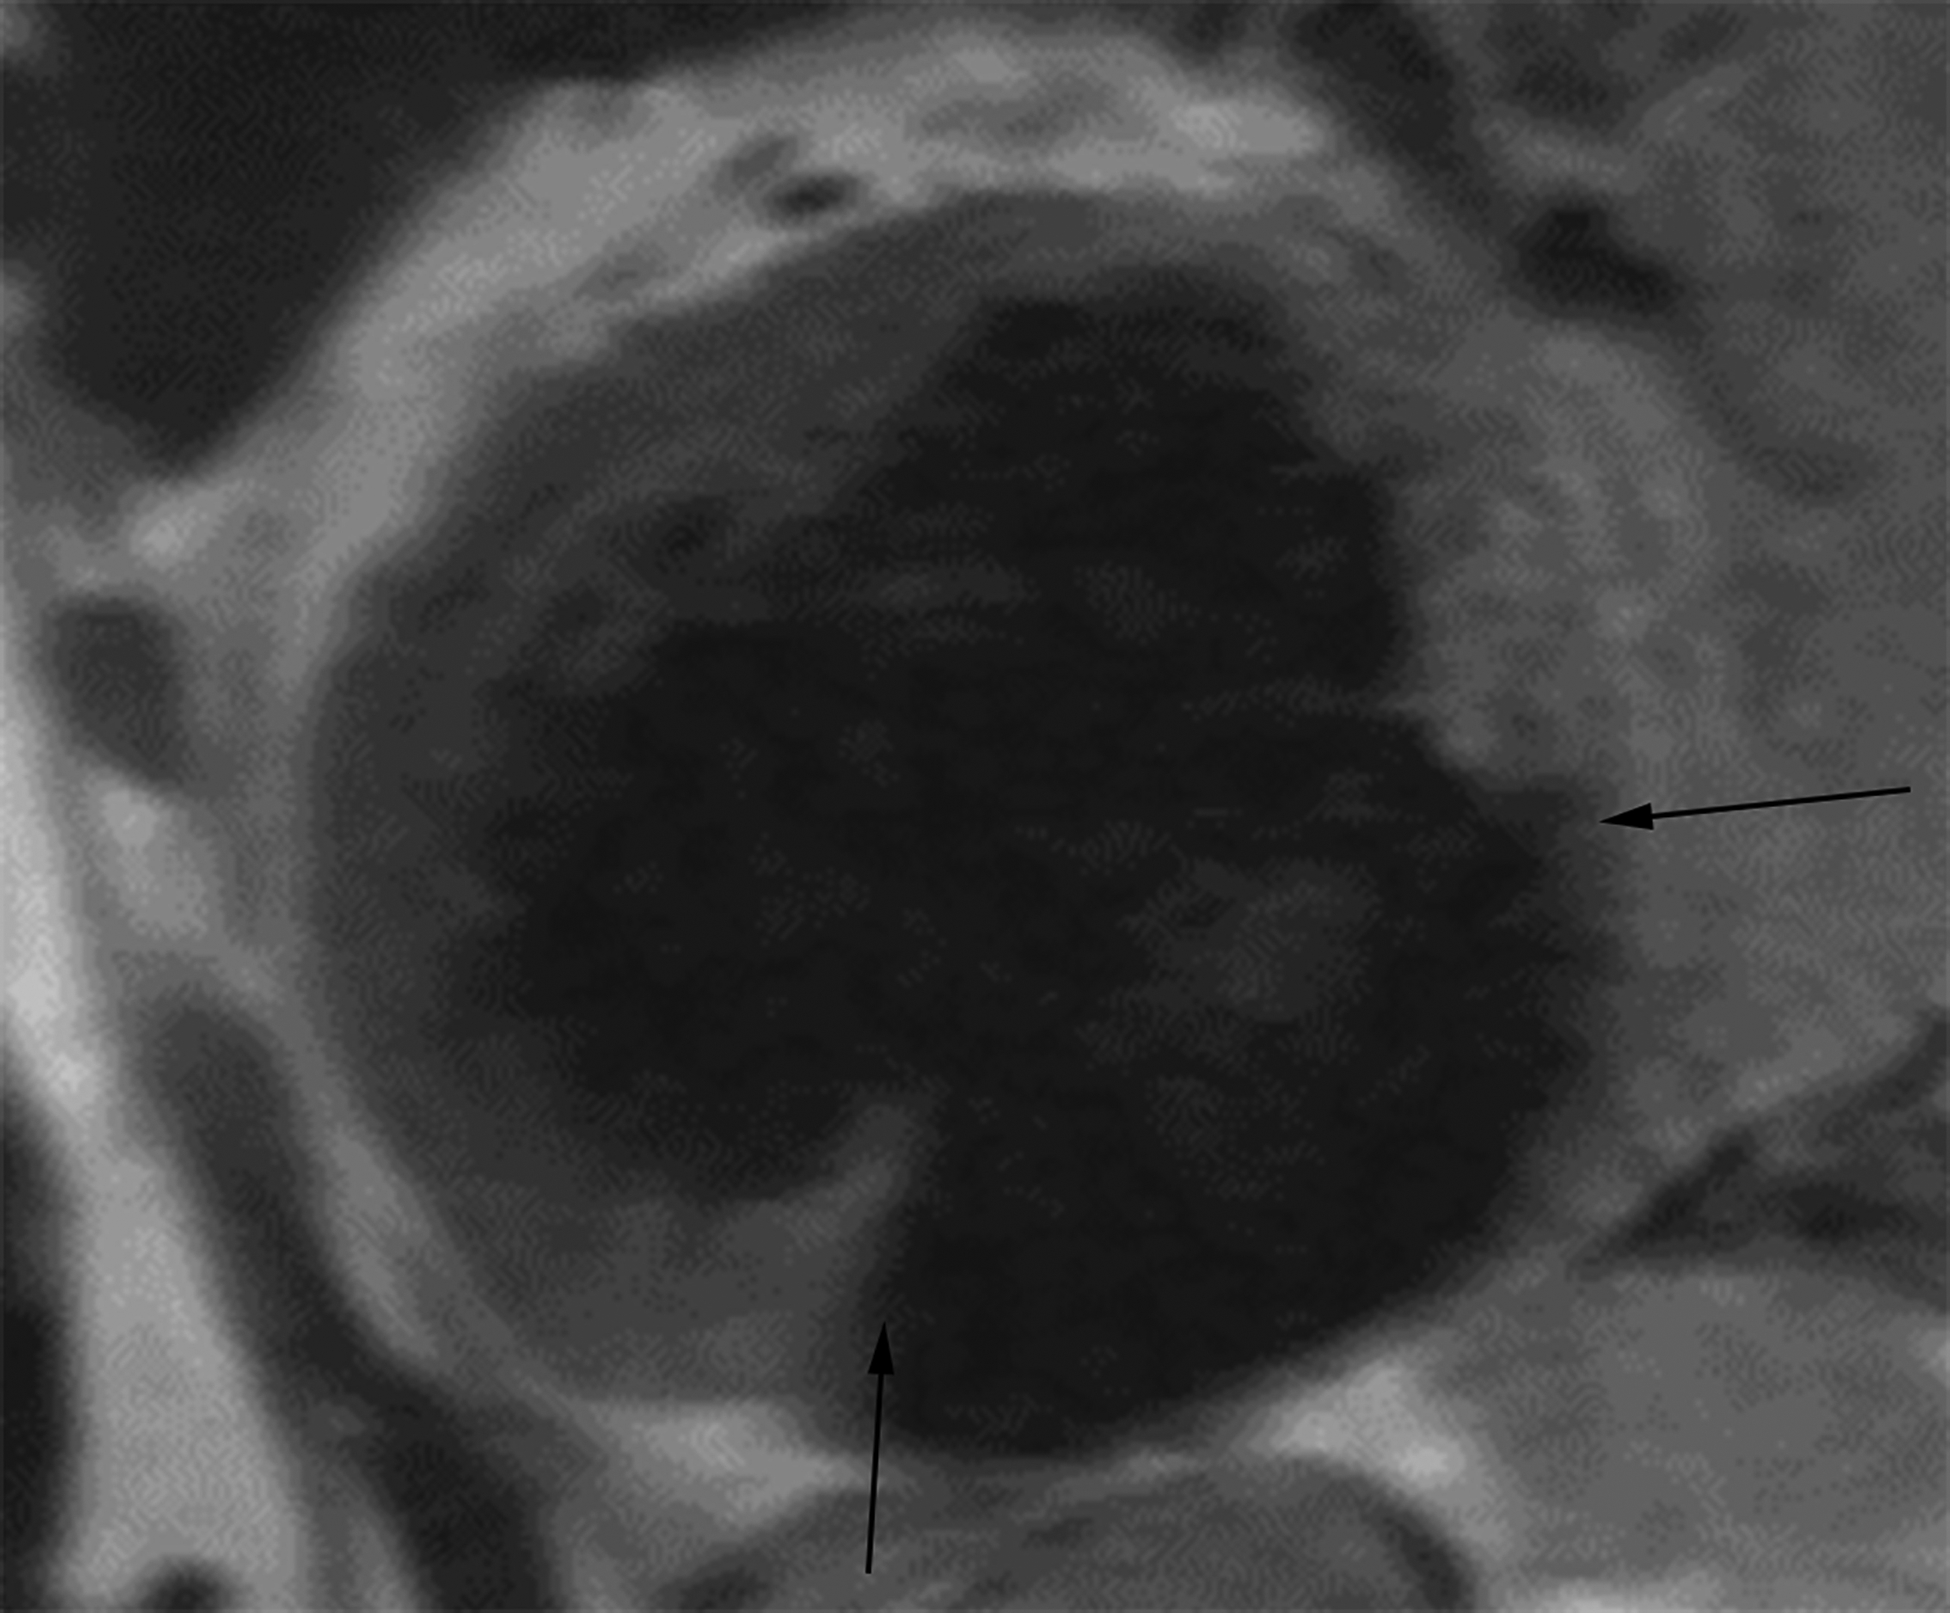
Oblique two-chamber long axis black-blood cardiac MR image (CMRI) (a) from a patient with an apical true LVA demonstrates relatively gradual tapering of the ventricular wall at the sac neck (white arrows). Short-axis black-blood CMRI (b) from a patient with an inferior wall LV PSA demonstrates abrupt loss of myocardial thickness at the sac neck (black arrows).
Differences between LV PSAs and LVAs location were examined. Evaluation for presence and amount of thrombus lining the sac, width of the sac neck, maximum sac width parallel to neck, ratio of neck to maximum parallel sac width, maximum sac width perpendicular to neck, ratio of neck to maximum perpendicular sac width, and pericardial enhancement (from MRIs only) were all also analyzed. The sac measurements are illustrated in the Supplemental Figure 1.
Measurement data were examined by calculating means and standard deviations. Patterns were tested for statistical significance with t-tests. Categorical data were examined by calculating contingency tables, and patterns were tested with chi-square tests. A p value of <0.05 was considered significant. In addition, sensitivity and specificity, as well as positive and negative predictive values were calculated for parameters of the myocardial cut-off sign. For the subjective cut-off sign between the two study radiologists, agreement was assessed using Cohen kappa. Kappa values less than 0 as were considered no agreement; 0–0.20, slight agreement; 0.21–0.40, fair agreement; 0.41–0.60, moderate agreement; 0.61–0.80, substantial agreement; and 0.81–1, almost perfect/excellent agreement.
RESULTS:
Mean myocardial thickness at the aneurysm sac neck was 11.6 mm and 11.4 mm for LVAs and PSAs (p = 0.78). Mean sac wall thickness for LVAs and LV PSAs measured 1 cm from the sac neck was 8.2mm and 3.9 mm respectively, with a mean loss of wall thickness of 29% versus 67% (p<0.001). Mean sac wall thickness for LVAs and LV PSAs measured 2 cm from the sac neck was 5.9 mm and 2.8 mm respectively, with a mean loss of wall thickness of 48% and 76% respectively (p<0.001) (Table 1). When quantitatively defining the myocardial cut-off sign as greater than 50% loss of myocardial thickness, the sign was 91% sensitive and 97% specific with positive and negative predictive values of 97% and 92% at 1 cm. The myocardial cut-off sign was 100% sensitive and 69% specific with positive and negative predictive values of 67% and 100% at 2 cm (Table 1). Subjective analysis of whether the myocardium appeared “cut-off” at the sac neck was 94–100% sensitive and 78–94% specific for two fellowship-trained cardiothoracic radiologists with excellent agreement for both PSA (kappa=0.94) and LVA (kappa=0.83) (Table 2) (Figure 3).
TABLE 1.
Myocardial Cut-Off Sign Parameters
| LV PSA | True LVA | p-values | |
|---|---|---|---|
| Mean Myocardial Thickness at Neck | 11.4 ± 2.8 mm | 11.6± 2.8 mm | p=0.78 |
| Mean Sac Wall Thickness at 1 cm | 3.9 ± 2.4 mm | 8.2 ± 2.4 mm | p<.0001 |
| Mean % Loss of Thickness at 1 cm | 67% ± 15.7% | 29% ± 13.2% | p<.0001 |
| Mean Sac Wall Thickness at 2 cm | 2.8 ± 1.5 mm | 5.9 ± 2.0 mm | p<.0001 |
| Mean % Loss of Thickness at 2 cm | 76% ± 10.4% | 48% ± 14.4% | p<.0001 |
TABLE 2.
Myocardial cut-off sign performance for left ventricular pseudoaneurysm. Subjective determination of the myocardial cut-off sign by two fellowship-trained cardiothoracic radiologists. Objective determination of the myocardial cut-off sign determined by study cardiothoracic radiology fellow with the myocardial sac wall thickness at the aneurysm sac neck and at 1 and 2 cm from the neck, measured on diastolic images, and constituted by greater than 50% loss of wall thickness at 1 and 2 cm from the neck. The “True Positive” column refers to the 17 study patients with left ventricular pseudoaneurysm and the “False Positive” column refers to the 18 study patients with left ventricular aneurysm.
| True Positive (Pseudoaneurysm) | Sensitivity | False Positive (Aneurysm) | Specificity | |
|---|---|---|---|---|
| Subjective: Reader 1 | 16/17 | 94% | 1/18 | 94% |
| Subjective: Reader 2 | 17/17 | 100% | 4/18 | 78% |
| Objective: Measurement at 1 cm (bilateral measurements) | 31/34 | 91% | 1/35* | 97% |
| Objective: Measurement at 2 cm (bilateral measurements) | 34/34 | 100% | 17/35 | 51% |
The morphology of a left ventricular aneurysm in one patient only allowed for a unilateral measurement and was the single false positive case.
The majority of LVAs were apical in location (13/18, 72%) while only a minority of LV PSAs were apical (5/17, 29%). The majority of LV PSAs involved either the inferior or lateral left ventricular wall (12/17, 71%). Presence of a free flap of myocardial tissue at the neck was seen in none (0/18) of the LVAs and 29% (5/17) of the LV PSAs (Figure 5). Pericardial enhancement was seen in 11% (1/9) of cardiac MRIs of patients with LVAs and 100% (8/8) of LV PSAs (Figure 6). Thrombus was present in 28% (5/18) of LVAs and 88% (15/17) of LV PSAs, with thrombus lining greater than 50% of the sac in 17% (3/18) of LVAs and 59% (10/17) of LV PSAs (Figures 5–7) (Table 3).
Figure 5.
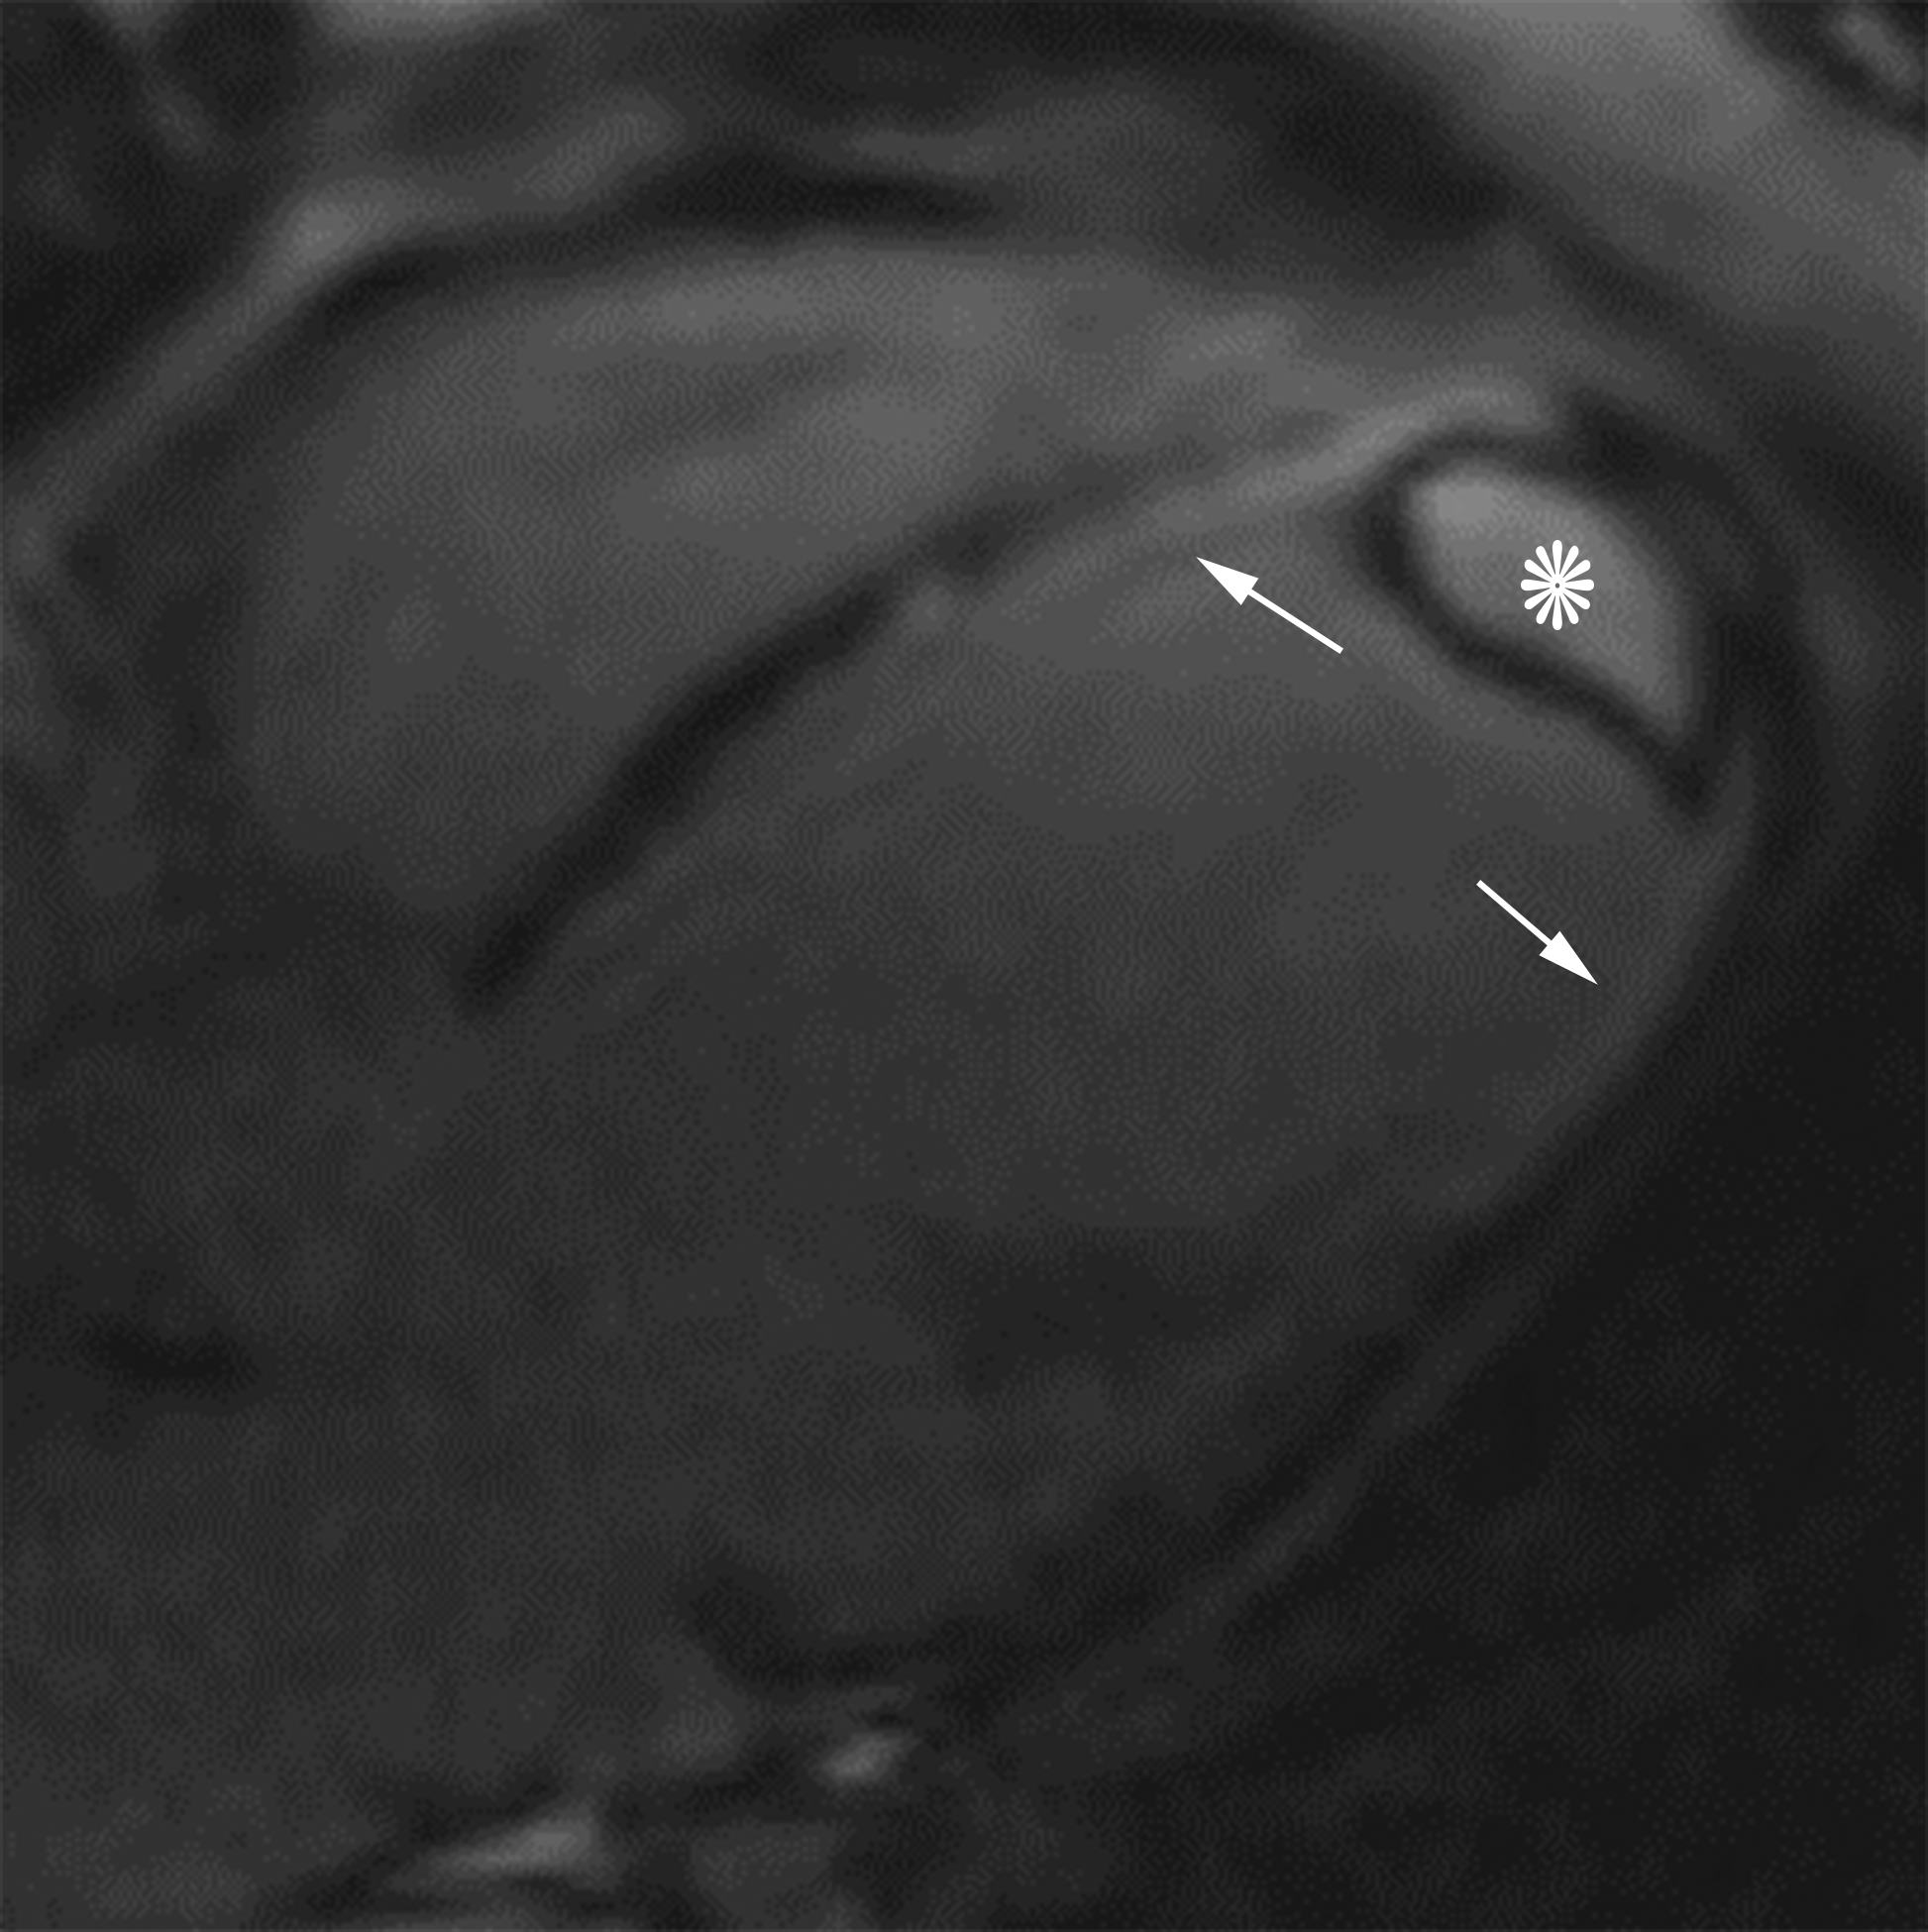
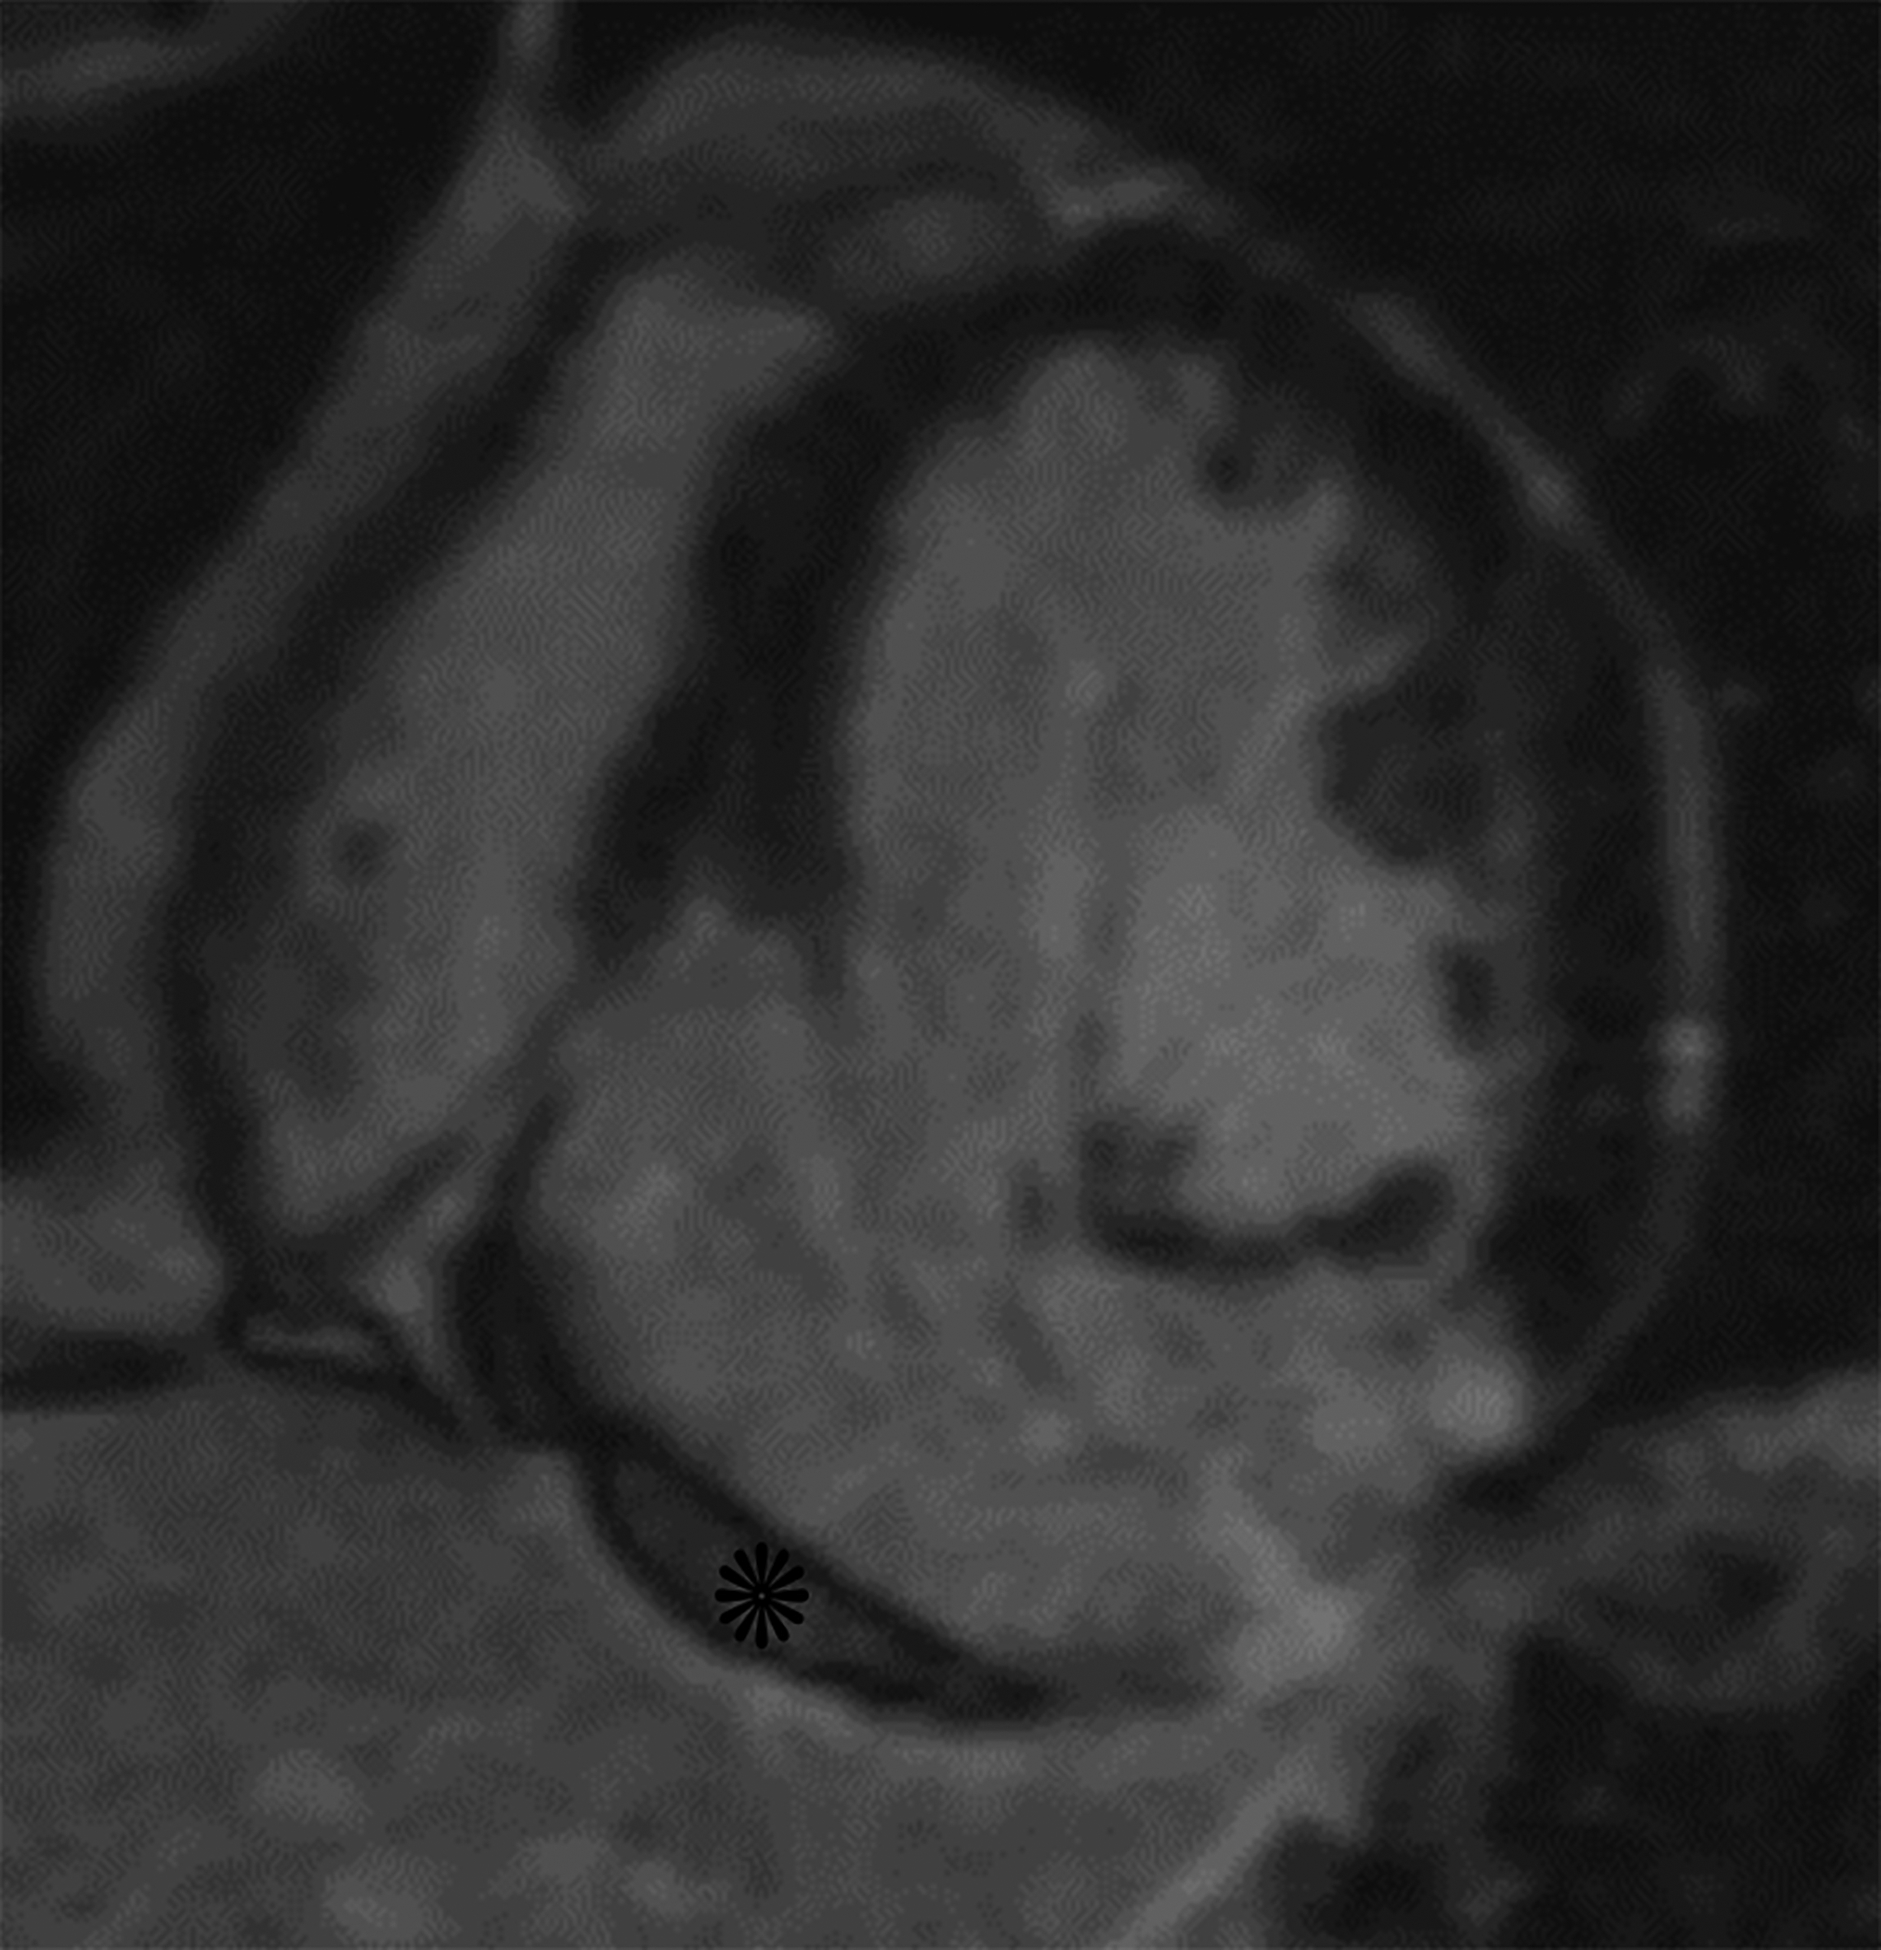
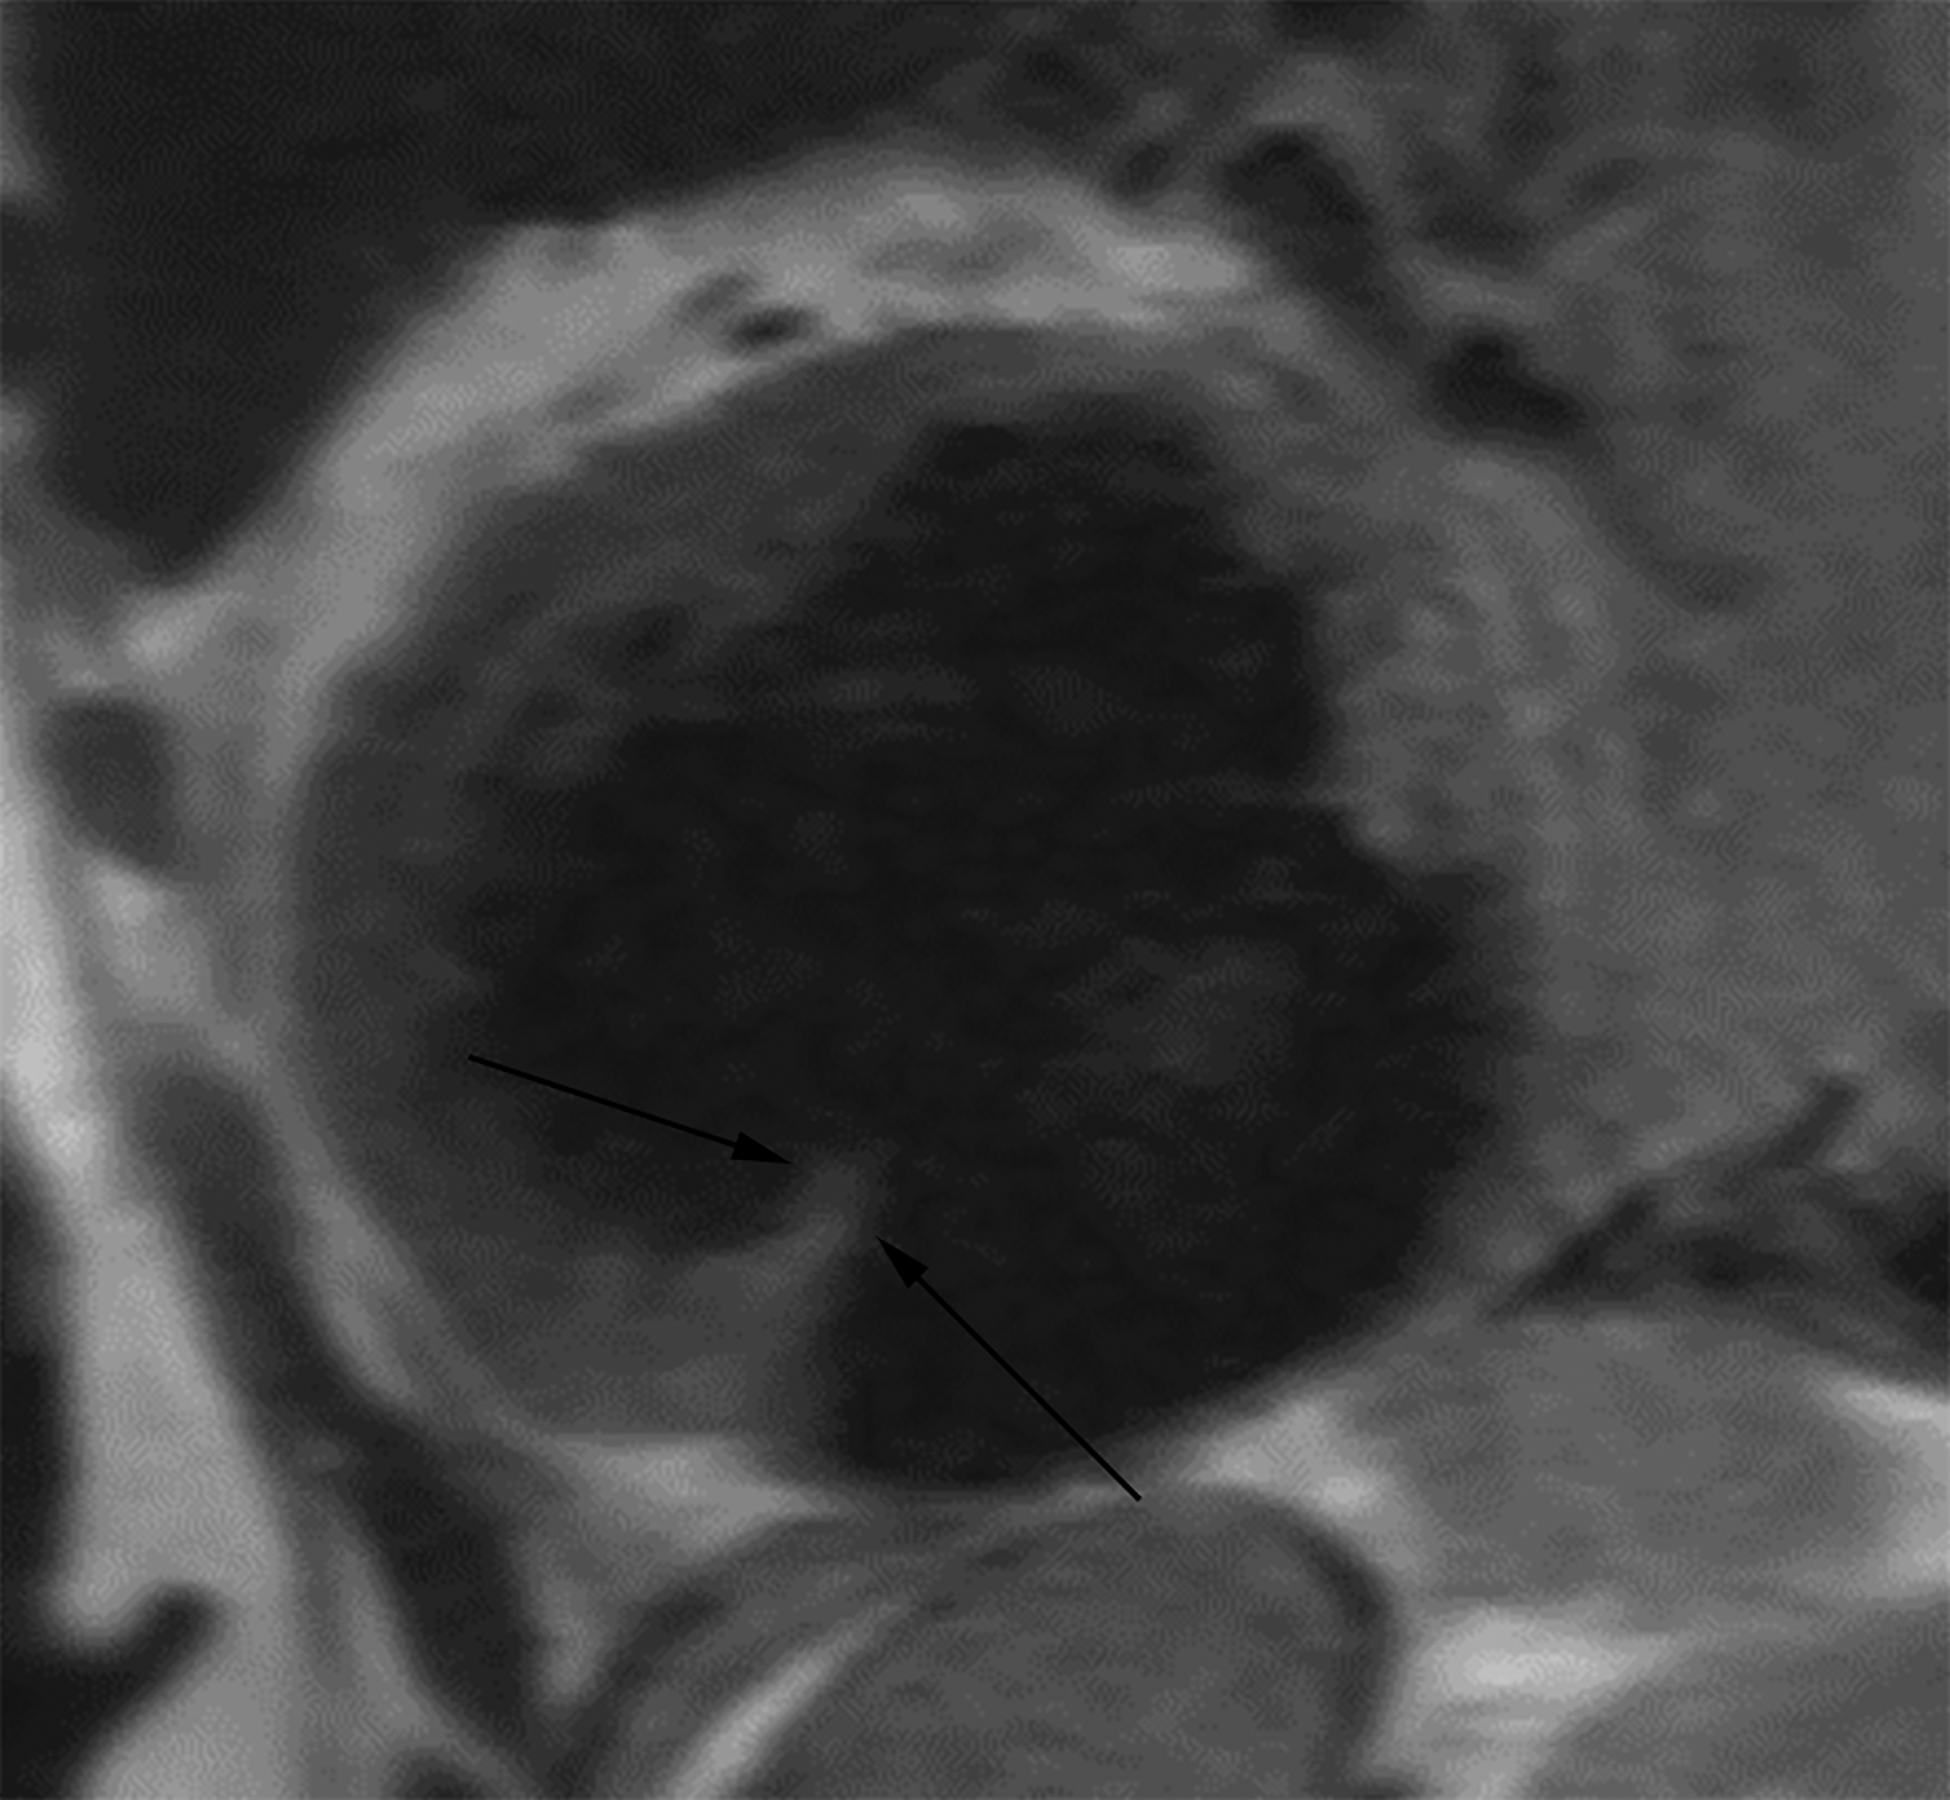
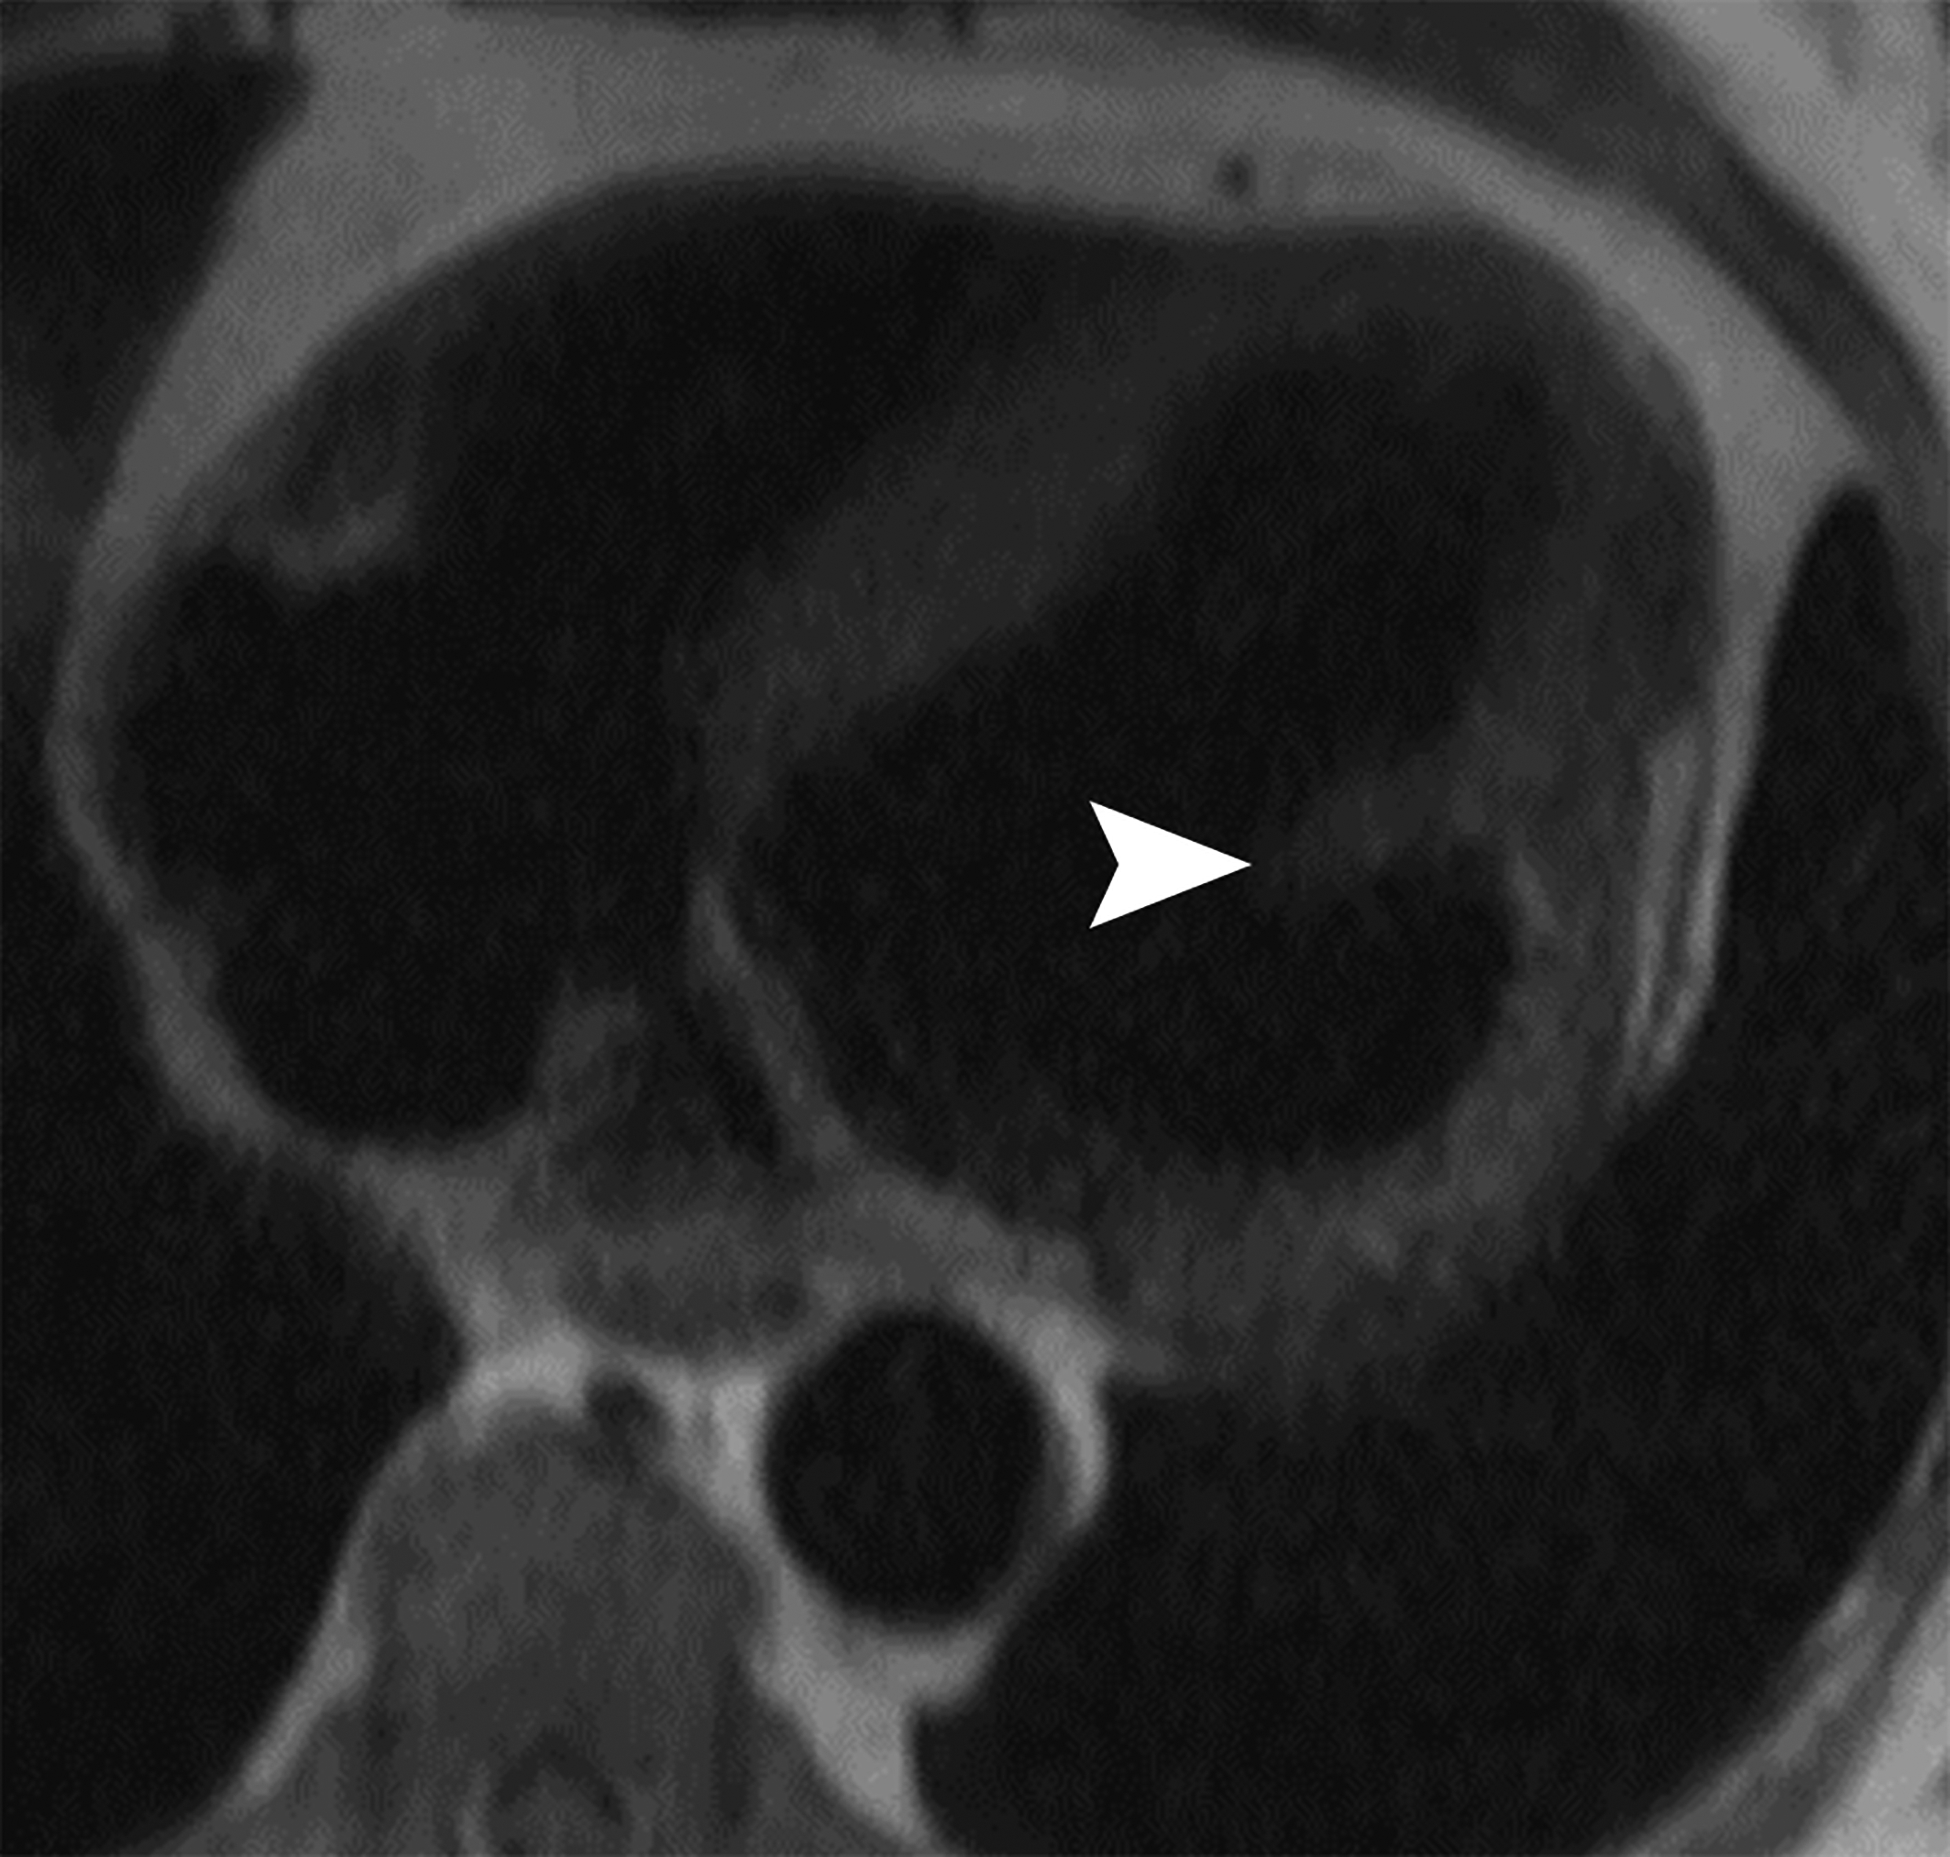
Horizontal long axis (a) and short axis (b) delayed enhanced CMRI from two different patients with apical true LVA (a) and inferior basal LV PSA (b). Note the subendocardial enhancement (a, white arrows) consistent with infarct and the apical thrombus (white *). There is thrombus lining much of the sac wall in the LV PSA (b) (black *). Short axis (c) and axial (d) black blood HASTE images from two different patients with inferolateral LV PSAs. A free flap (black arrow) is seen in (c); papillary muscles can mimic a free flap (d) (arrowhead).
Figure 6.
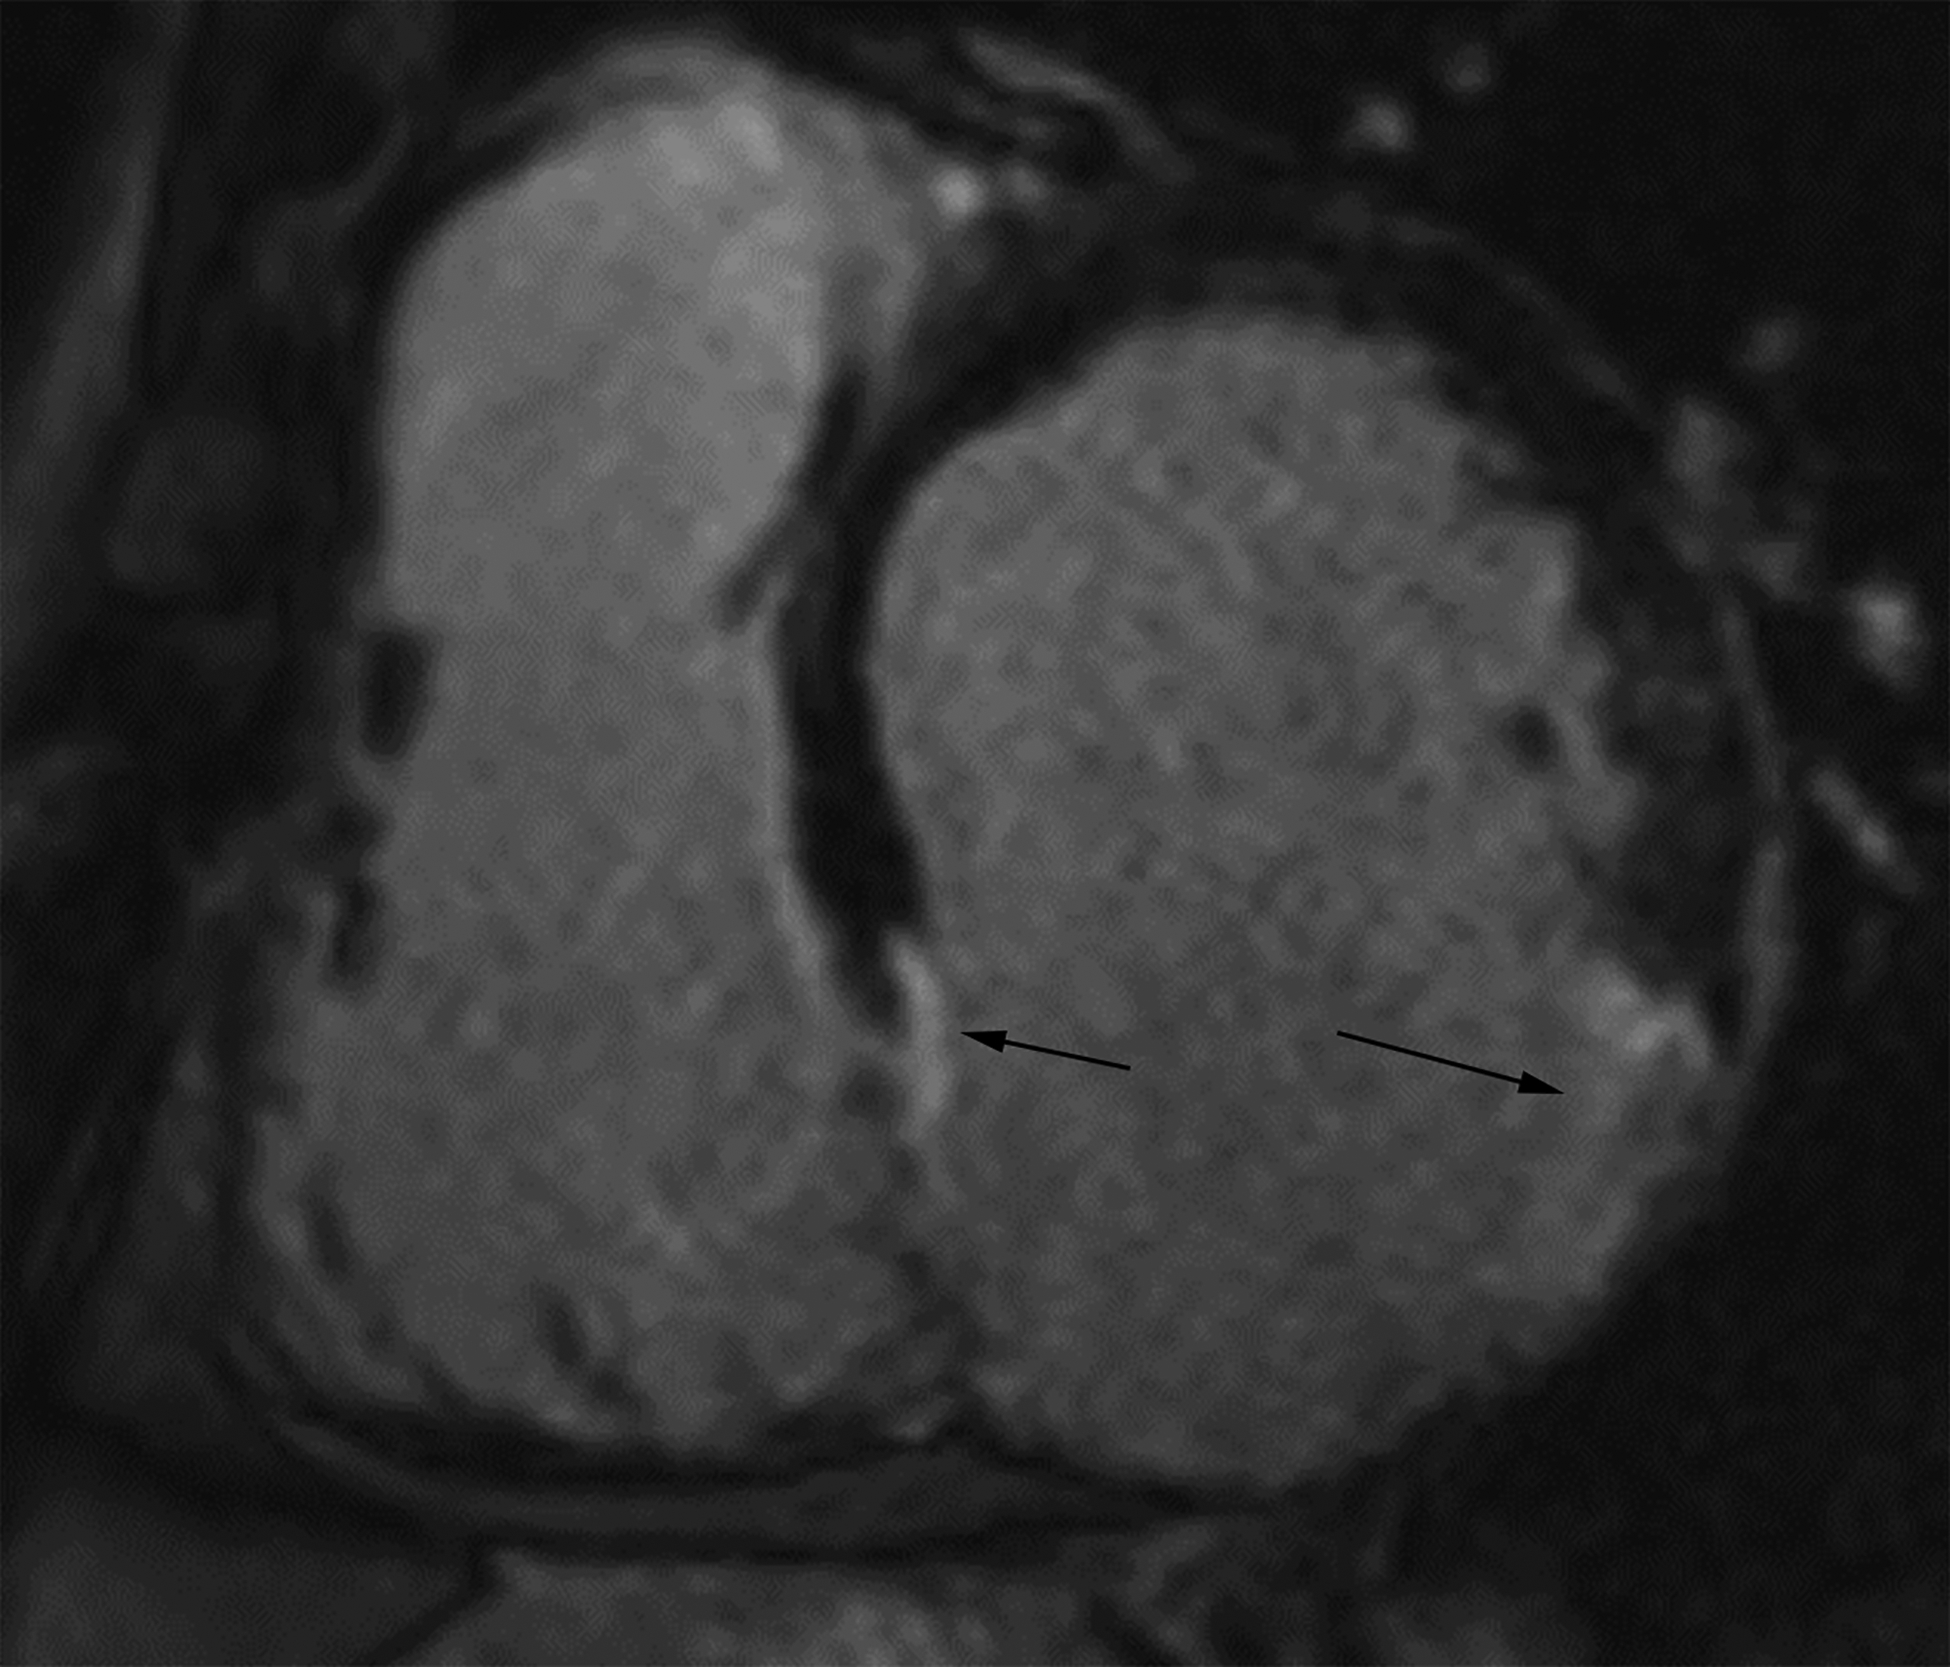
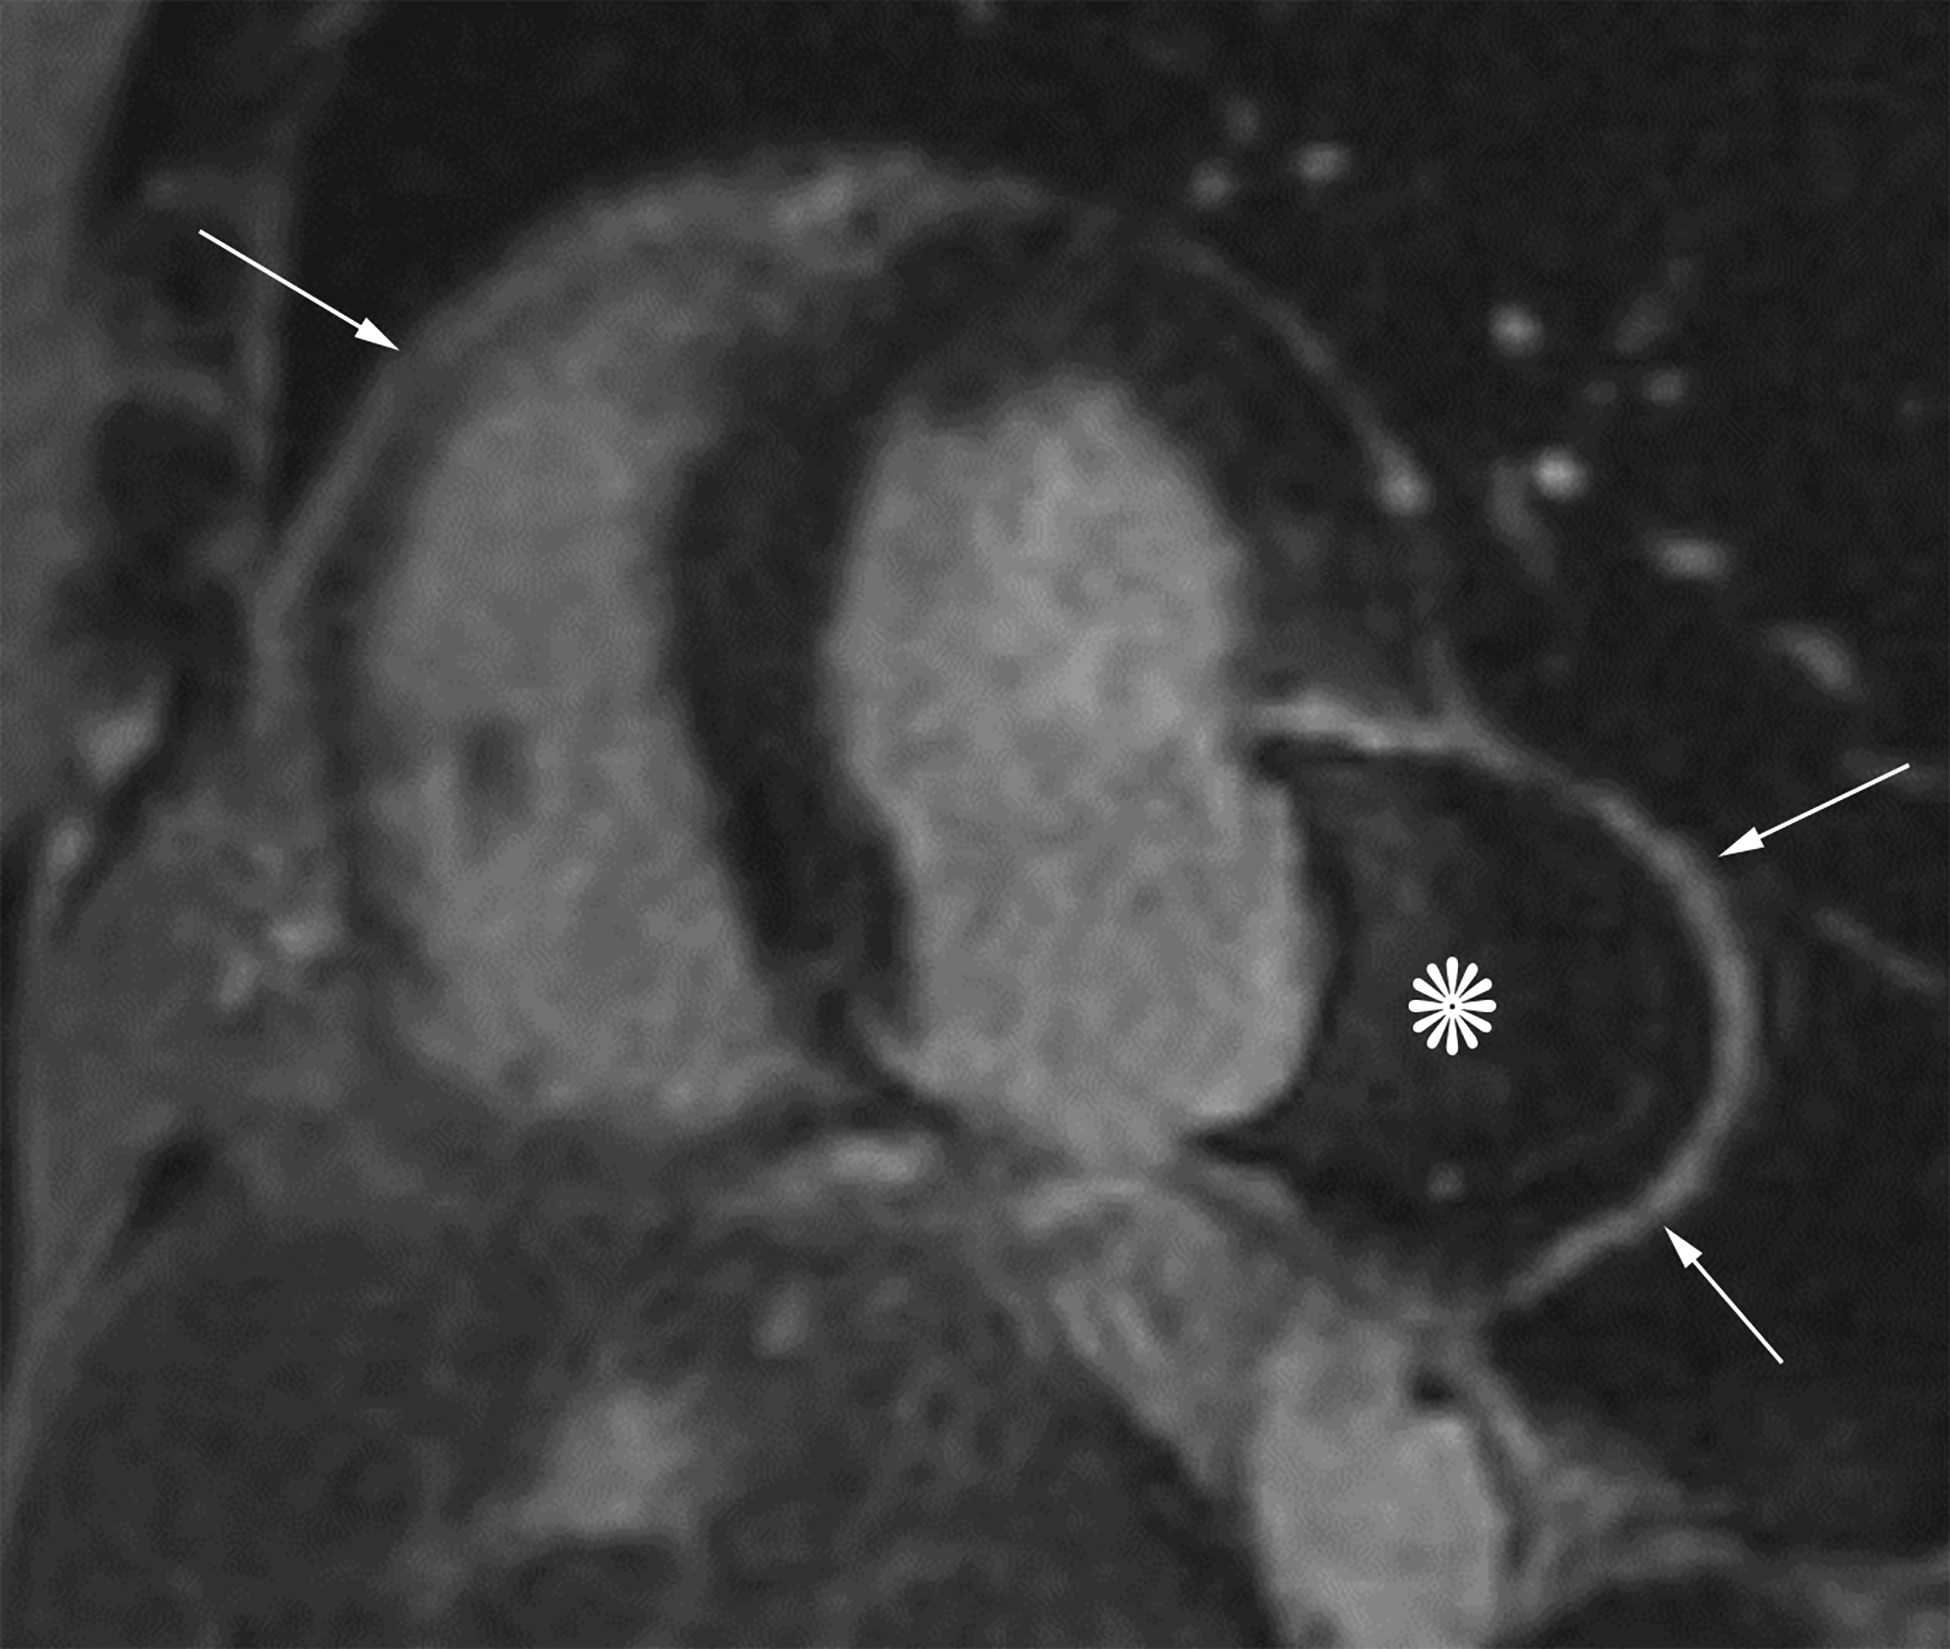
Short axis delayed enhanced CMRI (a) from a patient with an inferior wall true LVA (same patient as Figure 4a) demonstrates enhancing myocardial scar tissue within the sac wall (black arrows). Short axis delayed enhanced CMRI (b) from a patient with an inferolateral LV PSA demonstrates prominent pericardial enhancement (white arrows). Also note the thrombus filling much of the sac (*).
Figure 7.
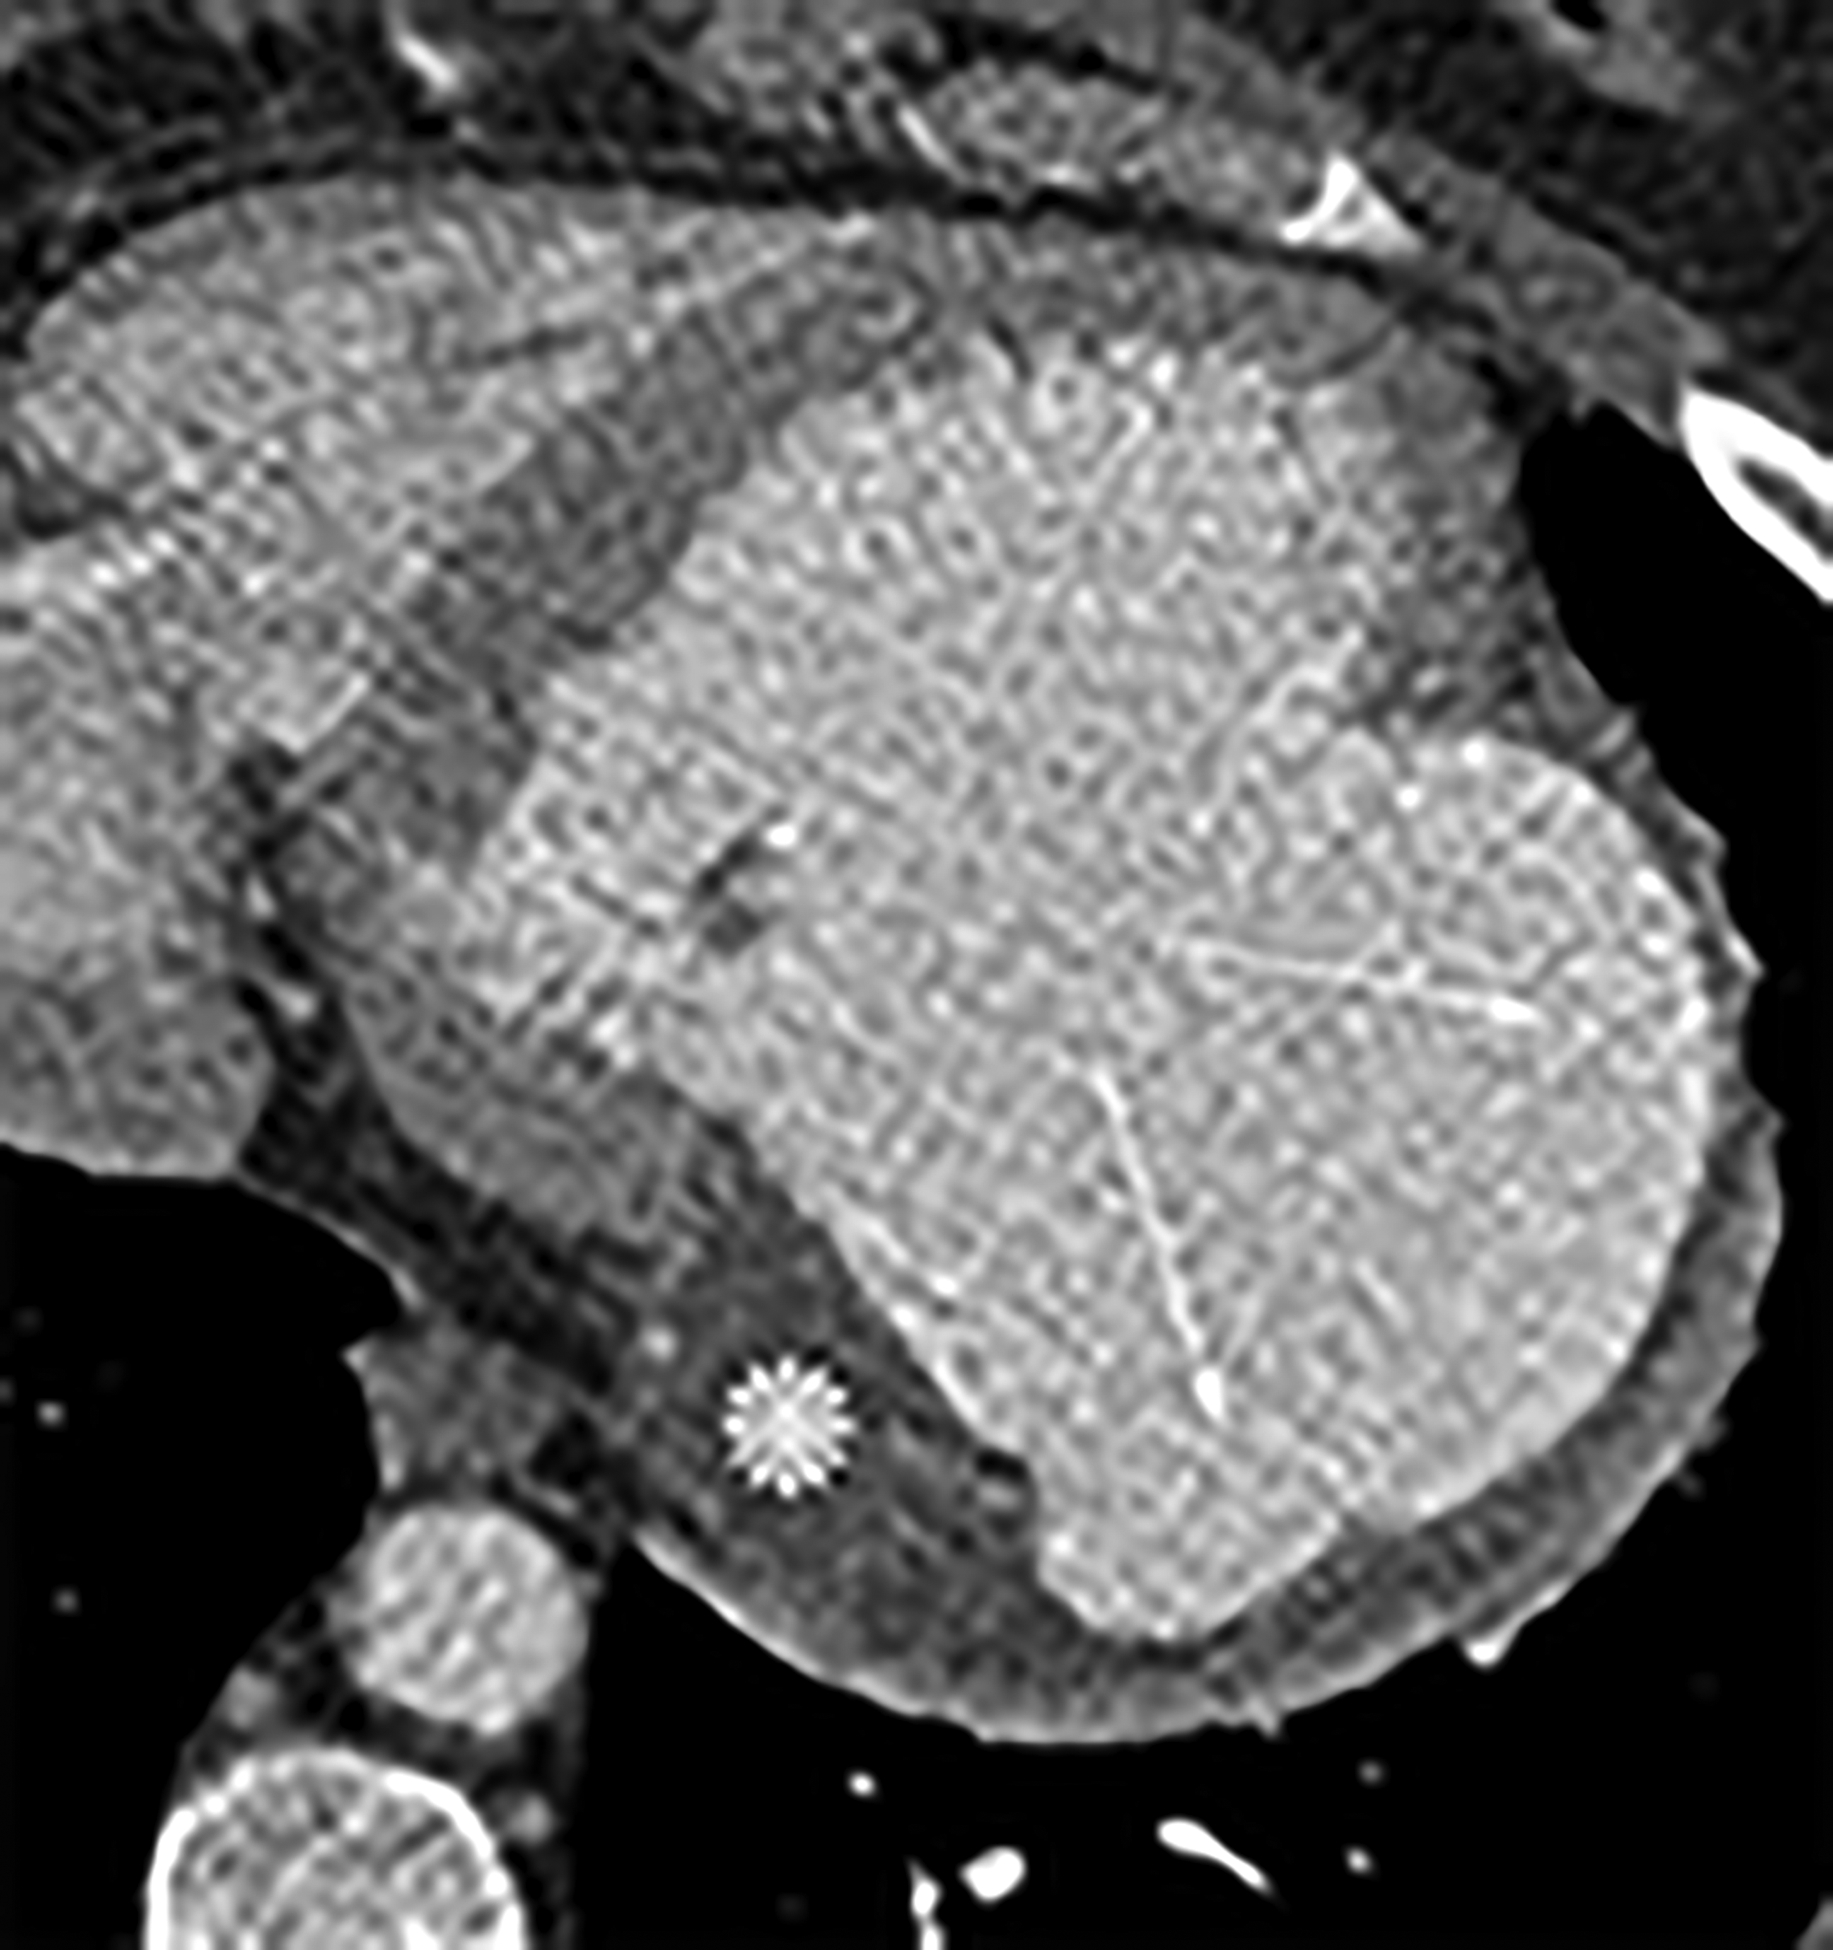
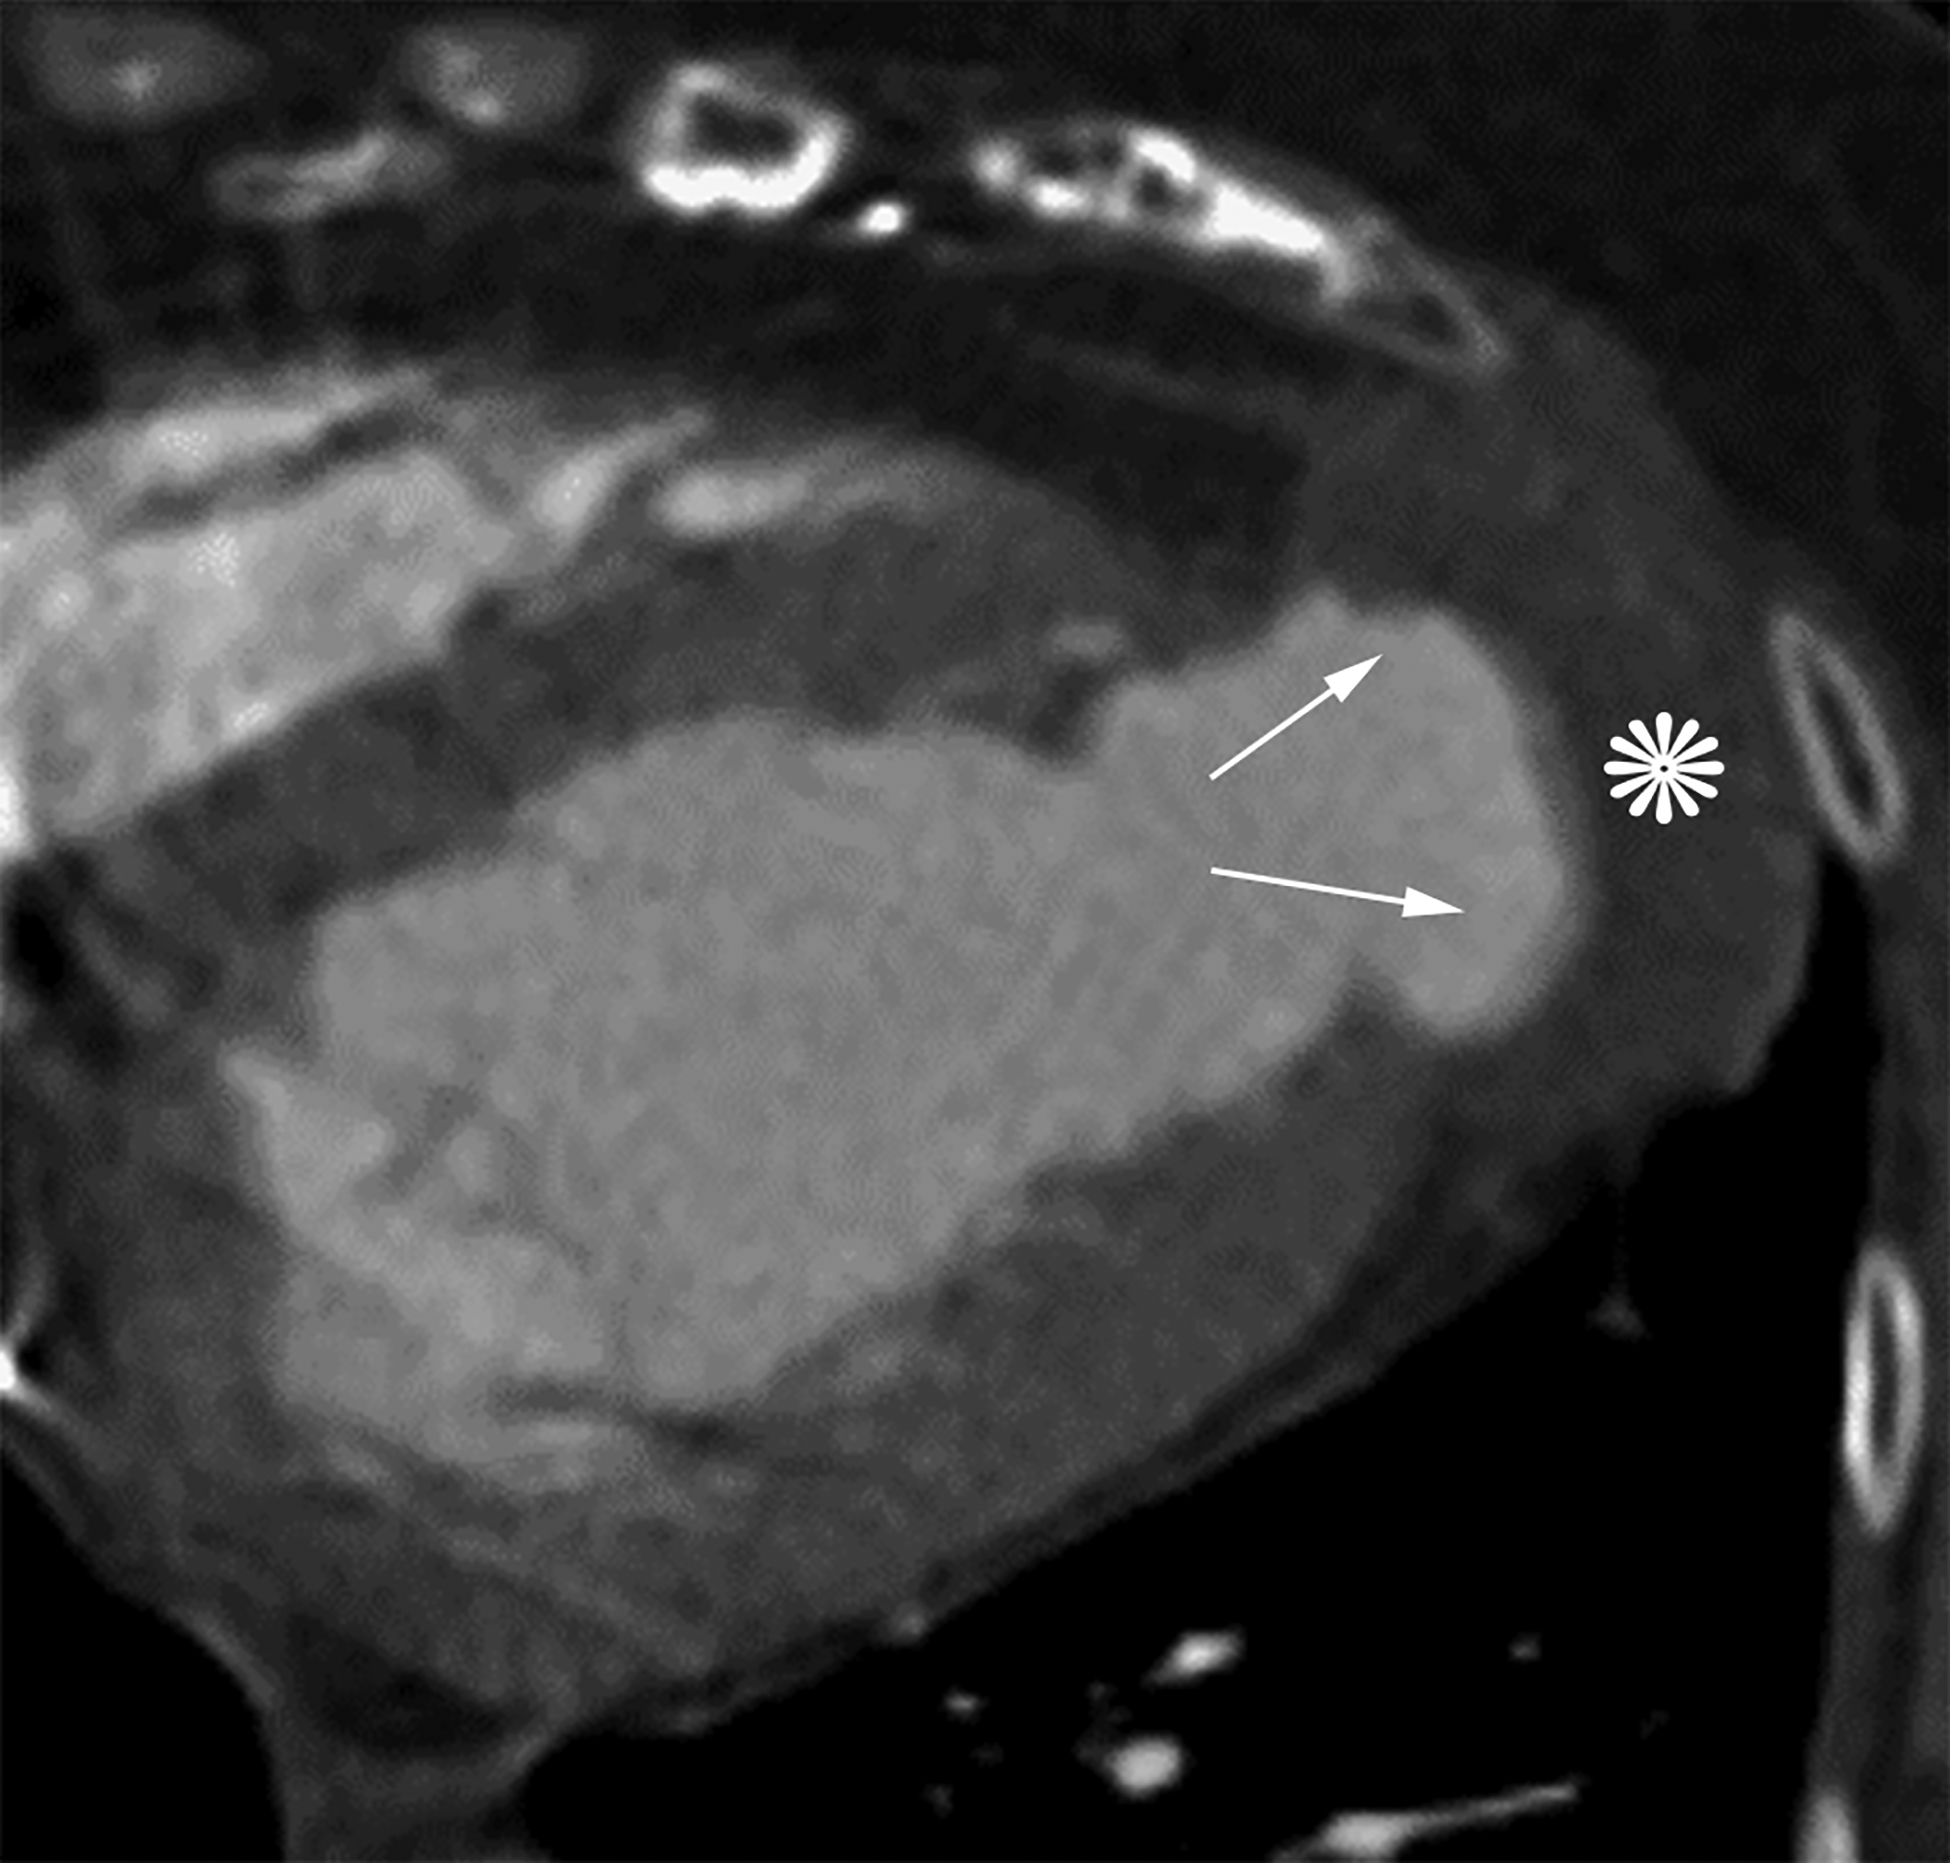
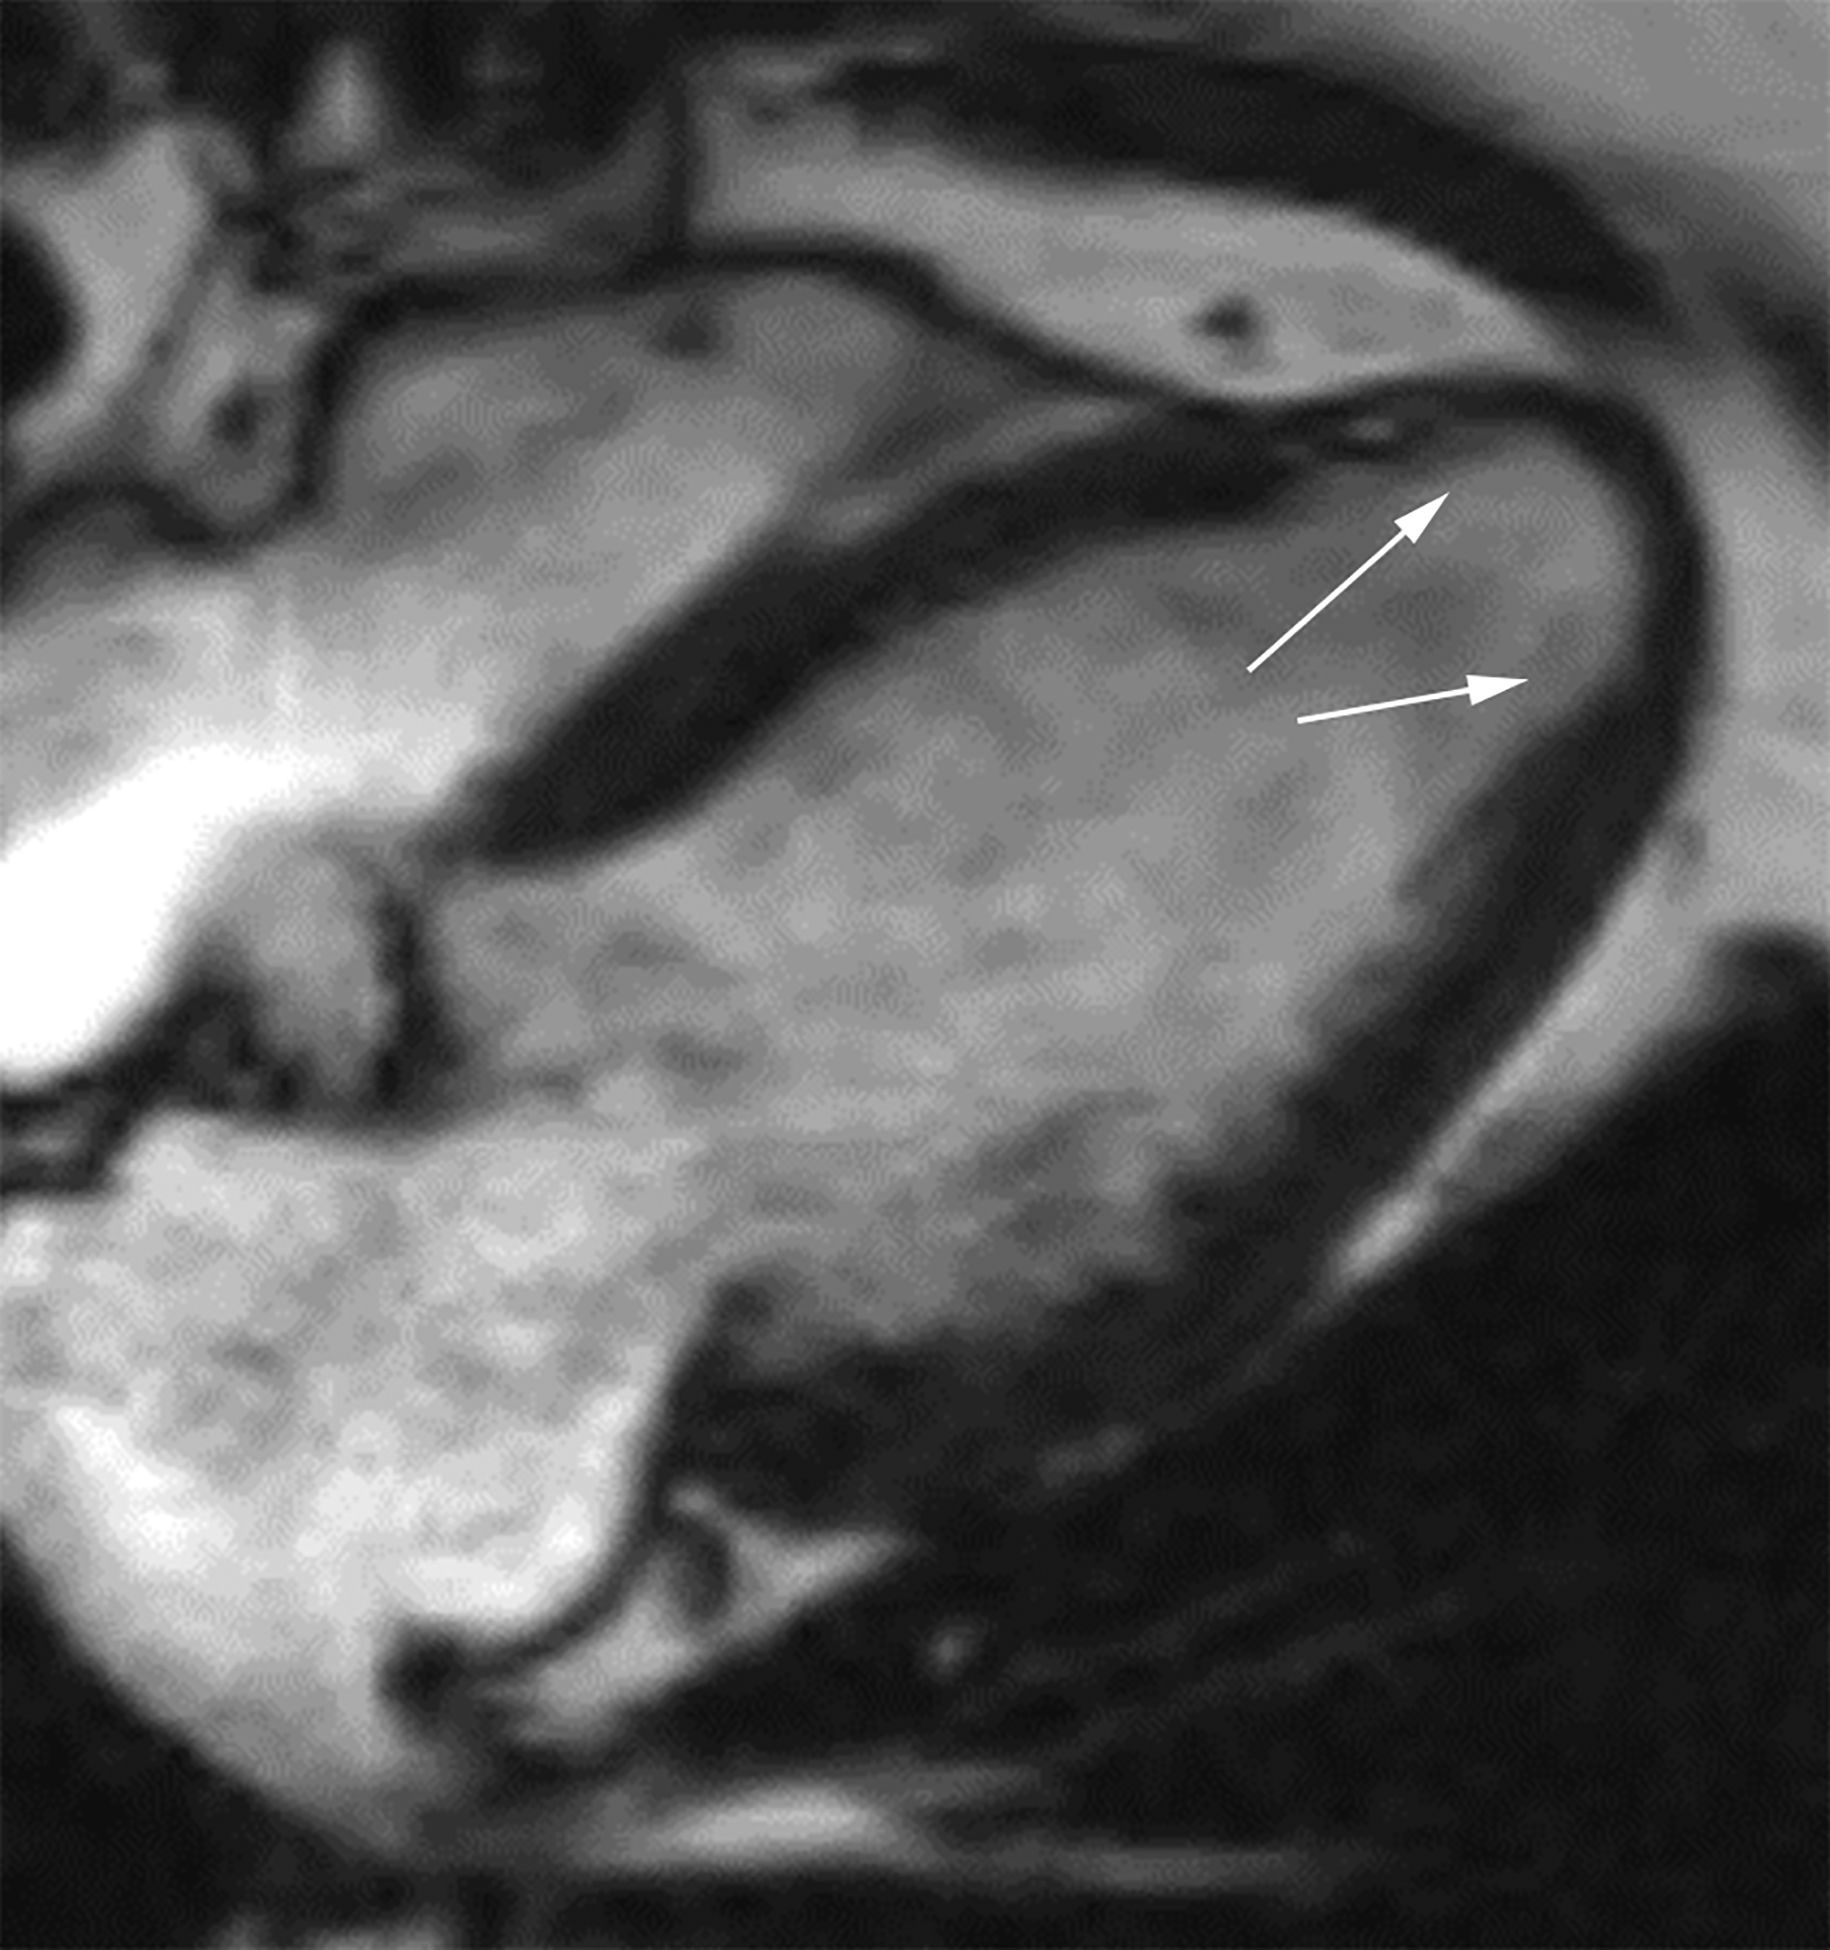
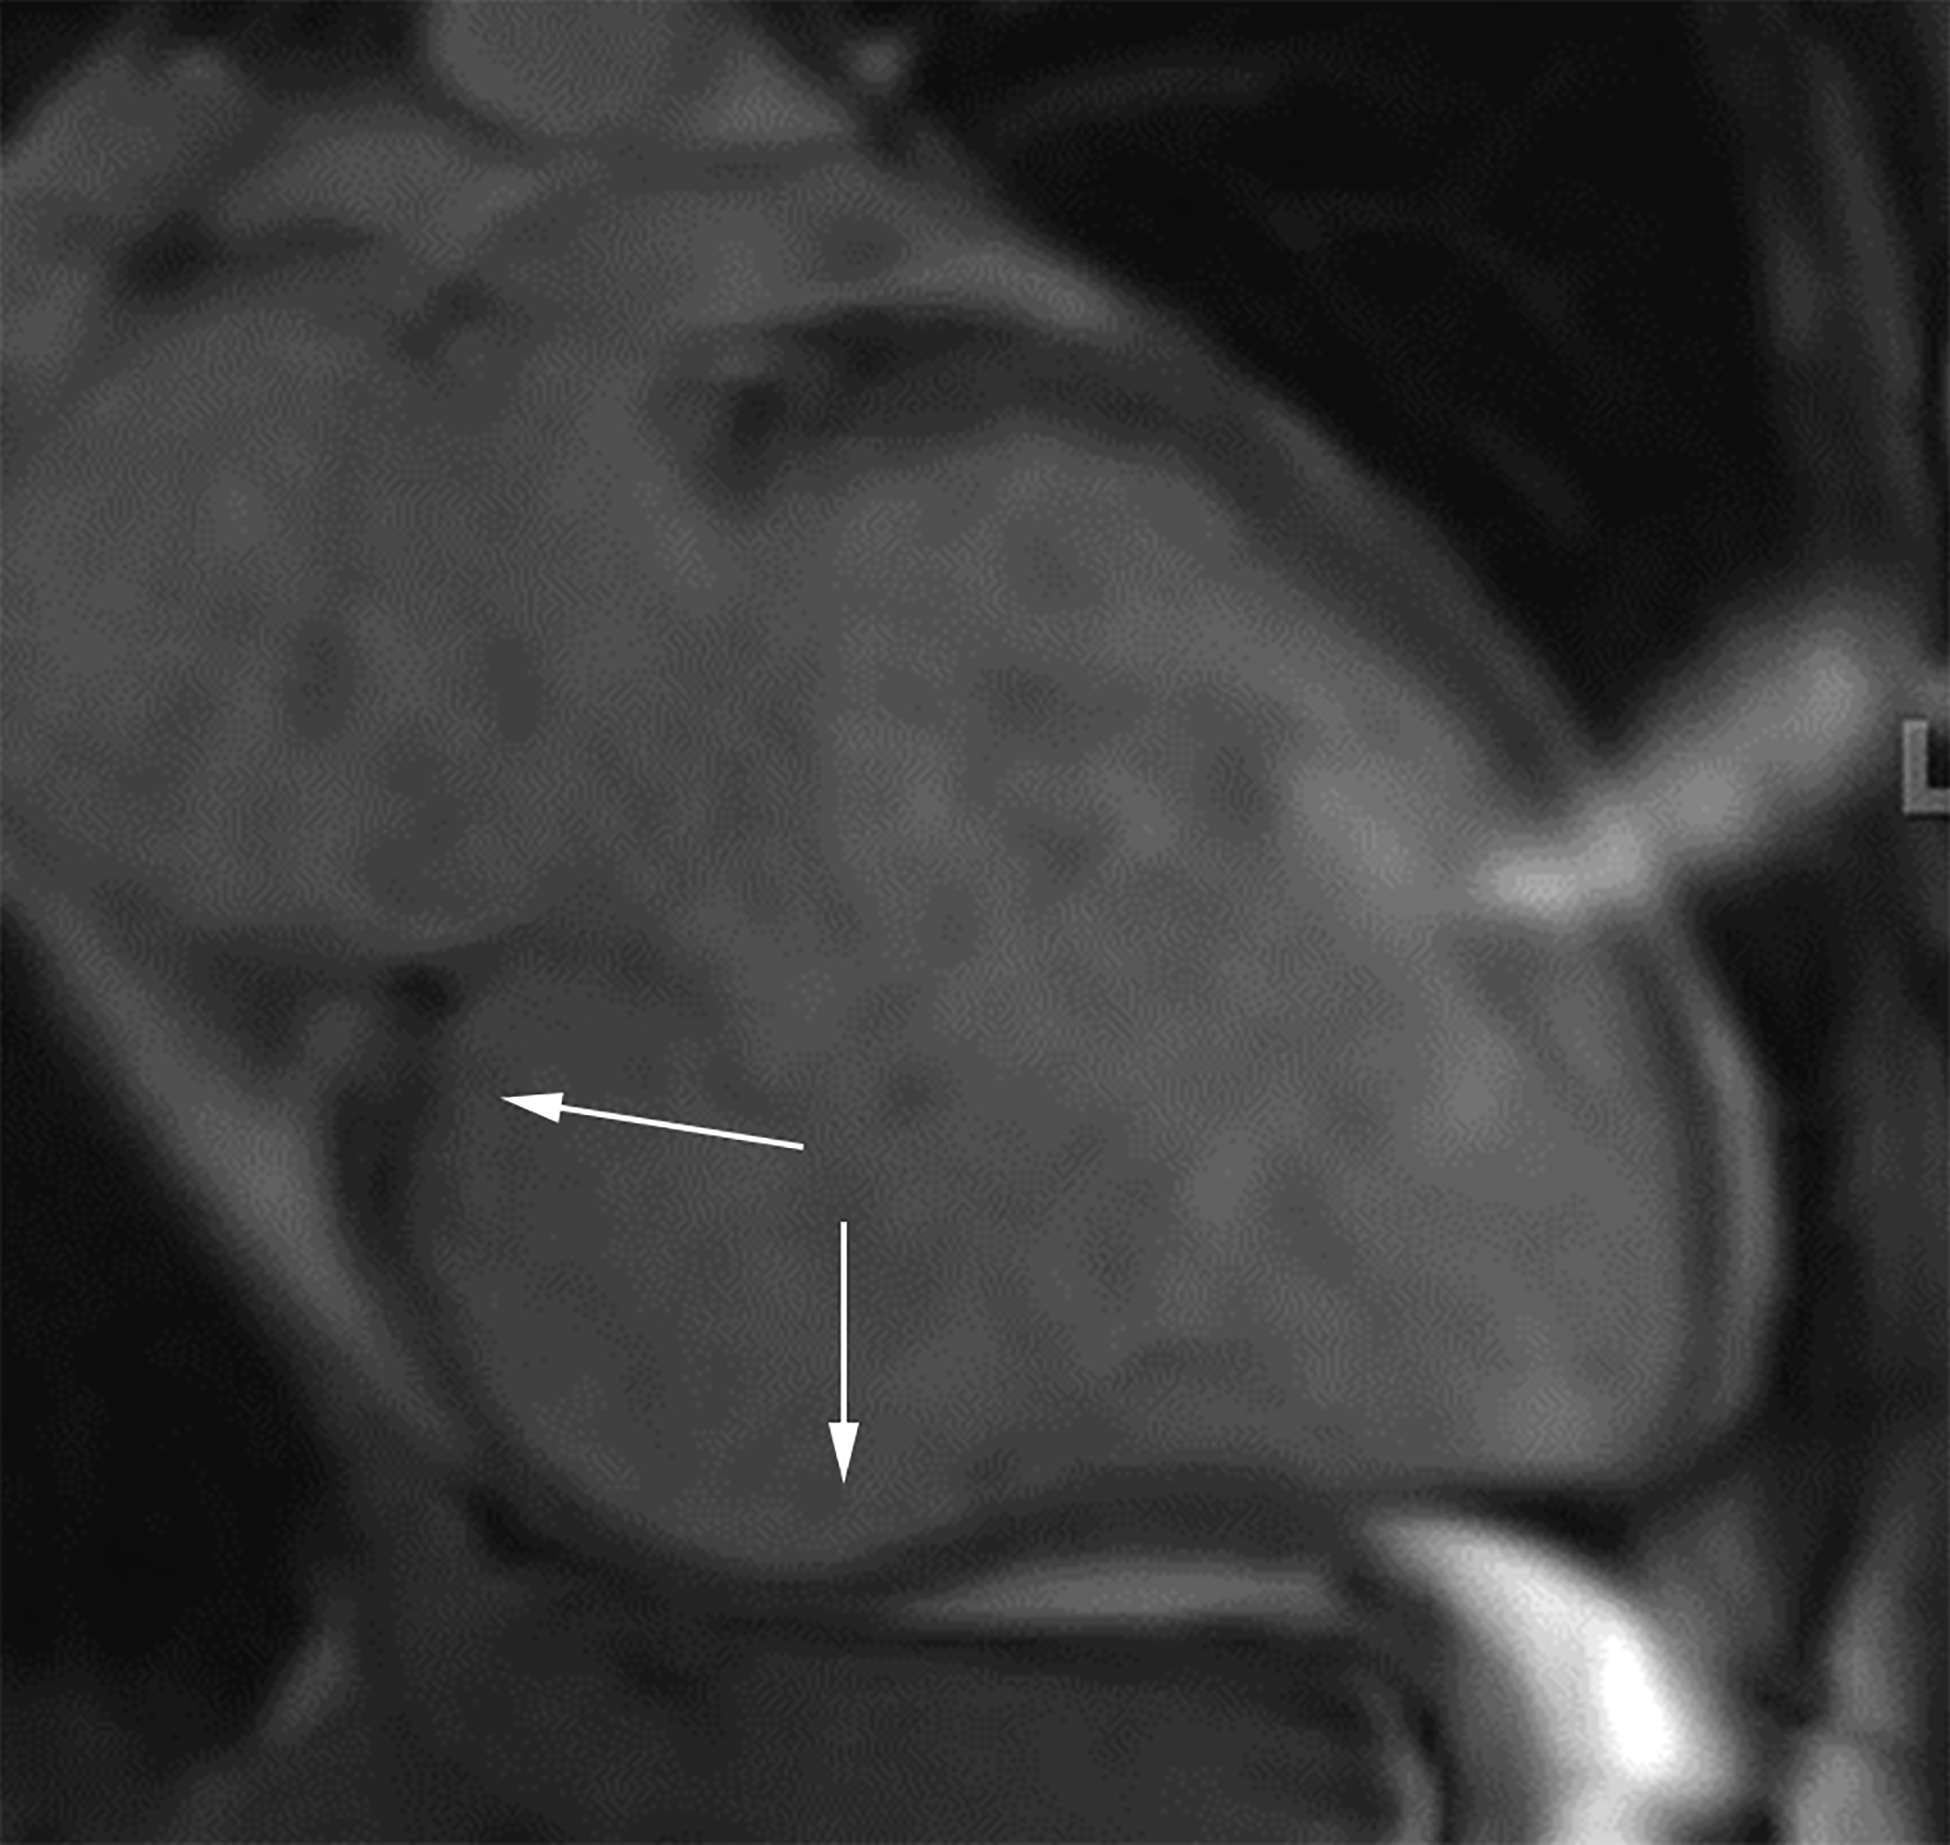
Axial (a) and axial oblique (b) contrast-enhanced CT images from two separate patients with LV PSAs. The lateral (a) and inferior basal wall is a common location for LV PSAs, but they can still happen in the apex (b). Note the thrombus lining the sac walls (*). Static bright blood cine horizontal long axis (c) and vertical long axis (d) MR images from two separate patients with true LVAs. The anteroapical wall (c) is the most common location, but true LVAs can also involve the inferior (d) and lateral walls.
TABLE 3.
Imaging features of true left ventricular aneurysms versus pseudoaneurysms.
| Left ventricular pseudoaneurysm | Left ventricular true aneurysm | p-values | |
|---|---|---|---|
| Apical Location | 5/17 (29%) | 13/18 (72%) | p=0.01 |
| Free Flap | 5/17 (29%) | 0/18 (0%) | p=0.013 |
| Pericardial Enhancement | 8/8 (100%) | 1/9 (11%) | p=0.002 |
| Thrombus | 15/17 (88%) | 5/18 (28%) | p=0.001 |
The median sac neck width was 4.9 cm for LVAs and 2.8 cm for LV PSAs (p=0.02). Median maximum sac width was 5.0 cm for LVAs and 6.4 cm for LV PSAs (p=0.22). The ratio of neck width to maximum sac width was 0.93 for LVAs and 0.57 for LV PSAs (p<0.001). Using a cut-off ratio of greater than 1.1:1 (sac to neck width) was 100% sensitive and 80% specific for LV PSAs. Median maximum sac depth was 2.9 cm for LVAs and 4.4 cm for LV PSAs (p=0.05). The ratio of neck width to maximum sac depth was 1.54 for LVAs and 0.73 for LV PSAs (p<0.001). Using a cut-off ratio of greater than 1:1 (depth to neck width) is 80% sensitive and 80% specific for LV PSAs (Figure 8) (Table 4).
Figure 8.
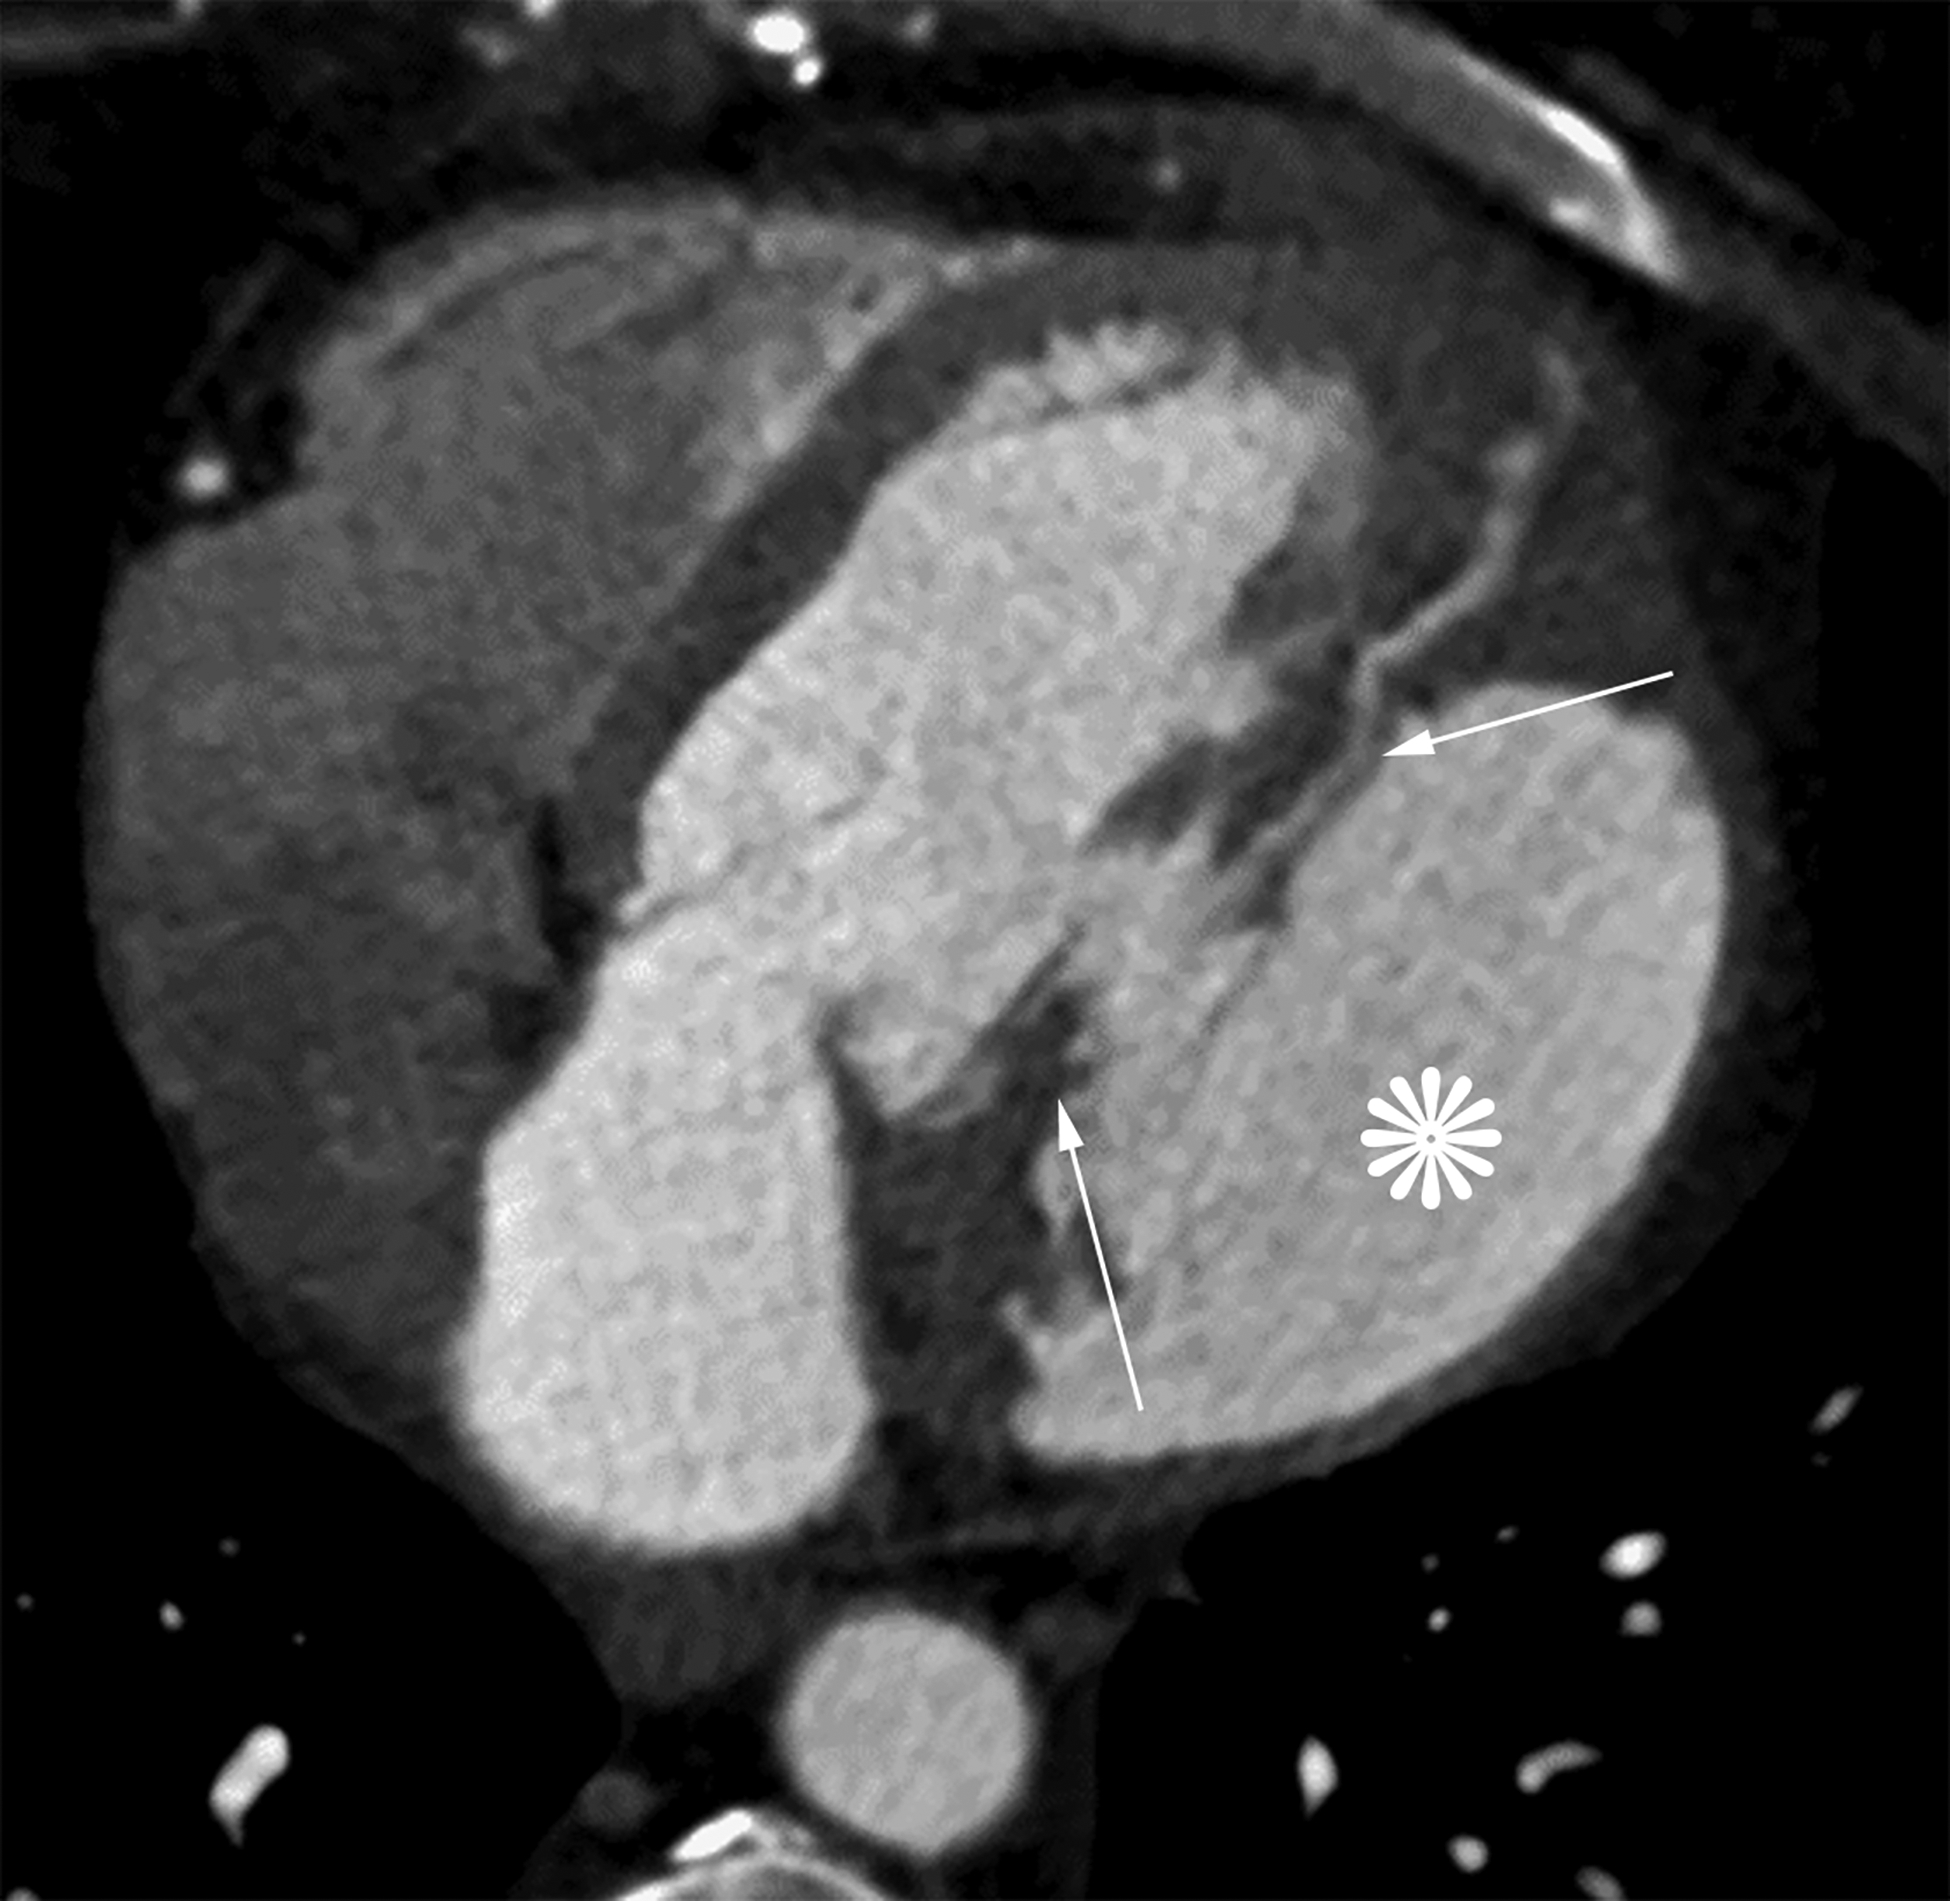
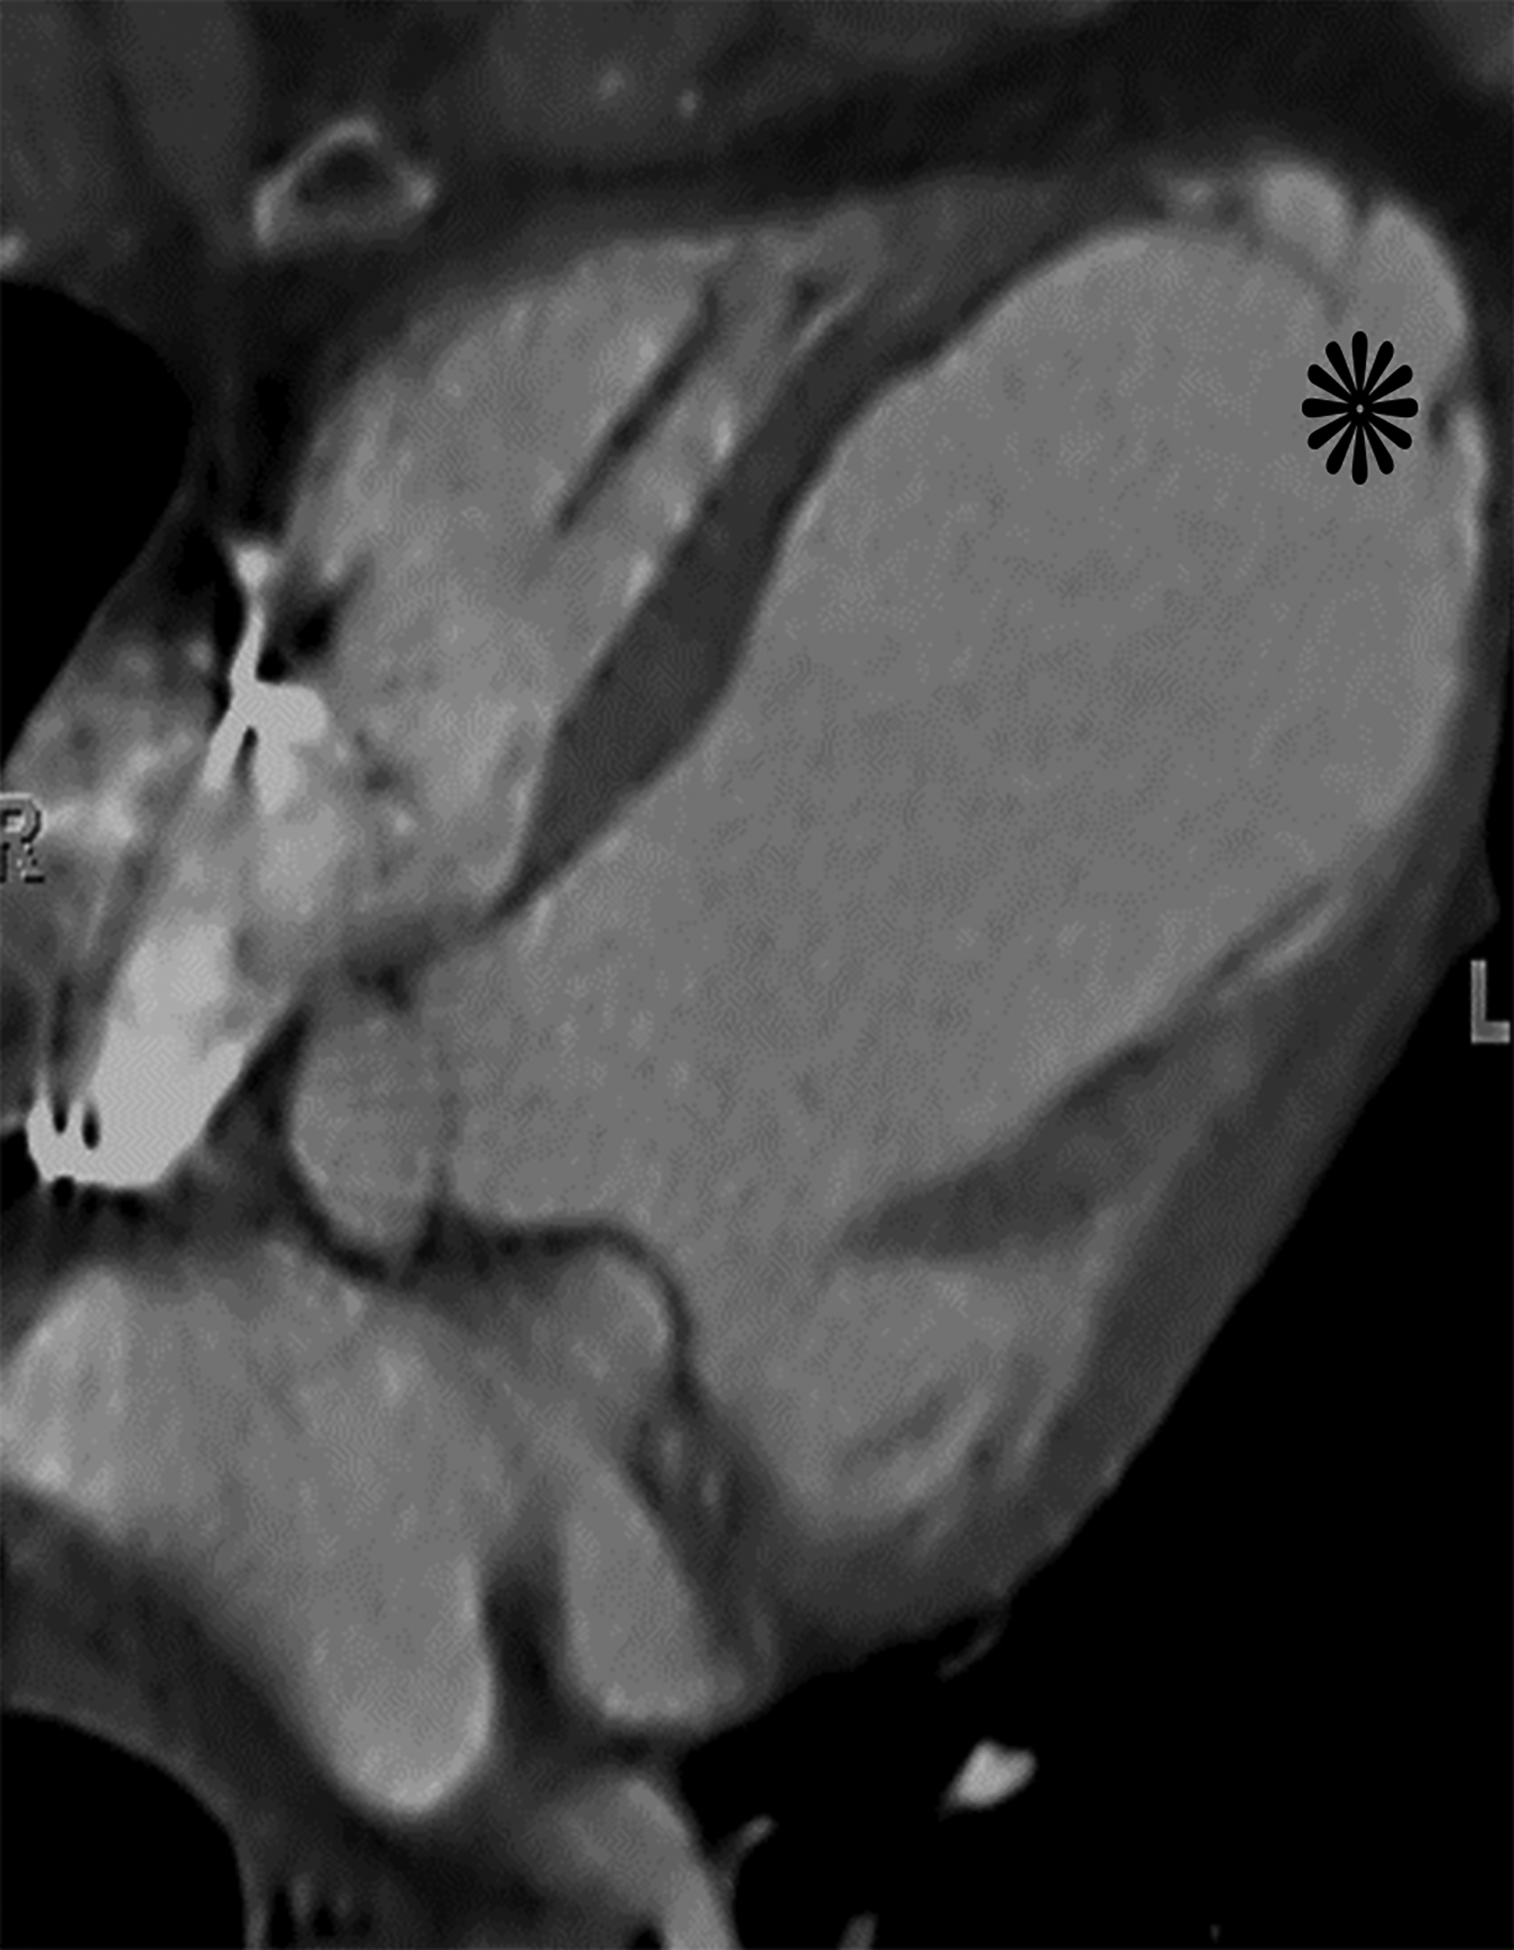
Axial oblique contrast-enhanced CT (a) from a patient with a prior lateral wall LV PSA status post patch repair. The patch (arrow) had dehisced resulting in a recurrent LV PSA (white *). Note the narrow neck relative to the sac size. Axial oblique contrast-enhanced CT (b) from a patient with a large left anterior descending infarct with resultant apical true LVA (black *). Note the relatively wide neck. Also notice the smooth tapering of myocardium near the sac neck.
TABLE 4.
Differences in sac morphology of true left ventricular aneurysms versus pseudoaneurysms.
| Left ventricular pseudoaneurysm | Left ventricular true aneurysm | p-value | |
|---|---|---|---|
| Median Neck Width | 2.8 ± 2.4 cm | 4.9 ± 2.8 cm | p=0.02 |
| Median Sac Max Width | 6.4 ± 2.6 cm | 5.0 ± 2.3 cm | p=0.22 |
| Ratio of Neck to Sac Width | 0.57 ± 0.23 | 0.93 ± 0.14 | p<.0001 |
| Median Sac Depth | 4.4 ± 1.7 cm | 2.9 ± 2.1 cm | p=0.05 |
| Ratio of Neck to Sac Depth | 0.73 ± 0.33 | 1.54 ± 0.52 | p<.0001 |
Head-to-head comparison of sensitivities and specificities of the myocardial cut-off compared to ratios involving sac morphology for LV PSA are displayed in Table 5. A case example where the myocardial cut-off sign was helpful in differentiating a LV PSA compared to a LVA is provided in Supplemental Figure 3.
TABLE 5.
Myocardial cut-off sign compared to sac morphology performance for left ventricular pseudoaneurysm. Head-to-head comparison of sensitivities and specificities involving the myocardial cut-off subjective assessment and objective measurements compared to ratios involving the sex width or depth compared to the neck width.
| Sensitivity | Specificity | |
|---|---|---|
| Subjective myocardial cut-off Reader 1 | 94% | 94% |
| Subjective myocardial cut-off Reader 2 | 100% | 78% |
| Objective: Measurement at 1 cm (bilateral measurements) | 91% | 97% |
| Objective: Measurement at 2 cm (bilateral measurements) | 100% | 51% |
| Sac width to neck width ratio >1.1:1 | 100% | 80% |
| Sac depth to neck width ratio > 1:1 | 80% | 80% |
DISCUSSION:
LV PSA, a possible complication of myocardial infarction, is a rupture of the myocardium contained by overlying pericardial adhesions.1 In contrast, a post-infarction LVA is a focal outpouching containing all three layers of the cardiac wall, including thinned areas of scarred myocardium that is dyskinetic.9 It is important to accurately distinguish LVAs from LV PSAs because of their differences in management. Due to their potential to rupture, LV PSAs are usually urgently repaired surgically2, whereas LVAs are typically managed medically, often with anticoagulation therapy. Typical features suggestive of LV PSAs have been described for echocardiography3–5, angiography6, and cross-sectional imaging8, 10–13. However, due to the limitations of the imaging modalities and the overlapping imaging features of LVAs and LV PSAs, it frequently remains challenging to distinguish these two entities.
The results of the present study suggest that the myocardial cut-off sign, described as a greater than 50% decrease in aneurysm sac wall thickness measured at 1 cm from the aneurysmal neck, is a sensitive (91%), and specific (97%) complement to other imaging findings which can improve radiologists’ accuracy at differentiating LV PSAs from LVAs. This result parallels expected the gross and histopathologic appearance of these entities, and allows more accurate differentiation of LV PSAs from LVAs, which generally have a smoother tapering of sac wall thickness. Additionally, subjective determinations by two fellowship-trained cardiothoracic radiologists of whether the myocardium appeared “cut-off” was 94–100% sensitive and 78–94% specific when distinguishing LV PSAs from LVAs.
Location was one of the earliest documented imaging features used to differentiate an LVA from an LV PSA because a majority of LV PSAs are either inferior or lateral wall in location.9 The majority (13 of 18) of the LVAs in the present study were apical in location, while a minority (5 of 17) of LV PSAs were apical and the majority (12 of 17) of LV PSAs involved either the inferior or lateral left ventricle wall. This is consistent with both Higgins et al.’s6 angiographic findings, in which 72% of the studied postinfarction LV PSAs were located in the inferolateral or inferior wall, compared with only 4% of studied LVAs, and Yeo et al.’s5 echocardiography reporting in which 82% of false aneurysms were inferolateral in location. Similarly, none of the LVAs analyzed by Konan et al.8 were located in the inferior left ventricular wall. However, it is important to note that in many autopsy studies, a significant difference in location has not yet been established for LVAs versus LV PSAs. For example, Loop et al.14 reported an incidence of 15–36% of LVAs located posteriorly at autopsy versus only 3% recorded clinically. Posterior infarctions often involve the papillary muscles, leading to severe mitral regurgitation that is often fatal. Therefore, extensive inferioposterior myocardial infarctions often result in death before an aneurysm is clinically diagnosed.9, 14
The importance of sac morphology, particularly the ratio of sac width and sac depth to the width of the aneurysmal neck, with LV PSAs showing higher ratios, was first recognized by Catherwood et al.3 on transthoracic echocardiograms (TTE) and has been confirmed by subsequent studies.8 LV PSAs demonstrate an ostial width over internal width ratio of less than 1 while for LVAs, the ratio is typically greater than 1.3–6, 15 This study is concordant with the previous studies as our mean ratio of neck width to maximum sac depth was 1.54 for LVAs and 0.73 for LV PSAs (p<0.0001).
The presence of delayed pericardial enhancement is more commonly seen in LV PSAs than in LVAs.8, 13 The exact mechanism of this delayed enhancement is not yet known but is thought to be related to scar tissue formation.10 Konan et al.8 hypothesized that irritation of the pericardium related to adjacent inflammatory changes acutely leads to a fibrotic reaction with resultant delayed pericardial enhancement on MRI. Our results support this finding as pericardial enhancement was seen in 1 of 9 patients with LVAs and 8 of 8 patients with LV PSAs. The total number of patients with this finding is less than the total number of patients evaluated because delayed enhancement cannot be evaluated by CT and delayed pericardial enhancement was only analyzed for patients with preoperative MRIs. It is unknown if obtaining venous phase acquisitions on cardiac ECG-gated studies would be able to discern pericardial enhancement similar to MR. Pericardial enhancement on CT has not been well studied, particularly in LV PSA. One study on pericarditis showed that pericardial enhancement was poorly sensitive but had a high specificity for pericarditis; however, that study had a high proportion of arterial phase CT acquisitions (bolus tracked off the pulmonary artery or aorta).16 Future work is warranted to assess the potential role of venous phase CT acquisition to assess for pericardial enhancement in evaluating known aneurysmal dilation of the left ventricle.
Thrombus formation and subsequent embolic events are a known complication of left ventricular aneurysms.9, 17 Thrombus forms in LVAs secondary to stasis, whereas in LV PSAs, there is stasis and endocardial disruption, comprising two of the three factors in Virchow’s triad. Theoretically, one would expect thrombus to be more prevalent and larger in LV PSAs. In this study, thrombus was present in 5 of 18 LVAs and 15 of 17 LV PSAs and thrombus lining exceeding 50% of sac wall thickness was present in 3 of 18 LVAs and 10 of 17 LV PSAs These findings suggest our assumptions regarding increased thrombogenesis in an LV PSA sac vs. an LVA sac are correct. This finding is concordant with Konan et al.’s8 reporting of a mural thrombus in 100% of their patients with LV PSAs versus 39% of their patients with LVAs. We hypothesize that one reason that more studies historically have not been able to demonstrate a significant difference in thrombus formation between LVAs and LV PSAs is the difficulty in distinguishing a mural thrombus from myocardium on echocardiography.18 As demonstrated by Mollet et al.19, contrast enhanced cardiac MRI is a more sensitive modality for detection of left ventricular thrombus compared to echocardiography, likely related to its better spatial and contrast resolution.
There are several limitations to this study. A small sample size is one important limitation, although our LV PSA sample size is, to our knowledge, the largest in the literature for this type of comparative study. The sample size for LVAs was small, likely because relatively few patients with LVAs require operative management. Another limitation is the reference standard of either intra-operative assessment or pathologic analysis. Not all of the surgeons preferred to have resected cardiac tissue assessed at surgical pathology. Although not objectively assessed, a potential pitfall of using the myocardial cut-off sign is that occasionally, mural thrombus is difficult to distinguish from sac wall, resulting in a tendency to overestimate sac wall thickness. A second potential pitfall is that subendocardial late myocardial enhancement on MRI may blend with blood pool, making the sac wall appear thinner. This effect is especially pronounced with LVAs, but can be improved upon by using a lower relaxivity MR contrast agent, imaging later after injection, using a narrower display window width, or use of new black blood LGE MRI sequences20 when making sac wall thickness measurements in order to avoid this pitfall.
In conclusion, the myocardial cut-off sign is a sensitive and specific finding of LV PSA, especially when objective measurements are made. Specificity is improved with objective measurements compared to subjective assessment (97% vs. 78–94%). Additionally, the presence of pericardial enhancement, thrombus, and increased ratios of sac depth and width relative to sac neck are also findings which help differentiate LV PSAs from LVAs. Using a multi-parametric analysis integrating all of these factors may increase accuracy in the diagnosis and differentiation of LV PSAs and LVAs.
Supplementary Material
Supplemental Figure 1. Diagram demonstrating the differences in sac morphology in left ventricular true aneurysms versus pseudoaneurysms and the basis of the study sac measurements. Pseudoaneurysms tend have a relatively narrow neck relative to sac dimensions.
Supplemental Figure 2. Diagram demonstrating typical distribution of thrombus within true LVA and LV PSA. Thrombus was present in 28% (5/18) of LVAs and 88% (15/17) of LV PSAs. Presence of a free flap of myocardial tissue at the neck was seen in none (0/18) of the LVAs and 29% (5/17) of the LV PSAs.
Supplemental Figure 3. Myocardial cut-off sign differentiating LV PSA from true LVA. Static bright blood cine horizontal long axis (a), oblique sagittal (b), and horizontal long axis delayed contrast enhanced MR images in a patient with an apical aneurysmal outpouching. Factors favoring a true LVA include its location, the wide neck, and neck width to sac depth ratio greater than 1. The myocardial cut-off sign is present (arrows), favoring LV PSA. Ancillary factors that also favor LV PSA include thrombus lining the majoring of the sac (*), presence of a free (box), and diffuse pericardial enhancement (arrowheads). LV PSA was confirmed at surgical resection.
References
- 1.Van Tassel RA, Edwards JE. Rupture of heart complicating myocardial infarction: analysis of 40 cases including nine examples of left ventricular false aneurysm. Chest 1972; 61:104–116. [DOI] [PubMed] [Google Scholar]
- 2.Vlodavez Z, Coe JI, Edwards JE. True and false left ventricular aneurysms propensity for the latter to rupture. Circulation 1975; 51:567–572. [DOI] [PubMed] [Google Scholar]
- 3.Catherwood E, Mintz GS, Kotler MN, et al. Two-dimensional echocardiographic recognition of left ventricular pseudoaneurysm. Circulation 1980; 62:294–303. [DOI] [PubMed] [Google Scholar]
- 4.Gatewood RP, Nanda NC. Differentiation of left ventricular pseudoaneurysm from true aneurysm with two-dimensional echocardiography. Am J Cardiol 1980; 46:869–878. [DOI] [PubMed] [Google Scholar]
- 5.Yeo TC, Malouf JF, Reeder GS, et al. Clinical characteristics and outcome in postinfarction pseudoaneurysm. Am J Cardiol 1999; 84:592–595. [DOI] [PubMed] [Google Scholar]
- 6.Higgins CB, Lipton MJ, Johnson AD, et al. False aneurysms of the left ventricle: identification of distinctive clinical, radiographic, and angiographic features. Radiology 1978; 127:21–27. [DOI] [PubMed] [Google Scholar]
- 7.Versteegh MI, Lamb HJ, Bax JJ, et al. MRI evaluation of left ventricular function in anterior LV aneurysms before and after surgical resection. Eur J Cardiothorac Surg 2003; 23:609–651. [DOI] [PubMed] [Google Scholar]
- 8.Konen E, Merchant N, Gutierrez C, et al. True versus false left ventricular aneurysm: differentiation with MR imaging-initial experience. Radiology 2005; 236:65–70. [DOI] [PubMed] [Google Scholar]
- 9.Brown SL, Gropler RJ, Harris KM. Distinguishing left ventricular aneurysm from pseudoaneurysm: a review of the literature. Chest 1997; 111:1403–1409. [DOI] [PubMed] [Google Scholar]
- 10.Kim RJ, Fieno DS, Parrish RB, et al. Relationship of MRI delayed contrast enhancement to irreversible injury, infarct age, and contractive function. Circulation 1999; 100:1992–2002. [DOI] [PubMed] [Google Scholar]
- 11.Klein C, Nekolla SG, Bengel FM, et al. Assessment of myocardial viability with contrast enhanced magnetic resonance imaging: comparison with position emission tomography. Circulation 2002; 105:162–167. [DOI] [PubMed] [Google Scholar]
- 12.Wagner A, Mahrholdt H, Holly TA, et al. Contrast-enhanced MRI and routine single photon emission computed tomography (SPECT) perfusion imaging for detection of subendocardial myocardial infarcts: an imaging study. Lancet 2003; 361:374–379. [DOI] [PubMed] [Google Scholar]
- 13.Kumbasar B, Wu KC, Kamel IR, et al. Left ventricular true aneurysm: diagnosis of myocardial viability shown on MR imaging. AJR Am J Roentgenol 2002; 179:472–474. [DOI] [PubMed] [Google Scholar]
- 14.Loop FD, Effler DB, Webster JS, Groves LK. Posterior ventricular aneurysms: etiologic factors and results of surgical treatment. N Engl J Med 1973; 288:237–239. [DOI] [PubMed] [Google Scholar]
- 15.Duvernoy O, Wikstrom G, Mannting F, et al. Pre- and post-operative CT and MR in pseudoaneruysms of the heart. J Comput Assist Tomogr 1992; 16:401–409. [DOI] [PubMed] [Google Scholar]
- 16.Hammer MM, Raptis CA, Javidan-Nejad C, Bhalla S. Accuracy of computed tomography findings in acute pericarditis. Acta Radiol. 2014;55:1197–1202. [DOI] [PubMed] [Google Scholar]
- 17.Shabbo FP, Dymond DS, Rees GM, Hill IM. Surgical treatment of false aneurysm of the left ventricle after myocardial infarction. Thorax 1983; 38:25–30. [DOI] [PMC free article] [PubMed] [Google Scholar]
- 18.Daniel WG, Mugge A. Transesophageal echocardiography. N Engl J Med 1995; 332:1268–1279. [DOI] [PubMed] [Google Scholar]
- 19.Mollet NR, Dymarkowski S, Voldors W, et al. Visualization of ventricular thrombi with contrast enhanced magnetic resonance imaging in patients with ischemic heart disease. Circulation 2002; 106:2873–2876. [DOI] [PubMed] [Google Scholar]
- 20.Kellman P, Xue H, Olivieri LJ, et al. Dark blood late enhancement imaging. J Cardiovasc Magn Reson 2016;18:77. [DOI] [PMC free article] [PubMed] [Google Scholar]
Associated Data
This section collects any data citations, data availability statements, or supplementary materials included in this article.
Supplementary Materials
Supplemental Figure 1. Diagram demonstrating the differences in sac morphology in left ventricular true aneurysms versus pseudoaneurysms and the basis of the study sac measurements. Pseudoaneurysms tend have a relatively narrow neck relative to sac dimensions.
Supplemental Figure 2. Diagram demonstrating typical distribution of thrombus within true LVA and LV PSA. Thrombus was present in 28% (5/18) of LVAs and 88% (15/17) of LV PSAs. Presence of a free flap of myocardial tissue at the neck was seen in none (0/18) of the LVAs and 29% (5/17) of the LV PSAs.
Supplemental Figure 3. Myocardial cut-off sign differentiating LV PSA from true LVA. Static bright blood cine horizontal long axis (a), oblique sagittal (b), and horizontal long axis delayed contrast enhanced MR images in a patient with an apical aneurysmal outpouching. Factors favoring a true LVA include its location, the wide neck, and neck width to sac depth ratio greater than 1. The myocardial cut-off sign is present (arrows), favoring LV PSA. Ancillary factors that also favor LV PSA include thrombus lining the majoring of the sac (*), presence of a free (box), and diffuse pericardial enhancement (arrowheads). LV PSA was confirmed at surgical resection.


