

Abstract
To explore the characteristics and prognostic significance of genetic mutations in acute myeloid leukemia (AML), we screened the gene mutation profile of 171 previously untreated AML patients using a next‐generation sequencing technique targeting 127 genes with potential prognostic significance. A total of 390 genetic alterations were identified in 149 patients with a frequency of 87.1%. Younger age and high sensitivity to induction chemotherapy were associated with a lower number of mutations. NPM1 mutation was closely related to DNMT3A and FLT3‐internal tandem duplication (FLT3‐ITD) mutations, but mutually exclusive with ASXL1 mutation and CEBPA double mutation. In univariate analysis, ASXL1 or TET2 mutation predicted shorter overall survival (OS) or relapse‐free survival (RFS), DNMT3A, FLT3‐ITD, or RUNX1 mutation predicted a higher likelihood of remission‐induction failure, whereas NRAS mutation or CEBPA double mutation predicted longer OS. Concurrent DNMT3A, FLT3‐ITD, and NPM1 mutations predicted shorter OS. Hypomethylation agents could improve the OS in patients with DNA methylation‐related mutations. According to multivariate analysis, TET2 mutation was recognized as an independent prognostic factors for RFS. In summary, our study provided a detailed pattern of gene mutations and their prognostic relevance in Chinese AML patients based on targeted next‐generation sequencing screening.
Keywords: acute myeloid leukemia, genetic mutations, next‐generation sequencing, prognosis stratification
Genetic mutations can predict favorable or unfavorable prognosis of AML patients. Allo stem cell transplantation can provide benefits for AML patients with bad genetic mutations.
1. INTRODUCTION
Acute myeloid leukemia (AML) has the highest mortality among all kinds of hematopoietic neoplasms. Although scientists and doctors have sought for treatments that are more efficient and have less long‐term treatment‐related complications, the remission rate, and long‐term survival of AML are still unfavorable. 1 , 2 Even though standard induction therapy based on cytarabine and anthracycline followed by consolidation therapy has been used, 50%‐60% of patients would relapse, and only 40%‐50% of them could achieve long‐term survival. 3 Furthermore, because AML patients tend to be older with poor‐risk features, a large proportion is unable to tolerate intensive chemotherapy and reach complete remission (CR). Therefore, the current situation regarding the prognosis and therapy of AML remains challenging. 3
The detection of cytogenetic changes in AML patients at diagnosis for risk stratification and prediction of clinical outcomes is a routine practice, 4 , 5 , 6 but due to the heterogeneity and complexity of AML, there are discrepancies in response to chemotherapy, remission duration, and relapse between individuals, even though they carry the same cytogenetics alterations. More recently, genetic aberrations have been shown to have practical value, and some of these have been applied in National Comprehensive Cancer Network (NCCN) guideline. 6 Although some of these have been reported to correlate with specific prognoses in clinical studies, some controversy exists surrounding these genetic mutations. 7 , 8 , 9 , 10 , 11 For instance, TET2 mutation had no prognostic significance in AML according to Gaidzik's study, but its unfavorable prognostic impact on AML patients with intermediate‐risk cytogenetics (IR‐AML) was reported by Chou. 12 , 13 The impact of NRAS mutation on prognosis also changes when the study cohort varies. 5 , 14 Therefore, the exact prognostic significance of genetic mutations needs to be further evaluated in a specific cohort of patients.
For the past few decades, cytarabine plus daunomycin, idarubicin, mitoxantrone, or homoharringtonine regimen has been used as standard induction chemotherapy, but relapse is still the noticeable problem during treatment. 8 , 15 With the current application of targeted therapy to clinical practice, the treatment of AML is diverse, individualized, and specific. 16 , 17 , 18 Based on the specific genetic mutations, tyrosine kinase inhibitors, FLT3 inhibitors, and DNA methyltransferase inhibitors can improve survival in AML patients, especially those who are unable to receive conventional chemotherapy. 18 , 19 , 20 , 21 , 22 , 23 Therefore, studies focusing on genetic mutations and targeted agents could provide enormous benefits for AML patients.
A targeted next‐generation sequencing (NGS) technique, a novel kind of applied method for detecting molecular genetic mutations with potential prognostic value, is able to avoid waste of resources and time involved in detecting meaningless mutations. 24 , 25 At this point, no comprehensive studies about AML genomics using targeted NGS technique are available for Chinese patients. Therefore, in this study, we explored the characteristics and prognostic significance of genetic mutations using targeted NGS screening in Chinese AML patients.
2. METHODS AND MATERIALS
2.1. Patient selection
In this study, we enrolled 171 previously untreated AML patients at our unit, and targeted NGS was performed on bone marrow (BM) or peripheral blood (PB) specimens from all enrolled patients from August 2009 to October 2017. The clinical features of the patients, including age, gender, time to diagnosis, origin of disease, karyotype, French‐American‐British (FAB) subtype, hemoglobin level, white blood cell (WBC) count, platelet count, percentage of BM blast, and therapy regimens, are described in Table 1. Secondary AML (s‐AML) was defined as AML with antecedent hematological disorders. Therapy‐related AML (t‐AML) was defined as disease related to prior chemotherapy or toxic exposure history, and de novo AML was defined as disease without antecedent hematological disease or prior cytotoxic therapy. Cytogenetics risk stratification was based on the 2017 European LeukemiaNet risk stratification by genetics. 26 The study was conducted in accordance with the principles of the Declaration of Helsinki. Signed informed consents were obtained from all patients prior to inclusion in the genetic analyses.
Table 1.
Clinical characteristics of 171 patients with newly diagnosed AML
| Variant | Value |
|---|---|
| Median age (years old) | 48 (19‐88) |
| Gender ratio (male/female) | 93:78 |
| Median hemoglobin (g/L) | 81 (26‐145) |
| Median WBC count (×109/L) | 14.1 (1‐333) |
| Median platelets (×109/L) | 42 (5‐621) |
| BM blasts (%) | 54.65 (4‐94) |
| Origin of disease | |
| de novo AML | 153 (89.5%) |
| s‐AML | 15 (8.8%) |
| t‐AML | 3 (1.7%) |
| Cytogenetics | |
| Low‐risk | 8 (4.7%) |
| Intermediate‐risk | 125 (73.1%) |
| High‐risk | 20 (11.7%) |
| Undetermined | 18 (10.5%) |
| FAB subtype | |
| M1 | 4 (2.3%) |
| M2 | 43 (25.1%) |
| M4 | 60 (35.1%) |
| M5 | 46 (26.9%) |
| M6 | 7 (4.1%) |
| Undetermined | 11 (6.5%) |
| Response to chemotherapy | |
| 1 cycle CR | 78 (45.6%) |
| 2 cycles CR | 29 (17.0%) |
| 3 or more cycles CR | 5 (2.9%) |
| NR | 18 (10.5%) |
| Not involved | 41 (24.0%) |
| Patients receiving different therapy | |
| Conventional chemotherapy alone | 84 (49.1%) |
| HMAs alone | 48 (28.1%) |
| Conventional chemo & HMAs | 29 (16.9%) |
| No chemotherapy | 18 (9.9%) |
| Transplantation | |
| Allo‐HSCT | 53 (31.0%) |
| Auto‐HSCT | 5 (2.9%) |
| No HSCT | 113 (66.1%) |
| Median follow‐up term (months) | 9.5 (0.03‐96.07) |
Abbreviations: WBC, white blood cell; BM, bone marrow; s‐AML, secondary AML; t‐AML, therapy‐related AML; CR, complete remission; NR, nonremission; HMAs, hypomethylating agents; Allo‐HSCT, allogenic hematopoietic stem cell transplantation; Auto‐HSCT, autologous hematopoietic stem cell transplantation
2.2. Sequencing library construction and NGS through capture
Genomic DNA was extracted from mononuclear cells isolated from the BM or PB samples of each patient at a concentration higher than 10 ng/μL and then underwent a quality control assessment. An Illumina standard DNA library was constructed for high‐throughput sequencing and was then tested by a bioanalyzer 2100 (Agilent Technologies, USA, 50671504) to ensure peak length of approximately 350bp. The hybridization capture chip (Roche NimbleGen) was used to capture 127 specific genes (Supplementary Table S1). After quality control, captured exon libraries were assessed by quantitative PCR with a quantification kit (Kapa Biosystems, USA, NG106‐T1) at a concentration higher than 10 nmol/L.
QPCR was performed in dye method with forward primer (5’TGATACGGCGACCACCGAG‐3’) and reverse primer (5’ AAGCAGAAGACGGCATACGAG‐3’). The following protocol was used: 3 min at 95℃; 35 cycles of 15s at 95℃ and 30s at 60℃. The range of the obtained Ct values was from 15 to 35. And the libraries were sequenced by a Nextseq 550 high‐throughput sequencing instrument (Illumina, USA, 13DW0002). The detailed description of targeted region was shown in Table S2. More information including sequencing metrics was also provided (Table S3).
2.3. Data process and bioinformatics analysis
After sequencing, the raw data underwent preprocessing and quality control procedures, which were performed by commercially available tools. Eligible data were aligned to the human reference genome (GRCh37) using BWA algorithms (V0.7.12). 27 PCR duplication was marked by Picard, whereas the BaseRecalibrator of GATK software (V3.5) 28 was used to adjust the results of the data alignment. Based on the paired samples, MuTect2 software (V3.5) was used to gauge single nucleotide variants (SNV) and inversion and deletion (indel) variants. 29 In addition, FLT3‐internal tandem duplication (FLT3‐ITD) mutation and MLL partial tandem duplication (MLL‐PTD) identification were accomplished by methods developed in‐house. All the results were annotated with ANNOVAR (V0722). 30 Variant allele frequency (VAF) was calculated as the number of the variant reads divided by the total number of reads for the mutation position. VAF ≥ 1% retained for further analysis.
2.4. Statistical analysis
Overall survival (OS) was defined as the period from diagnosis to the end point, such as death or the last time of follow‐up. Relapse‐free survival (RFS) was defined as the period from first complete remission to relapse, death or the last time of follow‐up. Sensitive response to chemotherapy was defined as reaching CR status through one or two cycles of induction of chemotherapy, whereas refractory response to chemotherapy was defined as primary induction failure or reaching CR through three or more cycles of induction of chemotherapy. The CR rate was calculated after two cycles of induction chemotherapy.
All the statistical processes were performed using SPSS software (version 19.0). Shapiro‐Wilk test was used to explore whether the values in each group had normal distribution because the number of samples was far below 5000. ANOVA was used to calculate the difference in mutation number among groups if the values in each group had normal distribution; if not, nonparametric tests (>2 groups, Kruskal‐Wallis test; =2 groups, Mann‐Whitney U test) were used. Two‐sample Student's t‐test was used to compare continuous variables (age, hemoglobin level, WBC count, platelet count, and percentage of BM blast) in different groups differed by mutational status of genes. The chi‐squared test and Fisher's exact test were used to compare the differences in response to chemotherapy and other categorical variables (gender, cytogenetic‐risk, origin of disease, and FAB subtype) with specific mutational status. OS and RFS were calculated using Kaplan‐Meier analysis and the COX proportional hazard regression analysis was used for multivariate survival analysis. A two‐sided p value was considered to indicate statistical significance if P < .05.
3. RESULTS
3.1. Spectrum of genetic mutations in AML
The clinical characteristics of the 171 patients with newly diagnosed AML are shown in Table 1. As shown in Figure 1, a total of 390 genetic alterations were identified in 149 patients among 171 cases with a frequency of 87.1%. There were 22 patients without detectable mutations, whereas 112 patients were found to have at least two mutations. All variants detected in our research were exhibited in Tables S4 and S5. There were eight genes mutated in more than 10% of patients. The most commonly mutated gene was NPM1 (24.0%), followed by DNMT3A (19.3%), FLT3‐ITD (18.1%), CEBPA double mutation (CEBPA dm 13.5%), NRAS (13.5%), TET2 (13.5%), IDH2 (11.1%), and WT1 (11.1%) (Figure S1).
Figure 1.

The landscape of genetic mutations classified into nine functional clusters (Activated signaling genes, chromatin modifier, cohesion‐complex, DNA methylation‐associated genes, mucleophasmin, spliceosome‐complex, transcription factors, tumor suppressor, and others) in adult acute myeloid leukemia (AML)
3.2. Co‐occurrence and mutual exclusivity pattern of genetic mutations in AML
We explored the co‐occurrence and mutual exclusivity pattern of genetic mutations with frequencies higher than 10% in the entire cohort of AML patients. Although the frequencies of ASXL1, RUNX1, and SRSF2 are lower than 10% in the total cohort, we still took them into consideration cause they have been reported to strongly correlate with AML prognosis. As shown in Figure 2, NPM1 mutation was significantly correlated with DNMT3A (p<0.001) and FLT3‐ITD (p<0.001) mutations, but was mutually exclusive with CEBPA dm (P = .017) and ASXL1 mutations (P = .024). Besides, FLT3‐ITD is also accompanied with DNMT3A mutations (P = .005). Mutant ASXL1 was significantly correlated with SRSF2 (p<0.001) and RUNX1 mutations (P = .023) (Figure S2).
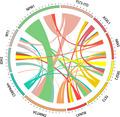
Figure 2.

Circos diagram representing the co‐occurrence of gene mutations in DNMT3A, FLT3‐ITD, NRAS, TET2, CEBPAdm, IDH2, WT1, RUNX1, ASXL1, SRSF2, and NPM1. The length of the arc represents the frequency of mutations in the first gene, and the width of the ribbon represents the percentage of patients carrying a mutation in the second gene
3.3. Association of genetic mutations with baseline clinical features of AML patients
We studied the relationships of genetic mutations with baseline clinical features of AML patients, including age, gender, cytogenetic risk, BM blast percentage, FAB subtype, and hemoglobin, WBC and platelet counts at diagnosis (Table S6). FLT3‐ITD was associated with a higher count of WBCs at diagnosis (P = .004) and tended to occur in female patients (P = .002). RUNX1, DNMT3A, and ASXL1 mutations were more likely to exist in older patients (P = .038, P = .013, and P = .022, respectively). In addition, a higher mutation rate of ASXL1 was found in patients with lower levels of hemoglobin (P = .018), and CEBPA dm predominated in those with higher levels of hemoglobin (P = .003). Notably, other gene mutations were not found to be significantly associated with the above clinical features.
We then studied the relationship between the numbers of genetic mutations and clinical characteristics including age, FAB classification, origin of disease, cytogenetic risk, and response to chemotherapy (Table S7). As stated before, we made normality test for each comparison and found that at least one group did not have normal distribution. Therefore, Kruskal‐Wallis test and Mann‐Whitney U test were used to complete multiple comparison. With regard to age, we divided all patients into three groups (18‐39, 40‐59,≥60) and found that the number of genetic mutations in patients aging from 18 to 39 was significantly lower than that in patients aging from 40 to 59 (P = .043) and those over 60 years old (P = .016, Figure S3A). With regard to response to chemotherapy, we found sensitive patients had a significantly lower number of genetic mutations than those with refractory disease (P = .031, Figure S3B). Stratified by FAB subtype, patients in M4 subtype carried a significantly higher number of genetic mutations than those in M2 or M5 subtype (P = .004 and 0.010, respectively; Figure S3C). But considering cytogenetic risk and origin of disease, respectively, we found no significant difference in the number of mutations among each subgroup (Supplementary Figure SD‐E).
3.4. Genetic mutation predicted rate of complete remission
We evaluated the impact of single genetic mutation on the rate of CR in the total cohort of AML patients and different subgroups according to the origin of disease and cytogenetic risks. As for the following survival analysis, we still make the same exclusion. In the total cohort, the rate of CR was significantly lower in patients with FLT3‐ITD (60.9% vs. 86.1%, P = .008) or mutant DNMT3A (64.0% vs. 85.8%, P = .019) than in those without the above gene mutations. In patients with IR‐AML, besides those with mutations in FLT3‐ITD (60.0% vs. 84.5%, P = .026) or DNMT3A (59.1% vs. 85.4%, P = .014), patients with mutant RUNX1 (42.9% vs. 82.5%, P = .029) had a significantly lower rate of CR than those with wild type. In patients with de novo AML, FLT3‐ITD (55.0% vs. 87.7%, P = .002) or DNMT3A (62.5% vs. 87.3%, P = .013) mutations remained an unfavorable factor predicting a lower rate of CR compared with the absence of these gene mutations (Table S8).
3.5. Genetic mutation predicted survival
We evaluated the prognostic significance of genetic mutations classified by functional clustering in aspects of age, origin of disease, and cytogenetic risk. In our study, mutant TET2, DNMT3A, ASXL1, and FLT3‐ITD showed inferior impacts on survival of AML patients, whereas NRAS mutation and CEBPAdm exhibited the opposite influence.
TET2 and DNMT3A belong to the DNA methylation‐associated gene family. In this study, although mutant TET2 did not influence OS in the total cohort, TET2 mutations were associated with an adverse RFS in the total cohort (2‐year RFS: 25.5% vs 76.5%, P < .001; Figure 3A). Regarding cytogenetic risk, we found that mutant TET2 had an inferior impact on RFS in IR‐AML (2‐year RFS: 0% vs 75.2%, P = .004) as well as in CN‐AML (2‐year RFS: 0% vs 83.9%, P < .001) (Figure S4A‐B). Mutant DNMT3A did not display any impact on survival when the study cohort included all the patients, but a significantly unfavorable impact on OS of mutant DNMT3A could be observed in CN‐AML (2‐year OS: 44.3% vs 60.9%, P = .024; Figure S4C).
Figure 3.

Kaplan‐Meier curves for survival of patients with or without specific genetic mutations in AML. The green and blue lines represent the survival of patients with or without mutations, respectively. (A) RFS for patients with or without TET2 mutations (P < .001). (B) OS for patients with or without ASXL1 mutations (P = .042). (C) RFS for patients with or without ASXL1 mutations (P = .057). (D) OS for patients with or without CEBPAdm (P = .083). RFS, relapse‐free survival; OS, overall survival
The ASXL1 gene is a member of a chromatin modifier gene family, predicting significantly unfavorable OS (2‐year OS: 29.0% vs 57.7%, P = .042) and a trend of inferior RFS (2‐year RFS: 0% vs 72.3%, P = .057) in the total cohort of patients (Figure 3B‐C). Mutant ASXL1 was also related to an unfavorable OS in patients under the age of 60 years (2‐year OS: 33.3% vs 64.0%, P = .015) or with IR‐AML (2‐year OS: 26.3% vs 55.8%, P = .025; Figure S4D‐E).
FLT3‐ITD and NRAS belong to the activated signaling gene family. In this study, we did not find a prognostic impact of FLT3‐ITD on the survival of AML. However, when we restricted the study cohort to within patients not receiving allogeneic hematopoietic stem cell transplantation (allo‐HSCT), the patients with FLT3‐ITD had a significantly inferior OS compared to those with wild‐type FLT3 (2‐year OS: 0% vs 38.0%, P = .014) (Figure S4F). Mutant NRAS was associated with a superior OS both in patients with IR‐AML (2‐year OS: 76.4% vs 48.7%, P = .014) (Figure S4G) and in CN‐AML (2‐year OS: 100% vs 51.0%, P = .010) (Figure S4H).
CEBPα belongs to a transcription factor gene family. In this study, CEBPA dm conveyed a better trend of OS in AML (2‐year OS: 70.5% vs 52.7%, P = .083; Figure 3D). If we restricted the study cohort to patients under 60 years of age, CEBPA dm was associated with a significantly prolonged OS (2‐year OS: 80.8% vs 58.8%, P = .041; Figure S4I). With respect to RFS, CEBPA dm has no impact on RFS of AML patients in the total cohort in our study (2‐year RFS: 80.7% vs 70.4%, P = .734).
3.6. Concurrent mutations of DNMT3A, FLT3‐ITD, and NPM1 predicted inferior survival
Since each of DNMT3A, FLT3‐ITD, and NPM1 genes predicted relatively higher incidences of mutation compared to other genes in the total cohort and significantly co‐occurred with each other, we explored their comprehensive prognostic meanings in AML. At first, we compared patients harboring these three mutations with those harboring any two of these mutations. Among AMLDNMT3A +/ FLT3 ‐ITD+/ NPM1 +, AMLDNMT3A +/ NPM1 +/ FLT3 ‐ITD‐, AMLDNMT3A +/ FLT3 ‐ITD+/ NPM1 ‐, and AMLFLT3 ‐ITD+/ NPM1 +/ DNMT3A ‐, there was no significant difference in OS. Then we compared AMLDNMT3A +/ FLT3 ‐ITD+/ NPM1 + with those harboring any one of these mutations (AMLDNMT3A ‐/ FLT3 ‐ITD+/ NPM1 ‐, AMLDNMT3A +/ FLT3 ‐ITD‐/ NPM1 ‐, and AMLDNMT3A ‐/ FLT3 ‐ITD‐/ NPM1 +) and found a difference in OS (2‐year OS: 0% vs 15.6% vs 50.0% vs 81.8%, P = .063), with AMLDNMT3A ‐/ FLT3 ‐ITD‐/ NPM1 + having the best OS (Figure 4A). AMLDNMT3A +/ FLT3 ‐ITD+/ NPM1 + still conveyed a significantly reduced OS (2‐year OS: 0% vs 56.1%, P = .011) compared with genotypes without any of these three mutations (Figure 4B).
Figure 4.
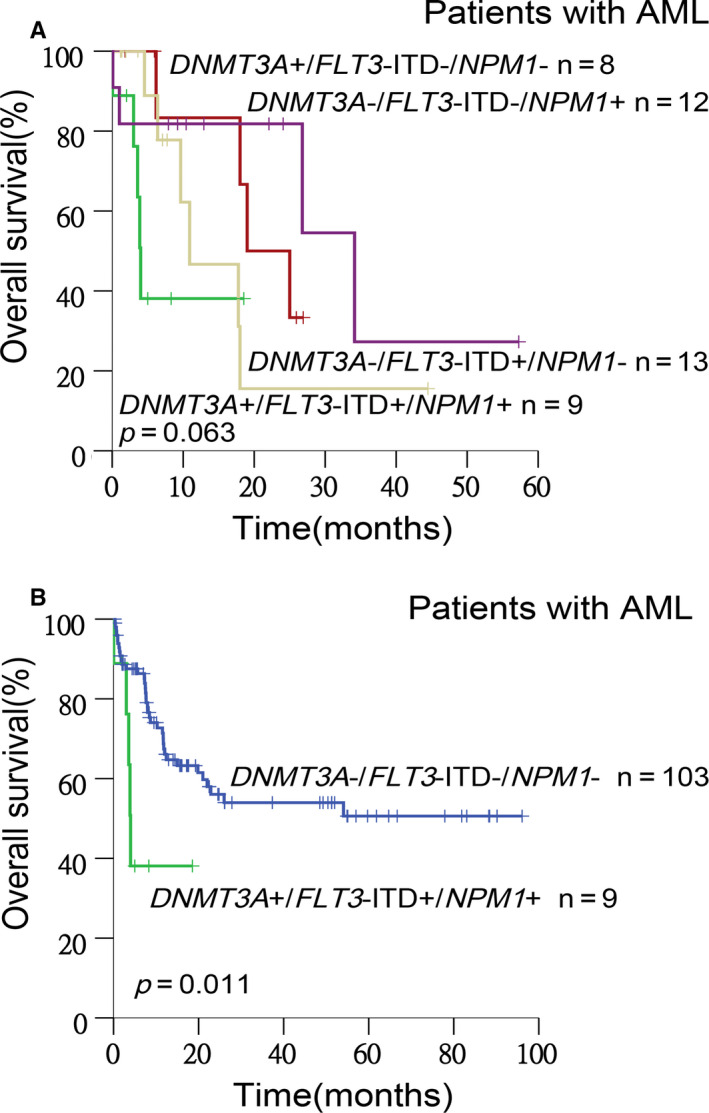
Kaplan‐Meier curves for OS stratified by the mutation status determined by DNMT3A, FLT3, and NPM1 genes. Lines in different colors represent the survival of patients in different groups, respectively. (A) A difference in OS was shown among AMLDNMT3A +/ FLT3 ‐ITD+/ NPM1 +(the green line), AMLDNMT3A ‐/ FLT3 ‐ITD+/ NPM1 ‐(the yellow line), AMLDNMT3A +/ FLT3 ‐ITD‐/ NPM1 ‐(the red line), and AMLDNMT3A ‐/ FLT3 ‐ITD‐/ NPM1 +(the purple line) (P = .063). (B) AMLDNMT3A +/ FLT3 ‐ITD+/ NPM1 +(the green line) had significantly reduced OS compared with AMLDNMT3A ‐/ FLT3 ‐ITD‐/ NPM1 ‐(the blue line) (P = .011)
3.7. The effect of a hypomethylating agent on DNA methylation‐associated genetic mutation
Based on the above observations that DNA methylation‐associated genetic mutation is related to unfavorable survival, there have been many kinds of treatments used in AML patients. Among patients harboring DNMT3A mutations, some had ever been given hypomethylating agents (HMAs), whereas others had never been given HMAs, so we further explored the exact benefit of HMAs in AML patients carrying such types of mutations. We found that patients with mutant DNMT3A receiving HMA treatment displayed a significantly better OS than those not receiving HMA treatment (2‐year OS: 72.2% vs 25.5%, P = .010). Patients with mutant TET2 also displayed a trend of better OS after HMA treatment, although the superiority wasn't statistically significant (2‐year OS: 48.5% vs 12.5%, P = .080; Figure 5A‐B). But HMAs did not prolong the RFS of AML patients with TET2 (2‐year RFS: 0 vs not reach, P = .206) or DNMT3A mutation (2‐year RFS: 66.7% vs 50.0%, P = .305), which needs to be explored further due to the small sample size of specific cohort.
Figure 5.

Kaplan‐Meier curves for OS of AML patients with the DNA methylation‐associated genetic mutation stratified by the situation of using HMA. In DNMT3A‐mutated (A) or TET2‐mutated (B) group, patients receiving HMA therapy (the green lines) had better OS than those never receiving HMA (the blue lines) (P = .010 and 0.080, respectively). HMAs, hypomethylating agents
3.8. Multivariate analysis of survival of AML patients
Variables including age, gender, origin of disease, cytogenetic risk, FAB subtype, WBC count, treatment response, HMA treatment, high‐dose cytarabine treatment, transplantation, and genetic mutations were included in the multivariate analysis. For OS, allo‐HSCT was an independent favorable factors, whereas a WBC count of more than 100 × 109/L and failure to achieve a CR after two cycles of induction chemotherapy were unfavorable factors. For RFS, with the exception of allo‐HSCT, TET2 mutation and s‐AML were independent unfavorable factors (Table 2). Notably, we confirmed the favorable effect of HMA on DNA methylation‐associated genetic mutations, but in multivariate analysis, the use of HMAs was not an independent prognostic factor (Table S9).
Table 2.
Multivariate analysis for survival of newly diagnosed AML patients
| Factors | HR (95%CI) | p value |
|---|---|---|
| OS | ||
| Allo‐HSCT (yes vs no) | 0.337 (0.157‐0.724) | .005 |
| WBC count (>100 × 109/L vs ≤ 100×109/L) | 2.634 (1.066‐6.509) | .036 |
| Number of cycles to CR (≥3 cycles vs ≤ 2 cycles) | 5.313 (2.733‐10.328) | <.001 |
| RFS | ||
| Origin of disease (s‐AML vs de novo AML) | 24.405 (2.373‐250.944) | .007 |
| Allo‐HSCT (yes vs no) | 0.234 (0.077‐0.704) | .010 |
| TET2 mutation (yes vs no) | 7.569 (2.308‐24.818) | .001 |
Abbreviations: OS, overall survival; Allo‐HSCT, allogenic hematopoietic stem cell transplantation; WBC, white blood cell; CR, complete remission; RFS, relapse‐free survival; s‐AML, secondary AML.
4. DISCUSSION
AML is a kind of hematopoietic neoplasm with high heterogeneity, which is reflected by complex cytogenetic changes and molecular genetic aberrancy. 31 AML patients were divided into three risk groups based on the NCCN guideline: low‐risk cytogenetics, intermediate‐risk cytogenetics and high‐risk cytogenetics. 6 Moreover, molecular genetic markers also play a critical role in judging risk and prognosis assessment. 32 , 33 , 34 , 35 Therefore, testing genetic markers at diagnosis and performing precise risk stratification for therapeutic guidance and maximum efficiency is highly practical.
In our study, the five most common mutated genes were successively NPM1, DNMT3A, FLT3‐ITD, NRAS, and CEBPAdm, nearly in accordance with the result of Metzeler's study in which the top five mutated genes were FLT3, NPM1, DNMT3A, NRAS, and RUNX1. 36 No significant difference in frequencies of mutations was observed.
According to the multistage hypothesis of tumor evolution, various mutations can contribute to the development of tumor, accumulate and play roles in different stages, leading to the growing number of genetic mutations. In this study, we explored the association of the number of genetic mutations with clinical characteristics and found that the number of gene mutations was significantly lower in AML patients aging from 18 to 39 years old than in those over 40 years old within adult patients, suggesting that the number of gene mutation in each AML patient increased with age. With respect to the response to chemotherapy, the phenomenon of sensitive patients having significantly fewer genetic mutations than refractory patients exhibiting a strong relationship between mutation number and chemotherapeutic effect indicates that patients with more mutations tend to be more difficult to cure completely; thus, this type of patient needs to be actively scheduled for allogeneic hematopoietic stem cell transplantation.
In the total cohort, NPM1 mutation was significantly correlated with FLT3‐ITD and DNMT3A mutations, but was mutually exclusive with ASXL1 mutation and CEBPA dm in our study, which was in accordance with other reports and suggested that NPM1 mutation might share a similar mechanism carcinogenesis with ASXL1 mutation and CEBPA. 1 , 37 , 38 As reported previously, TET2 and IDH mutations are mutually exclusive with each other, 39 but we did not find such a phenomenon in our study.
According to our results, ASXL1 and TET2 mutations, both belonging to epigenetic‐related genes, significantly predicted inferior OS and RFS. There is still controversy over TET2 mutation regarding its prognostic impact on AML in different studies. 40 , 41 We confirmed that TET2 mutation had an unfavorable impact on RFS not OS in AML, not only in the total cohort, but also in the IR‐AML and CN‐AML subgroups, suggesting that the unfavorable impact of TET2 mutations was independent of cytogenetics. To exclude the effect of allo‐HSCT, we used chi‐squared test and found that whether patients received allo‐HSCT or not had no association with whether patients carried TET2 mutations or not. So the result wasn't an effect of allo‐HSCT (Table S10). Besides, in multivariate analysis, the impact of TET2 mutation on RFS remained significant; thus, TET2 mutation might be correlated with relapse of leukemia. Also, its occurrence is an early event in the course from normal hematopoiesis to AML, which plays an important role in diagnosis, risk stratification, and therapy guidance. 42 Furthermore, although DNMT3A mutation did not show any prognostic impact in the total cohort of AML patients, it was associated with significantly unfavorable OS in CN‐AML subgroup. Notably, ASXL1, TET2, and DNMT3A genes are all epigenetic‐related genes, so our results suggested their roles in the occurrence and progression of AML.
We found that in addition to DNMT3A, FLT3‐ITD, and RUNX1 mutations were also related to chemotherapy resistance. There was no difference in survival between AML patients with FLT3‐ITD and patients with wild‐type FLT3, but in cases not receiving allo‐HSCT, FLT3‐ITD was associated with a significantly reduced OS, illustrating that allo‐HSCT might overcome the adverse effect of FLT3‐ITD on the survival of AML patients.
NPM1 mutation, a widely reported favorable prognostic factor of survival in AML, 5 , 36 , 42 had no association with prognosis in AML in our study. In light of the fact that AMLDNMT3A ‐/ FLT3 ‐ITD‐/ NPM1 + had the best OS compared with AMLDNMT3A +/ NPM1 +/ FLT3 ‐ITD‐, AMLDNMT3A +/ FLT3 ‐ITD+/ NPM1 ‐, and AMLDNMT3A +/ FLT3 ‐ITD+/ NPM1 +, we hypothesized that the concomitant DNMT3A and FLT3‐ITD mutations probably neutralized its favorable impact on survival. Based on our results showing that patients harboring concurrent NPM1, FLT3‐ITD, and DNMT3A mutations had the worst OS, these patients need to be scheduled for allogeneic hematopoietic stem cell transplantation in the early stage of AML. Both Metzeler and Papaemmanuil concluded that mutations in TP53 had independent deleterious effects on survival. Besides, Papaemmanuil also confirmed the adverse effects of mutations in chromatin‐spliceosome genes and the positive effects of mutations in IDH R172. But in our study, we did not reach the conclusions above, which might be the result of the small size of the samples. 5 , 36
HMAs have been widely used in clinical medicine. We confirmed their superiority in treating epigenetic‐related mutations compared to conventional chemotherapy in patients with DNMT3A and those with TET2 mutations, although the difference in TET2 mutated cohort did not reach significance. The lack of significance might be caused by the small sample size, and the relatively short follow‐up period of some patients could also be one of the reasons.
In addition, nowadays there is no specific standard of VAF cutoffs, in our study we used 1% VAF.
In summary, our study provided a detailed pattern of gene mutations and their clinical correlations and prognostic relevance in 171 Chinese AML patients based on NGS screening. We hope our work will contribute to genetic classification‐based prognostic prediction systems and improvements in patient outcomes by targeted therapeutic approaches.
CONFLICT OF INTEREST
The authors declare no competing financial interests.
AUTHOR CONTRIBUTION
RQW, HW, BHW and MZW had contributions in collecting clinical information of selected patients. CJC, JYQ, DWL, JW and HMZ completed the entire experimental processes. RQW and JYQ completed all statistical analyses and constructed figures. RQW wrote the manuscript. XNG and LY were the main contributors in revising the manuscript. Other authors provided some advice on the manuscript. All authors read and approved the final manuscript.
Supporting information
Supplementary Material
Table S3
Table S5
ACKNOWLEDGEMENTS
This work was partially supported by grants from the National Natural Science Foundation of China (81670162 and 81470010 to Y L, 81670135 and 81870109 to X‐N G).
Wang R‐Q, Chen C‐J, Jing Y, et al. Characteristics and prognostic significance of genetic mutations in acute myeloid leukemia based on a targeted next‐generation sequencing technique. Cancer Med. 2020;9:8457–8467. 10.1002/cam4.3467
Rui‐Qi Wang, Chong‐Jian Chen, Xiao‐Ning Gao, and Li Yu contributed equally to this work.
Contributor Information
Xiao‐Ning Gao, Email: gaoxn@263.net.
Li Yu, Email: liyu301@vip.163.com.
DATA AVAILABILITY STATEMENT
The data that support the findings of this study are available on request from the corresponding author. The data are not publicly available due to privacy.
REFERENCES
- 1. Kihara R, Nagata Y, Kiyoi H, et al. Comprehensive analysis of genetic alterations and their prognostic impacts in adult acute myeloid leukemia patients. Leukemia. 2014;28:1586‐1595. [DOI] [PubMed] [Google Scholar]
- 2. Siegel RL, Miller KD, Jemal A. Cancer Statistics, 2017. CA Cancer J Clin. 2017;67(1):7‐30. [DOI] [PubMed] [Google Scholar]
- 3. Daver N, Cortes J, Kantarjian H, et al. Acute myeloid leukemia: advancing clinical trials and promising therapeutics. Expert Rev Hematol. 2016;9(5):433‐445. [DOI] [PMC free article] [PubMed] [Google Scholar]
- 4. Vosberg S, Herold T, Hartmann L, et al. Close Correlation of Copy Number Aberrations Detected by Next‐Generation Sequencing with Results from Routine Cytogenetics in Acute Myeloid Leukemia. Genes Chromosom Cancer. 2016;55(7):553‐567. [DOI] [PubMed] [Google Scholar]
- 5. Papaemmanuil E, Gerstung M, Bullinger L, et al. Genomic Classification and prognosis in Acute Myeloid Leukemia. N Engl J Med. 2016;374(23):2209‐2221. [DOI] [PMC free article] [PubMed] [Google Scholar]
- 6. O'Donnell MR, Tallman MS, Abboud CN, et al. Acute Myeloid Leukemia, Version 3.2017, NCCN Clinical Practice Guidelines in Oncology. J Natl Compr Canc Netw. 2017;15(7):926‐957. [DOI] [PubMed] [Google Scholar]
- 7. Bullinger L, Döhner K, Döhner H. Genomics of Acute Myeloid Leukemia Diagnosis and pathways. J Clin Oncol. 2017;35(9):934‐946. [DOI] [PubMed] [Google Scholar]
- 8. Sun Y, Chen BR, Deshpande A. Epigenetics regulators in the development, maintenance, and therapeutic targeting of acute myeloid leukemia. Front. Oncol. 2018;8:41. [DOI] [PMC free article] [PubMed] [Google Scholar]
- 9. Ilyas A, Ahmad S, Faheem M, et al. Next Generation Sequencing of Acute Myeloid Leukemia: Influencing prognosis. BMC Genom. 2015;16(Suppl 1):S5. [DOI] [PMC free article] [PubMed] [Google Scholar]
- 10. Duncavage EJ, Tandon B. The utility of next‐generation sequencing in diagnosis and monitoring of acute myeloid leukemia and myelodysplastic syndromes. Int Jnl Lab Hem. 2015;37(Suppl. 1):115‐121. [DOI] [PubMed] [Google Scholar]
- 11. Luthra R, Patel KP, Reddy NG, et al. Next‐generation sequencing‐based multigene mutational screening for acute myeloid leukemia using MiSeq: applicability for diagnostics and disease monitoring. Haematologica. 2014;99(3):465‐473. [DOI] [PMC free article] [PubMed] [Google Scholar]
- 12. Gaidzik VI, Paschka P, Späth D, et al. TET2 mutations in Acute Myeloid Leukemia (AML): Results From a Comprehensive Genetic and Clinical Analysis of the AML Study Group. J Clin Oncol. 2012;30(12):1350‐1357. [DOI] [PubMed] [Google Scholar]
- 13. Chou W‐C, Chou S‐C, Liu C‐Y, et al. TET2 mutation is an unfavorable prognostic factor in acute myeloid leukemia patients with intermediate‐risk cytogenetics. Blood. 2011;118(14):3803‐3810. [DOI] [PubMed] [Google Scholar]
- 14. Berman JN, Gerbing RB, Alonzo TA, et al. Prevalence and clinical implications of NRAS mutations in childhood AML: a report from Children’s Oncology Group. Leukemia. 2011;25(6):1039‐1042. [DOI] [PMC free article] [PubMed] [Google Scholar]
- 15. Ravandi F, Ritchie EK, Sayar H, et al. Vosaroxin plus cytarabine versus placebo plus cytarabine in patients with first relapsed or refractory acute myeloid leukaemia (VALOR): a randomised, controlled, double‐blind, multinational, phase 3 study. Lancet Oncol. 2015;16(9):1025‐1036. [DOI] [PMC free article] [PubMed] [Google Scholar]
- 16. Mayer J, Arthur C, Delaunay J, et al. Multivariate and subgroup analyses of a randomized, multinational, phase 3 trial of decitabine vs treatment choice of supportive care or cytarabine in older patients with newly diagnosed acute myeloid leukemia and poor‐ or intermediate‐risk cytogenetics. BMC Cancer. 2014;14:69. [DOI] [PMC free article] [PubMed] [Google Scholar]
- 17. Jiang X, Wang Z, Ding B, et al. The hypomethylating agent decitabine prior to chemotherapy improves the therapy efficacy in refractory/relapsed acute myeloid leukemia patients. Oncotarget. 2015;6(32):33612‐33622. [DOI] [PMC free article] [PubMed] [Google Scholar]
- 18. Serve H, Krug U, Wagner R, et al. Sorafenib in Combination With Intensive Chemotherapy in Elderly patients With Acute Myeloid Leukemia: Results From a Randomized, placebo‐Controlled Trial. J Clin Oncol. 2013;31(25):3110‐3118. [DOI] [PubMed] [Google Scholar]
- 19. Pemmaraju N, Kantarjian H, Andreeff M, et al. Investigational FMS‐Like Tyrosine Kinase 3 (FLT3) Inhibitors in Treatment of Acute Myeloid Leukemia (AML). Expert Opin Investig Drugs. 2014;23(7):943‐954. [DOI] [PMC free article] [PubMed] [Google Scholar]
- 20. Levis M FLT3 mutations in acute myeloid leukemia: what is the best approach in 2013? Hematology Am Soc Hematol Educ Program. 2013;2013:220‐226. [DOI] [PMC free article] [PubMed] [Google Scholar]
- 21. Ravandi F, Cortes JE, Jones D, et al. Phase I/II Study of Combination Therapy With Sorafenib, Idarubicin, and Cytarabine in Younger patients With Acute Myeloid Leukemia. J Clin Oncol. 2010;28(11):1856‐1862. [DOI] [PMC free article] [PubMed] [Google Scholar]
- 22. Fenaux P, Mufti GJ, Hellström‐Lindberg E, et al. Azacitidine prolongs Overall Survival Compared With Conventional Care Regimens in Elderly patients With Low Bone Marrow Blast Count Acute Myeloid Leukemia. J Clin Oncol. 2010;28(4):562‐569. [DOI] [PubMed] [Google Scholar]
- 23. Welch JS, Petti AA, Miller CA, et al. TP53 and Decitabine in Acute Myeloid Leukemia and Myelodysplastic Syndromes. N Engl J Med. 2016;375(21):2023‐2036. [DOI] [PMC free article] [PubMed] [Google Scholar]
- 24. Salipante SJ, Fromm JR, Shendure J, et al. Detection of minimal residual disease in NPM1‐mutated acute myeloid leukemia by next‐generation sequencing. Mod Pathol. 2014;27(11):1438‐1446. [DOI] [PMC free article] [PubMed] [Google Scholar]
- 25. Kohlmann A, Nadarajah N, Alpermann T, et al. Monitoring of residual disease by next‐generation deep‐sequencing of RUNX1 mutations can identify acute myeloid leukemia patients with resistant disease. Leukemia. 2014;28(1):129‐137. [DOI] [PubMed] [Google Scholar]
- 26. Döhner H, Estey E, Grimwade D, et al. Diagnosis and management of AML in adults: 2017 ELN recommendations from an international expert panel. Blood. 2017;129(4):424‐447. [DOI] [PMC free article] [PubMed] [Google Scholar]
- 27. Li H, Durbin R. Fast and accurate short read alignment with Burrows‐Wheeler transform. Bioinformatics. 2009;25(14):1754‐1760. [DOI] [PMC free article] [PubMed] [Google Scholar]
- 28. McKenna A, Hanna M, Banks E, et al. The Genome Analysis Toolkit: a MapReduce framework for analyzing next‐generation DNA sequencing data. Genome Res. 2010;20(9):1297‐1303. [DOI] [PMC free article] [PubMed] [Google Scholar]
- 29. Mutect‐GATK‐Forum . http://gatkforums.broadinstitute.org/gatk/discussions/tagged/mutect2?
- 30. Wang K, Li M, Hakonarson H, et al. ANNOVAR: functional annotation of genetic variants from high‐throughput sequencing data. Nucleic Acids Res. 2010;38(16):e164. [DOI] [PMC free article] [PubMed] [Google Scholar]
- 31. Zhu YM, Wang PP, Huang JY, et al. Gene mutational pattern and expression level in 560 acute myeloid leukemia patients and their clinical relevance. J Transl Med. 2017;15(1):178. [DOI] [PMC free article] [PubMed] [Google Scholar]
- 32. Liu Y, He P, Liu F, et al. Prognostic significance of NPM1 mutations in acute myeloid leukemia: A meta‐analysis. Mol Clin Oncol. 2014;2(2):275‐281. [DOI] [PMC free article] [PubMed] [Google Scholar]
- 33. Brunet S, Labopin M, Esteve J, et al. Impact of FLT3 Internal Tandem Duplication on the Outcome of Related and Unrelated Hematopoietic Transplantation for Adult Acute Myeloid Leukemia in First Remission: A Retrospective Analysis. J Clin Oncol. 2012;30(7):735‐741. [DOI] [PubMed] [Google Scholar]
- 34. Yanada M, Yamamoto Y, Iba S, et al. TP53 mutations in older adults with acute myeloid leukemia. Int J Hematol. 2016;103(4):429‐435. [DOI] [PubMed] [Google Scholar]
- 35. Preudhomme C, Sagot C, Boissel N, et al. Favorable prognostic significance of CEBPA mutations in patients with de novo acute myeloid leukemia: a study from the Acute Leukemia French Association. Blood. 2002;100(8):2717‐2723. [DOI] [PubMed] [Google Scholar]
- 36. Metzeler KH, Herold T, Rothenberg‐Thurley M, et al. Spectrum and prognostic relevance of driver gene mutations in acute myeloid leukemia. Blood. 2016;128(5):686‐698. [DOI] [PubMed] [Google Scholar]
- 37. Verhaak RGW, Goudswaard CS, van Putten W, et al. Mutations in nucleophosmin (NPM1) in acute myeloid leukemia (AML): association with other gene abnormalities and previously established gene expression signatures and their favorable prognostic significance. Blood. 2005;106(12):3747‐3754. [DOI] [PubMed] [Google Scholar]
- 38. Shen Y, Zhu Y‐M, Fan X, et al. Gene mutation patterns and their prognostic impact in a cohort of 1185 patients with acute myeloid leukemia. Blood. 2011;118(20):5593‐5603. [DOI] [PubMed] [Google Scholar]
- 39. Metzeler KH, Maharry K, Radmacher MD, et al. TET2 Mutations Improve the New European LeukemiaNet Risk Classification of Acute Myeloid Leukemia: A Cancer and Leukemia Group B Study. J Clin Oncol. 2011;29(10):1373‐1381. [DOI] [PMC free article] [PubMed] [Google Scholar]
- 40. Cher CY, Leung GMK, Au CH, et al. Next‐generation sequencing with a myeloid gene panel in core‐binding factor AML showed KIT activation loop and TET2 mutations predictive of outcome. Blood . Cancer J. 2016;6(7):e442 [DOI] [PMC free article] [PubMed] [Google Scholar]
- 41. Daver N, Liu Dumlao T, Ravandi F, et al. Effect of NPM1 and FLT3 Mutations on the Outcomes of Elderly patients With Acute Myeloid Leukemia Receiving Standard Chemotherapy. Clin Lymphoma Myeloma Leuk. 2013;13(4):435‐440. [DOI] [PMC free article] [PubMed] [Google Scholar]
- 42. Chan SM, Majeti R. Role of DNMT3A, TET2, and IDH1/2 mutations in pre‐leukemic stem cells in acute myeloid leukemia. Int J Hematol. 2013;98(6):648‐657. [DOI] [PMC free article] [PubMed] [Google Scholar]
Associated Data
This section collects any data citations, data availability statements, or supplementary materials included in this article.
Supplementary Materials
Supplementary Material
Table S3
Table S5
Data Availability Statement
The data that support the findings of this study are available on request from the corresponding author. The data are not publicly available due to privacy.