

Abstract
Recently, long noncoding RNAs (lncRNAs) were recognized as significant therapeutic targets in tumors. Our previous microarray analysis showed that lncRNA TCONS_000026334 expression was reduced in metastatic colorectal cancer (CRC) tissues. The objective of this study was to research the biological functions of TCONS_000026334 and the potential mechanism during the development of CRC. TCONS_00026334 transcription levels were detected in CRC tissues from 86 patients and different CRC cell lines. The clinical prognosis factors related to TCONS_00026334 expression were then analyzed. TCONS_000026334 was overexpressed from plasmid pcDNA3.1‐TCONS_ 000026334 or knocked down using a small interfering RNA (siRNA). Furthermore, bioinformatics approach and luciferase reporter gene assays were utilized to search for candidate miRNAs of TCONS_00026334 and identify the downstream target genes. The results indicated that TCONS_00026334 expression in 86 CRC tissues was markedly lower than that in non‐cancerous tissues. The aberrant expression of TCONS_00026334 correlated negatively with larger tumor size, distant metastasis, serological carcinoembryonic antigen level, and unfavorable survival of patients with CRC. TCONS_00026334 overexpression could inhibit the aggressive phenotypes of CRC in vitro and in vivo. Conversely, TCONS_00026334 silencing accelerated CRC cell proliferation and invasion. We then verified that TCONS_00026334 upregulated the expression level of TP53INP1, a target gene of miR‐548n, via direct binding to miR‐548n as a competing endogenous RNA. Taken together, our study showed that TCONS_00026334 acts as an anti‐tumor and anti‐metastatic gene by regulating the miR548n/TP53INP1 axis in the development of CRC.
Our study showed that lncRNA TCONS_00026334 acts as an anti‐tumor and anti‐metastatic gene by regulating the miR548n/TP53INP1 axis in the development of colorectal cancer.
1. INTRODUCTION
Globally, the burden of colorectal cancer (CRC) is increasing. 1 , 2 Due to distant metastasis and relapse, the prognosis of patients with CRC is still very poor. 3 , 4 In order to improve the early diagnosis of CRC and promote targeted therapy, it is necessary to understand in more detail the molecular mechanism of the initiation and progression of CRC. 5 , 6
Long noncoding RNAs (lncRNAs) are transcribed RNAs comprising more than 200 nucleotides without the potential of encoding proteins. LncRNAs play an important role in regulating of the occurrence, invasion, and metastasis of malignant tumors; therefore, they might represent a new group of therapeutic targets and cancer biomarkers. 7 , 8 , 9 Several studies have shown that aberrant expression or mutations of various lncRNAs, including MALAT1, GAPLINC, NEAT1, and CCAT2, enhance the metastasis, invasion, and proliferation of CRC cells. 10 , 11 , 12 , 13 However, many lncRNAs are still being discovered and are yet to be annotated, and the mechanisms involving lncRNAs in the complex progression of CRC invasion require further study. 14 In our previous investigation, transcriptome microarray analysis was conducted to explore potential differentially expressed lncRNAs from clinical tissues samples of patients with CRC with or without distant metastasis. Among the 79 differentially expressed lncRNAs, TCONS_00026334 was obviously downregulated in CRC with stage IV distant metastasis compared with that in tissues without distant metastasis, which indicated that TCONS_00026334 might play a vital role in the progression of CRC as an anti‐metastatic gene. TCONS_00026334 is a 2463‐bp sense‐overlapping lncRNA located at 18q21.2. 15 (Supplementary Information TCONS_00026334). Therefore, lncRNA TCONS_00026334 was selected as the candidate lncRNA to the study the invasion and metastasis of CRC.
As short noncoding RNAs, microRNAs (miRNAs) modulate protein‐coding genes and are involved in the pathogenesis of several diseases, including human cancers. 16 Recently, interesting interactions between lncRNAs and miRNAs have been recognized, and emerging evidence suggests that this crosstalk has a significant impact on the cancer metastasis cascade. 17 , 18 However, the molecular mechanism of the interaction between TCONS_00026334 and miRNAs in CRC is still unclear. In the current study, further bioinformatics tools and luciferase reporter gene assays were utilized to search for candidate miRNAs of TCONS_000026334 and identify the downstream target genes. The bioinformatics analysis suggested the existence of miR‐548n binding sites in TCONS_00026334 and TP53INP1, which serves as an anti‐oncogene in CRC. 19 Therefore, TP53INP1 was screened out as a novel candidate of miR‐548n. Furthermore, we verified that TCONS_000026334 acts as ceRNAs by regulating the expression of TP53INP1 through sponge miR‐548n to suppress the progression of CRC.
2. MATERIALS AND METHODS
2.1. Patients and sample collection
Eighty‐six snap‐frozen CRC samples and paired samples of peritumoral tissues were obtained from Renji Hospital between January 2013 and January 2015, with informed consent of patients and approval by the institutional ethics committee. The recruited patients had not yet received preoperative chemotherapy and/or radiation therapy. The fresh para‐tumorous tissues were sampled at 2–3 cm distal to the tumor and non‐cancerous tissues were sampled at least 5 cm distal to the tumor; all tissues were subjected to histological examination. Tumor tissues from distant metastases were obtained from 17 of the 86 patients. The specimens were collected and placed immediately at −80°C until protein or RNA was extracted.
2.2. Cell lines and cell culture
All human CRC cell lines Caco2, SW1116, HCT116, lovo, and HT29 cells, were obtained from the Cell Bank of Chinese Academy of Sciences (Shanghai, China). FHC (human fetal colon cells) was supplied by American Type Culture Collection (ATCC). All the cell lines were cultured at 37°C in a humidified atmosphere containing 5% CO2 in RPMI (Roswell Park Memorial Institute) 1640 medium from Invitrogen (Carlsbad), which contained 10% FBS (fetal bovine serum; Gibco) and 1% streptomycin/penicillin (Sigma‐Aldrich).
2.3. RNA extraction and qRT‐PCR
The total RNA was extracted from cell lines and tissues using the Trizol reagent (Invitrogen), according to the manufacturer's protocol. While nuclear and cytoplasmic RNA was extracted from cultured cells using the PARIS kit (Life Technologies) according to the manufacturer's instructions. A Reverse Transcription Kit was purchased from Takara (Shiga, Japan) for reverse transcribing, and qRT‐PCR. For lncRNA quantification, the internal control comprised mRNA encoding glyceraldehyde‐3‐phosphate dehydrogenase (GAPDH). The PCR primers for the present study are summarized in Table S1. The 2(−2Delta Delta CT) method was performed to calculate the relative expression level of lncRNA. 20
2.4. Western blotting analysis
Whole cells or tissues were lysed with RIPA lysis buffer, and protein concentrations were quantified by a BCA Protein Assay kit (Pierce Biotechnology). The separation of proteins was completed by 10% SDS‐PAGE (loaded at 30 µg/lane) and then electroblotted onto a PVDF membrane (Millipore). Incubation with 5% nonfat milk was used to block non‐specific binding to the membranes. Next, the membranes were incubated with the primary antibodies at 4°C overnight and then HRP‐conjugated secondary antibodies at room temperature for one hour. Primary antibodies against TP53INP1, β‐actin, and P21 were purchased from Abcam. ECL Western blotting system was utilized to scan the immunoreactive protein.
2.5. Proliferation assay
A CCK8 assay kit (Dojindo) was performed to measure cell viability. The 3000 cells were seeded into each well of 96‐well plates and then incubated with medium containing 1% FBS. Subsequently, each well was added ten microliters of CCK‐8 reagent at specified time intervals, and then incubated for 2 h. The cell number was measured using the absorbance at 450 nm, recorded using a scanning spectrophotometer with a microplate reader.
2.6. Transwell assay
Corning BioCoat Matrigel Invasion Chambers (Corning Costar Corp) were used to perform the cell invasion assay in triplicate. We added 1 × 10⁵ cells to per insert in the upper chamber, and 200 ml of supplemented medium was added to the bottom chamber. After incubating for 24 h, the cells were fixed with 4% paraformaldehyde on the filter surface, followed by staining using hematoxylin and eosin. Under an optical microscope, five regions were randomly selected in each chamber to count the cells.
2.7. SiRNA and plasmid transfection
Oligonucleotides, including the TCONS_00026334 short interfering RNA (siRNA), miR‐548n mimics, TP53INP1 siRNA, and corresponding negative controls, were all synthesized from the GenePharma (Shanghai, China). The TCONS_00026334 cDNA was cloned into the pcDNA3.1 expression vector. GenePharma constructed the TCONS_00026334 cDNA, TP53INP1 cDNA, and the respective negative controls. 0.5 × 10⁵ cells/ml of SW1116 and HCT116 cells were seeded into six‐well plates and subsequently incubated for 24 h before being transfected with the above‐mentioned oligonucleotides and plasmids with Lipofectamine 2000 (Invitrogen).
2.8. Luciferase assays
The online software program miRDB (http://www.mirdb.org) was applied to predict the relationship between TCONS_00026334 and miR‐548n, and between TP53INP1 and miR‐548n. Predicted wild type (WT) and mutant (MUT) binding sites for miR‐548n in the 3′‐untranslated region (UTR) of TCONS_00026334 and TP53INP1 mRNA, which were named as pmirGLO‐TCONS_00026334‐WT or pmirGLO‐TCONS_00026334‐MUT, pmirGLO‐TP53INP1‐WT or pmirGLO‐ TP53INP1‐MUT, were cloned into the luciferase reporter vector pmirGLO (Gene array Biotechnology). SW1116 and HCT116 cells that had reached 70% confluence and had been subjected to 1 hour or serum starvation, then 5 × 10⁴ cells were plated into each well of 12‐well plates. Subsequently, 0.5 μg of WT or MUT TCONS_00026334 plasmids and 25 pmol of miR‐548n mimic or control were used to co‐transfect the cells. The cells were harvested after being transfected for 48 h, and then analyzed using a Dual Luciferase Assay system (Promega). Triplicate experiments were performed.
2.9. Tumor xenograft model experiment
The local ethics committee of Renji Hospital approved the mouse experiments. This study used BALB/c nude mice under female‐specific pathogen free (SPF) conditions with the approval of Animal Care and Use Committee of Renji Hospital. Briefly, 5 × 10⁶ cells were subcutaneously injected into the armpits of nude mice every three days. Tumor growth was monitored and subcutaneous tumors were measured since initial injection, and then were euthanized at 25 days. Next, the tumors were removed, weighed, photographed, and fixed in the 4% paraformaldehyde for 24 h. Eventually, xenograft specimens were stored at −80°C for subsequent experiments after being frozen in liquid nitrogen.
2.10. Statistical analysis
All experiments were repeated at least three times and reported as mean ± SD. Student's t‐test and chi‐squared test were requested to analyze the statistical differences. The Kaplan–Meier estimator was applied to measure the survival profiles, which were analyzed with the log rank test. These statistical analyses were conducted by SPSS Statistics 22.0 software (IBM Corp.). Statistical significance was accepted at p < 0.05.
3. RESULTS
3.1. Poor prognosis of CRC was associated with TCONS_00026334 expression
The transcript abundance of TCONS_00026334 was measured in 86 pairs of CRC tissues and matched normal adjacent tissues to determine the expression level of TCONS_00026334 in CRC. The results showed that the expression level of TCONS_00026334 was downregulated in tumor tissues of patients with CRC in comparison to that in noncancerous tissues (Figure 1A). Then, the possible correlation between TCONS_00026334 and clinical characteristics of patients with CRC was investigated. The data shown in Figure 1(B–D) indicated that a low TCONS_00026334 level was correlated with maximum tumor diameter (p < 0.01), distant metastasis (p < 0.001), and the serum CEA level (p < 0.01).
Figure 1.
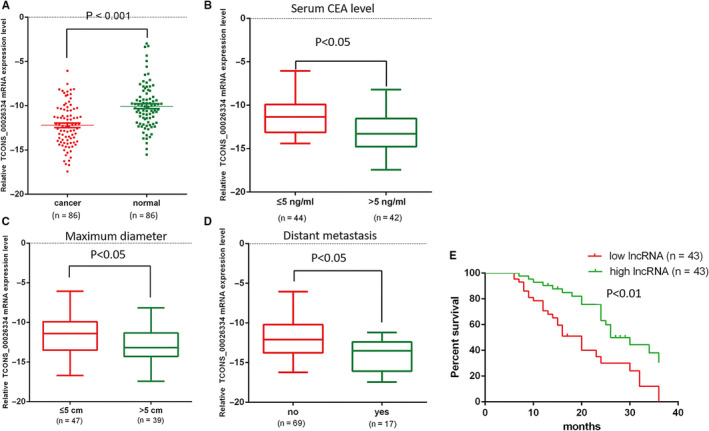
Relative expression level of TCONS_00026334 in the CRC tissues and its relationship with clinical features of patients with CRC. (A) QRT‐PCR data demonstrating the significant downregulation of TCONS_00026334 in CRC tissues by comparison to that in adjacent non‐cancerous tissues. (B–D) The correlation between TCONS_00026334 expression and serum CEA level, maximum tumor diameter, and distant metastasis in patients with CRC. (E) Overall survival comparisons between patients with low and high TCONS_00026334 expression.
Then, based on the median expression value of TCONS_00026334, patients with CRC were subdivided into relative low expression group and relative high expression group. Kaplan–Meier analyses indicated that patients in the relative high TCONS_00026334 expression group had significantly longer overall survival (OS) by comparison with that in the relative low expression group (p = 0.001, Figure 1E). Positive associations between the presence of distant metastasis (M), clinical stage, CEA level, and tumor size and the levels of TCONS_00026334 were observed (Table S2). However, there was no association between the TCONS_00026334 level other factors, including age, gender, and tumor location. Next, multivariate analysis was performed to assess the relationship between prognosis and TCONS_00026334 expression. The results showed that in patients with CRC, TCONS_00026334 expression and the presence of distant metastasis in CRC tissues were independent predictors of OS (Table S3).
3.2. TCONS_00026334 inhibits CRC cells proliferation and invasion in vitro
We next tested the biological functions of TCONS_00026334 in the development of CRC by synthesizing and transfecting plasmids (pcDNA3.1‐TCONS_00026334) or siRNAs targeting TCONS_00026334 to upregulate or downregulate TCONS_00026334 expression. The qRT‐PCR results showed different expression levels of TCONS_00026334 in SW1116, Lovo, Caco‐2, HT29, and HCT116 cells in comparison to that in FHC cells (Figure 2A). TCONS_00026334 in SW1116 and HT29 cells was predominately distributed in the cytoplasm and little in the nucleus (Figure 2B). Subsequently, SW1116 and HCT116 cells were selected to be transduced with plasmids (pcDNA3.1‐TCONS_00026334) to upregulate TCONS_00026334 expression levels (Figure 2C). Contrastingly, SW1116 and HT29 cells were transfected with the siRNA to downregulate TCONS_00026334 expression. The efficiency of the plasmids and siRNA were confirmed using quantitative real‐time PCR (qPCR; Figure 2D).
Figure 2.

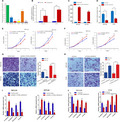
TCONS_00026334 induces EMT reversal and inhibits aggressive phenotypes in CRC cells. (A) QRT‐PCR results of the expression of TCONS_00026334 in different CRC cell lines. (B) QRT‐PCR identified TCONS_00026334 was mainly distributed in the cytoplasm and little in the nucleus in SW1116 and HT29 cells. (C, D) The efficiency of TCONS_00026334 siRNA or overexpression was confirmed by qRT‐PCR in CRC cell lines. (E, F) A CCK‐8 assay was used to assess the proliferative ability of CRC cells after transfection with pcDNA3.1‐TCONS_00026334 or control vector (E) or TCONS_00026334 siRNA or control siRNA (F) for TCONS_00026334. (G, H) The migration and invasion abilities of CRC cells were assessed after overexpression (G) or silencing (H) of TCONS_00026334 using Transwell assays. (I, J) QRT‐PCR indicating upregulation and downregulation of mRNA expression of epithelial marker E‐cadherin and mesenchymal markers Vimentin/N‐cadherin/Fibronectin, after overexpression and silencing of TCONS_00026334 in different CRC cells. The data are presented as mean ± SD (*p < 0.05, **p < 0.01, ***p < 0.001; n = 3 independent experiments).
To observe the proliferation abilities in vitro of CRC cells after overexpressing and knocked down of TCONS_00026334, the CCK8 assay was used. The results indicated that that transfection with pcDNA3.1‐TCONS_00026334 greatly inhibited the proliferative ability of SW1116 and HCT116 cells (Figure 2E). Conversely, knockdown of TCONS_00026334 increased cell viability relative to that of the control group (Figure 2F).
Next, the effect of TCONS_00026334 on the invasion capabilities of CRC cells was detected by Transwell assays. The invasion capabilities of SW1116 and HCT116 cells were inhibited following TCONS_00026334 upregulation (Figure 2G), but strongly enhanced by depleting TCONS_00026334 in HT29 and SW1116 cells (Figure 2H).
The initiation of epithelial‐mesenchyme transition (EMT) drives tumor invasion and metastasis. Consequently, we detected the levels of EMT markers: E‐cadherin, Fibronectin, N‐cadherin, and Vimentin. Interestingly, TCONS_00026334 overexpression resulted in upregulation of E‐cadherin mRNAs expression while downregulation of mesenchymal markers mRNAs expression. TCONS_00026334 silencing showed the opposite results (Figure 2I, J). Therefore, we concluded that TCONS_00026334 might function as a tumor‐suppressive modulator to inhibit EMT progression in CRC.
3.3. LncRNA TCONS_00026334 could regulate the development of CRC by directly binding to miR‐548n
Recent evidence shows that certain lncRNAs sponge the biological functions of miRNAs by acting as competing endogenous RNAs (ceRNAs). 14 , 15 Analysis using online software suggested the existence of miR‐548n binding sites in TCONS_00026334 (Figure 3A). Next, the expression pattern of miR‐548n was evaluated in patients with CRC. Compared with adjacent normal tissues, CRC tissues showed significantly higher expression levels of miR‐548n (Figure 3B). Furthermore, we found that the expression levels of TCONS_00026334 and miR‐548n correlated negatively (Figure 3C, r = −0.362, p = 0.049). Moreover, TCONS_00026334 overexpression decreased the level of miR‐548n in CRC cells (all p < 0.01; Figure 3D). To verify whether TCONS_00026334 is correlated with the upregulation of miR‐548n in CRC, we further confirmed the direct interactions between TCONS_00026334 and miR‐548n using luciferase reporter assays. Figure 3E shows that the overexpression of miR‐548n reduced the luciferase activities of the TCONS_00026334‐WT reporter but not the TCONS_00026334‐MUT reporter.
Figure 3.

TCONS_00026334 regulates miR‐548n expression negatively in CRC. (A) Bioinformatics software showed the predicted sequence of the TCONS_00026334 binding site on the 3ʹ‐UTR of miR‐548n mRNA. (B) MiR‐548n expression was analyzed using qRT‐PCR in 30 paired CRC tissues and adjacent normal tissues. (C) Correlations between the expression levels of miR‐548n and TCONS_00026334 in 30 paired CRC tissues. (D) The expression level of miR‐548n was detected in the presence of pcDNA3.1‐TCONS_00026334 using qRT‐PCR. (E) Luciferase reporter assay was performed after co‐transfection with miR‐548n and luciferase reporters containing TCONS_00026334 or mutant transcripts in SW1116 and HCT116 cells. (F, G) The cell viabilities of SW1116 and HCT116 were detected after transfection with pcDNA3.1‐TCONS_00026334, or pcDNA3.1‐TCONS_00026334 and miR‐548n mimics, or pcDNA3.1‐control vector and control mimics using a CCK‐8 assay. (H, I) In the presence of pcDNA3.1‐TCONS_00026334, the efficiency of miR‐548n mimics on the invasive ability of CRC cells was detected using Transwell method. The data are shown as the mean ± SD (*p < 0.05, **p < 0.01, ***p < 0.001; n = 3 independent experiments).
To further insight into the roles of TCONS_00026334 and miR‐548n in regulating the carcinogenesis and invasion of CRC, we used miR‐548 mimics to counteract the inhibitory effects induced by pcDNA3.1‐TCONS_00026334 on the cell phenotypes in CRC. SW1116 and HCT116 cell lines were co‐transfected with a plasmid carrying the TCONS_00026334 cDNA and miR‐548 mimics or pcDNA3.1 empty vector, and their functions were analyzed. In comparison with that in the control group, the overexpression of miR‐548 partially reversed the suppression effects on cell proliferation and invasion induced by TCONS_00026334 overexpression in CRC cells (Figure 3F–I). These findings implied that TCONS_00026334 has a negative regulatory function via direct binding miR‐548n as a ceRNA in CRC.
3.4. TP53INP1 is the target of the TCONS_00026334/miR‐548n axis in CRC cells
Increasing evidence showed that the human TP53INP1 plays the role of anti‐oncogene in CRC, and could be regulated by miRNAs as a critical target, including miR‐125b, miR‐524‐5p, and miR‐200a. 21 , 22 , 23 , 24 In the present study, we used the bioinformatics software to detect the potential downstream targets of mi548n. Finally, TP53INP1 was screened out as a novel candidate, which has miR‐548n binding sites within the 3'‐UTR of its mRNA (Figure 4A). To further confirm the possibility that miR‐548n can directly bind to the predicted sites of TP53INP1, the TP53INP1 3'‐UTR fragment having the wild‐type or mutant binding sites was inserted into the downstream of luciferase reporter gene (Figure 4A). We found that the luciferase activity of pmirGLO‐TP53INP1‐3' UTR was reduced dramatically after treatment with miR‐548n mimics, but did not change in CRC cells transfected with pmirGLO‐TP53INP1‐MUT‐3'UTR (Figure 4B), this results indicated that miR‐548n could bind to the TP53INP1 3'‐UTR directly.
Figure 4.
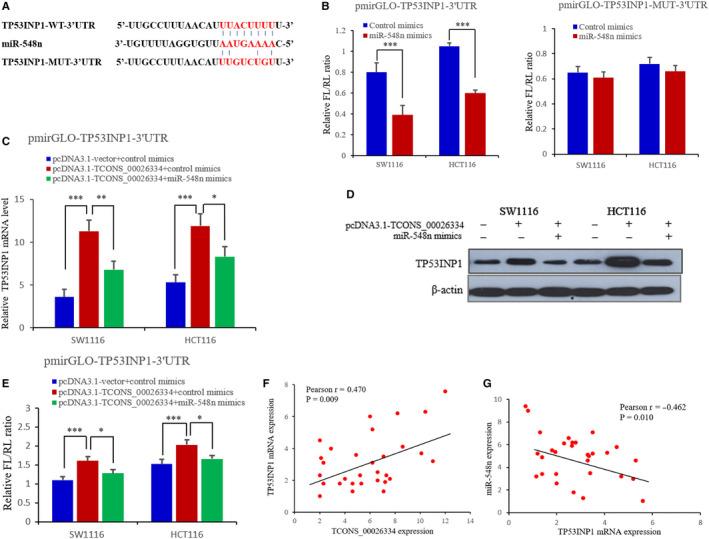
TCONS_00026334 affects the expression of miR‐548n target TP53INP1 in CRC cells. (A) Bioinformatics prediction of miR‐548n binding sites in the TP53INP1 3′‐UTR region. (B) Luciferase reporter assay was performed after co‐transfection of pmirGLO‐TP53INP1‐3' UTR or pmirGLO‐TP53INP1‐MUT‐3'UTR, in the attendance of miR‐548n mimics or negative controls. (C, D) The mRNA and protein level of TP53INP1 were assayed after transfection with pcDNA3.1‐TCONS_00026334 or/and miR‐548n mimics in CRC cells. (E) The overexpression of TCONS_00026334 enhanced the luciferase intensity of pmirGLO‐TP53INP1‐3'‐UTR whereas miR‐548n mimics reduced this increased luciferase intensity. (F, G) Positive correlation between TP53INP1 and TCONS_00026334 (F) and negative correlation between TP53INP1 and miR‐548n in 30 paired CRC specimens. (G). The data are shown as the mean ± SD (*p < 0.05, **p < 0.01, ***p < 0.001; n = 3 independent experiments).
In order to determine whether TCONS_00026334 suppresses CRC progression by modulating the expression of miR‐383 targets, Western blot and RT‐qPCR analysis were performed in CRC cells. We found that TCONS_00026334 overexpression increased the TP53INP1 level in SW1116 and HCT116 cells, whereas treatment with miR‐548n mimics abolished the increased TP53INP1 expression mediated by pcDNA3.1‐TCONS_00026334 (Figure 4C, D). Furthermore, luciferase reporter system was applied to detect TP53INP1 3'‐UTR intensity in CRC cells SW1116 and HCT116. The results indicated that the overexpression of TCONS_00026334 enhanced the luciferase activity of pmirGLO‐ TP53INP1‐3'‐UTR, whereas miR‐548n mimics reduced this increased luciferase intensity (Figure 4E). At last, we found that there was a positive correlation between TP53INP1 and TCONS_00026334 (r = 0.470, p = 0.009), and a negative correlation between TP53INP1 and miR‐548n (r = −0.462, p = 0.010) in 30 paired CRC specimens (Figure 4F, G).
3.5. TCONS_00026334 inhibited CRC cell proliferation in vivo
To explore the in vivo tumorigenic effects of TCONS_00026334 and miR‐548n, SW1116‐control vector cells or SW1116‐pcDNA3.1‐TCONS_00026334 cells were implanted into nude mice subcutaneously. Twenty‐five days later, the tumors were removed (Figure 5A). The tumor volume and weight, and tumoral miR‐548n expression were decreased significantly by TCONS_00026334 overexpression (Figure 5B–D), whereas the TP53INP1 and P21 expression increased obviously (Figure 5E, F). Collectively, these findings suggested that TCONS_00026334 overexpression had the ability to restrain tumor growth in vivo via downregulating miR‐548n to increasing the expression of TP53INP1.
Figure 5.

TCONS_00026334 overexpression suppresses tumor formation via downregulation of miR548n. (A–C) Tumor volume and weight of nude mice after injection of transfected SW1116 cells. **p < 0.01 versus the control group. ***p < 0.001 versus the control group. The data is presented as the mean ± SD. Repeated measurement ANOVA was used to compare the values at different time points; N = 5. The independent experiments were repeated three times. (D) The mRNA expression of miR‐548n after transfection with pcDNA3.1‐TCONS_00026334. (E, F) The mRNA expression (E) and protein expression levels (F) of TP53INP1 and P21 after transfection with pcDNA3.1‐TCONS_00026334.
4. DISCUSSION
Mounting evidence indicates that CRC tumorigenesis, metastasis, and prognosis are associated with aberrant lncRNA expression. LncRNAs could act as tumor suppressors or oncogenes, for example GAPLINC, NEAT1, HOTAIR, and LINC00265. 11 , 12 , 25 , 26 In this study, we identified that the lncRNA TCONS_00026334 was frequently downregulated in CRC tissues. Decreased TCONS_00026334 levels were related to CRC progression and poorer prognosis of patients with CRC. TCONS_00026334 overexpression inhibited the cell proliferation and invasion abilities of CRC significantly. Moreover, overexpression of TCONS_00026334 could simultaneously upregulate the mRNA expression of E‐cadherin and downregulate the mRNA expression of mesenchymal markers, which could promote the invasion and migration of tumor cells, leading to cancer metastasis. 27 , 28 To sum up, these results identified that TCONS_00026334 suppresses tumor progression and metastasis, and may represent a potential biomarker for CRC therapy.
As a novel lncRNA, the potential mechanism of action of TCONS_00026334 remains largely unknown, unlike some other well‐studied lncRNAs. 25 , 29 Along with the role of transcriptional regulation, many lncRNAs modulate gene expression by serving as endogenous target mimics for miRNAs. 17 , 22 , 30 Such as, NEAT1 could regulate the expression of miR‐133b by acting as a ceRNA to influence cell viability and invasion in breast cancer cells. 31 In the tumorigenesis of hepatocellular carcinoma (HCC), lncRNA PTTG3P sponges miR‐383, thereby upregulating the expression of miR‐383's target, Cyclin D1 (CCND1). 32 Therefore, we investigated the molecular mechanism by which TCONS_00026334 interacts with miRNAs in CRC. Bioinformatics analysis indicated potential interactions between TCONS_00026334 and miR‐548n. MiR‐548n was upregulated in the tumor tissues of CRC and luciferase assays validated that miR‐548n directly binds to TCONS_00026334. This interaction affects cell proliferation and invasion of CRC. Overall, this study demonstrated that TCONS_00026334 exerts its function as a ceRNA depending on the competitive binding of miR‐548n.
Recent studies showed that certain lncRNAs exert their functions partly by acting as ceRNAs and modulating the expression of miRNA targets 18 , 33 , 34 . Accordingly, bioinformatics analyses were used to find the candidate targets of miR‐548n. Finally, TP53INP1 was screened out as the direct target of miR‐548n. TP53INP1 is located on chromosome 8q22 and is downregulated in multiple cancers, such as breast cancer, prostate cancer, gastric cancer, advanced HCC, and CRC. 35 , 36 Some recent studies also indicated that TP53INP1, as a tumor suppressor gene, could be regulated by miRNAs as a critical target, including miR‐125b, miR‐524‐5p, and miR‐200a. 22 , 23 , 24 Our luciferase results showed that miR‐548n binds to the 3ʹ UTR of TP53INP1 directly and TCONS_00026334 could upregulate the mRNA and protein expression of TP53INP1, while miR‐548n mimics could abrogate the increased TP53INP1 expression mediated by pcDNA3.1‐TCONS_00026334. In addition, luciferase reporter assay indicated that the overexpression of TCONS_00026334 improved the luciferase intensity of pmirGLO‐TP53INP1‐3'‐UTR, whereas miR‐548n mimics reduced this increased luciferase intensity. These above results inferred that TCONS_00026334 regulates the miR‐548n/TP53INP1 feedback loop and inhibits the development of CRC by functioning as a ceRNA to sponge miR‐548n.
In summary, the results of this study identified the TCONS_00026334 acts as an anti‐tumor and anti‐metastatic gene to inhibit CRC development by competitively binding miR‐548n, upregulating TP53INP1 expression. Therefore, the TCONS_00026334–miR‐548n–TP53INP1 network might represent a useful biomarker and promising target against CRC therapy.
CONFLICT OF INTEREST
All authors have no conflicts of interest to declare.
AUTHOR CONTRIBUTIONS
MMZ, ATX, YL, MZ, and ZHR conceived and designed the experiments; MMZ and YL performed the experiments; ATX, XTX, and YL analyzed the data; MMZ wrote the paper. All authors read and approved the final manuscript.
Supporting information
Table S1‐S3
Supplementary Material
ACKNOWLEDGEMENTS
Not applicable.
Zhu Mingming, Luo Yang, Xu Antao, Xu Xitao, Zhong Ming, Ran Zhihua, et al. Long noncoding RNA TCONS_00026334 is involved in suppressing the progression of colorectal cancer by regulating miR‑548n/TP53INP1 signaling pathway. Cancer Med. 2020;9:8639–8649. 10.1002/cam4.3473
Funding information
This work was supported by a grant from the National Natural Science Foundation of China (No. 81302095).
Mingming Zhu and Yang Luo contributed equally to this work.
Contributor Information
Ming Zhong, Email: drzhongming1966@163.com.
Zhihua Ran, Email: zhihuaran@vip.163.com.
DATA AVAILABILITY STATEMENT
The microarray dataset is being used in our laboratory for further studies, therefore it is not publicly available.
References
- 1. Bray F, Ferlay J, Soerjomataram I, Siegel RL, Torre LA, Jemal A. Global cancer statistics 2018: GLOBOCAN estimates of incidence and mortality worldwide for 36 cancers in 185 countries. CA Cancer J Clin. 2018;68:394–424. [DOI] [PubMed] [Google Scholar]
- 2. Arnold M, Sierra MS, Laversanne M, Soerjomataram I, Jemal A, Bray F. Global patterns and trends in colorectal cancer incidence and mortality. Gut. 2017;66:683–691. [DOI] [PubMed] [Google Scholar]
- 3. Eefsen RL, Vermeulen PB, Christensen IJ, et al. Growth pattern of colorectal liver metastasis as a marker of recurrence risk. Clin Exp Metastasis. 2015;32:369–381. [DOI] [PubMed] [Google Scholar]
- 4. Rychahou P, Bae Y, Reichel D, et al. Colorectal cancer lung metastasis treatment with polymer‐drug nanoparticles. J Control Release. 2018;275:85–91. [DOI] [PMC free article] [PubMed] [Google Scholar]
- 5. Zhang L, Yu X, Zheng L, et al. Lineage tracking reveals dynamic relationships of T cells in colorectal cancer. Nature. 2018;564:268–272. [DOI] [PubMed] [Google Scholar]
- 6. Nikolouzakis TK, Vassilopoulou L, Fragkiadaki P, et al. Improving diagnosis, prognosis and prediction by using biomarkers in CRC patients (review). Oncol Rep. 2018;39:2455–2472. [DOI] [PMC free article] [PubMed] [Google Scholar]
- 7. Yang C, Wang L, Sun J, et al. Identification of long non‐coding RNA HERC2P2 as a tumor suppressor in glioma. Carcinogenesis. 2019;40:956–964. [DOI] [PubMed] [Google Scholar]
- 8. Ma Y, Zhang J, Wen L, Lin A. Membrane‐lipid associated lncRNA: a new regulator in cancer signaling. Cancer Lett. 2018;419:27–29. [DOI] [PubMed] [Google Scholar]
- 9. Peng WX, Koirala P, Mo YY. LncRNA‐mediated regulation of cell signaling in cancer. Oncogene. 2017;36:5661–5667. [DOI] [PMC free article] [PubMed] [Google Scholar]
- 10. Xiong Y, Wang J, Zhu H, Liu L, Jiang Y. Chronic oxymatrine treatment induces resistance and epithelial‐mesenchymal transition through targeting the long non‐coding RNA MALAT1 in colorectal cancer cells. Oncol Rep. 2018;39:967–976. [DOI] [PMC free article] [PubMed] [Google Scholar] [Retracted]
- 11. Luo Y, Ouyang J, Zhou D, et al. Long noncoding RNA GAPLINC promotes cells migration and invasion in colorectal cancer cell by regulating miR‐34a/c‐MET signal pathway. Dig Dis Sci. 2018;63:890–899. [DOI] [PubMed] [Google Scholar]
- 12. Luo Y, Chen JJ, Lv Q, et al. Long non‐coding RNA NEAT1 promotes colorectal cancer progression by competitively binding miR‐34a with SIRT1 and enhancing the Wnt/beta-catenin signaling pathway. Cancer Lett. 2019;440–441:11–22. [DOI] [PubMed] [Google Scholar]
- 13. Fosselteder J, Calin GA, Pichler M. Long non‐coding RNA CCAT2 as a therapeutic target in colorectal cancer. Expert Opin Ther Targets. 2018;22:973–976. [DOI] [PubMed] [Google Scholar]
- 14. Han Q, Xu L, Lin W, et al. Long noncoding RNA CRCMSL suppresses tumor invasive and metastasis in colorectal carcinoma through nucleocytoplasmic shuttling of HMGB2. Oncogene. 2019;38:3019–3032. [DOI] [PubMed] [Google Scholar]
- 15. Cabili MN, Trapnell C, Goff L, et al. Integrative annotation of human large intergenic noncoding RNAs reveals global properties and specific subclasses. Genes Dev. 2011;25:1915–1927. [DOI] [PMC free article] [PubMed] [Google Scholar]
- 16. Tong JL, Zhang CP, Nie F, et al. MicroRNA 506 regulates expression of PPAR alpha in hydroxycamptothecin‐resistant human colon cancer cells. FEBS Lett. 2011;585:3560–3568. [DOI] [PubMed] [Google Scholar]
- 17. Rokavec M, Horst D, Hermeking H. Cellular model of colon cancer progression reveals signatures of mRNAs, miRNA, lncRNAs, and epigenetic modifications associated with metastasis. Cancer Res. 2017;77:1854–1867. [DOI] [PubMed] [Google Scholar]
- 18. Peng Q, Yao W, Yu C, et al. Identification of microRNA‐181 as a promising biomarker for predicting the poor survival in colorectal cancer. Cancer Med. 2019;8(13):5995–6009. [DOI] [PMC free article] [PubMed] [Google Scholar]
- 19. Shibuya H, Iinuma H, Shimada R, Horiuchi A, Watanabe T. Clinicopathological and prognostic value of microRNA‐21 and microRNA‐155 in colorectal cancer. Oncology. 2010;79:313–320. [DOI] [PubMed] [Google Scholar]
- 20. Livak KJ, Schmittgen TD. Analysis of relative gene expression data using real‐time quantitative PCR and the 2(‐Delta Delta C(T)) Method. Methods. 2001;25:402–408. [DOI] [PubMed] [Google Scholar]
- 21. Gommeaux J, Cano C, Garcia S, et al. Colitis and colitis‐associated cancer are exacerbated in mice deficient for tumor protein 53‐induced nuclear protein 1. Mol Cell Biol. 2007;27:2215–2228. [DOI] [PMC free article] [PubMed] [Google Scholar]
- 22. Jiang F, Liu T, He Y, et al. MiR‐125b promotes proliferation and migration of type II endometrial carcinoma cells through targeting TP53INP1 tumor suppressor in vitro and in vivo. BMC Cancer. 2011;11:425. [DOI] [PMC free article] [PubMed] [Google Scholar]
- 23. Yu SJ, Yang L, Hong Q, Kuang XY, Di GH, Shao ZM. MicroRNA‐200a confers chemoresistance by antagonizing TP53INP1 and YAP1 in human breast cancer. BMC Cancer. 2018;18:74. [DOI] [PMC free article] [PubMed] [Google Scholar]
- 24. Nguyen PNN, Choo KB, Huang CJ, Sugii S, Cheong SK, Kamarul T. miR‐524-5p of the primate‐specific C19MC miRNA cluster targets TP53IPN1‐ and EMT‐associated genes to regulate cellular reprogramming. Stem Cell Res Ther. 2017;8:214. [DOI] [PMC free article] [PubMed] [Google Scholar]
- 25. Gupta RA, Shah N, Wang KC, et al. Long non‐coding RNA HOTAIR reprograms chromatin state to promote cancer metastasis. Nature. 2010;464:1071–1076. [DOI] [PMC free article] [PubMed] [Google Scholar]
- 26. Zhu Y, Gu L, Lin X, et al. LINC00265 promotes colorectal tumorigenesis via ZMIZ2 and USP7‐mediated stabilization of beta‐catenin. Cell Death Differ. 2019. 10.1038/s41418-019-0417-3 [DOI] [PMC free article] [PubMed] [Google Scholar]
- 27. Schmalhofer O, Brabletz S, Brabletz T. E‐cadherin, beta‐catenin, and ZEB1 in malignant progression of cancer. Cancer Metastasis Rev. 2009;28:151–166. [DOI] [PubMed] [Google Scholar]
- 28. Rhim AD, Mirek ET, Aiello NM, et al. EMT and dissemination precede pancreatic tumor formation. Cell. 2012;148:349–361. [DOI] [PMC free article] [PubMed] [Google Scholar]
- 29. Geng H, Bu HF, Liu F, et al. In inflamed intestinal tissues and epithelial cells, interleukin 22 signaling increases expression of H19 long noncoding RNA, which promotes mucosal regeneration. Gastroenterology. 2018;155:144–155. [DOI] [PMC free article] [PubMed] [Google Scholar]
- 30. Zhang J, Yuan Y, Wei Z, et al. Crosstalk between prognostic long noncoding RNAs and messenger RNAs as transcriptional hall marks in gastric cancer. Epigenomics. 2018;10:433–443. [DOI] [PubMed] [Google Scholar]
- 31. Li X, Deng S, Pang X, et al. LncRNA NEAT1 silenced miR‐133b promotes migration and invasion of breast cancer cells. Int J Mol Sci. 2019;20:pii: E3616. [DOI] [PMC free article] [PubMed] [Google Scholar]
- 32. Zhou Q, Zhang W, Wang Z, Liu S. Long non‐coding RNA PTTG3P functions as an oncogene by sponging miR‐383 and up‐regulating CCND1 and PARP2 in hepatocellular carcinoma. BMC Cancer. 2019;19:731. [DOI] [PMC free article] [PubMed] [Google Scholar]
- 33. Bao Y, Tang J, Qian Y, et al. Long noncoding RNA BFAL1 mediates enterotoxigenic Bacteroides fragilis‐related carcinogenesis in colorectal cancer via the RHEB/mTOR pathway. Cell Death Dis. 2019;10:675. [DOI] [PMC free article] [PubMed] [Google Scholar]
- 34. Xu S, Sui J, Yang S, Liu Y, Wang Y, Liang G. Integrative analysis of competing endogenous RNA network focusing on long noncoding RNA associated with progression of cutaneous melanoma. Cancer Med. 2018;7(4):1019–1029. [DOI] [PMC free article] [PubMed] [Google Scholar]
- 35. Tomasini R, Seux M, Nowak J, et al. TP53INP1 is a novel p73 target gene that induces cell cycle arrest and cell death by modulating p73 transcriptional activity. Oncogene. 2005;24:8093–8104. [DOI] [PubMed] [Google Scholar]
- 36. Briest F, Grabowski P. The p53 network as therapeutic target in gastroenteropancreatic neuroendocrine neoplasms. Cancer Treat Rev. 2015;41:423–430. [DOI] [PubMed] [Google Scholar]
Associated Data
This section collects any data citations, data availability statements, or supplementary materials included in this article.
Supplementary Materials
Table S1‐S3
Supplementary Material
Data Availability Statement
The microarray dataset is being used in our laboratory for further studies, therefore it is not publicly available.