FIGURE 3.

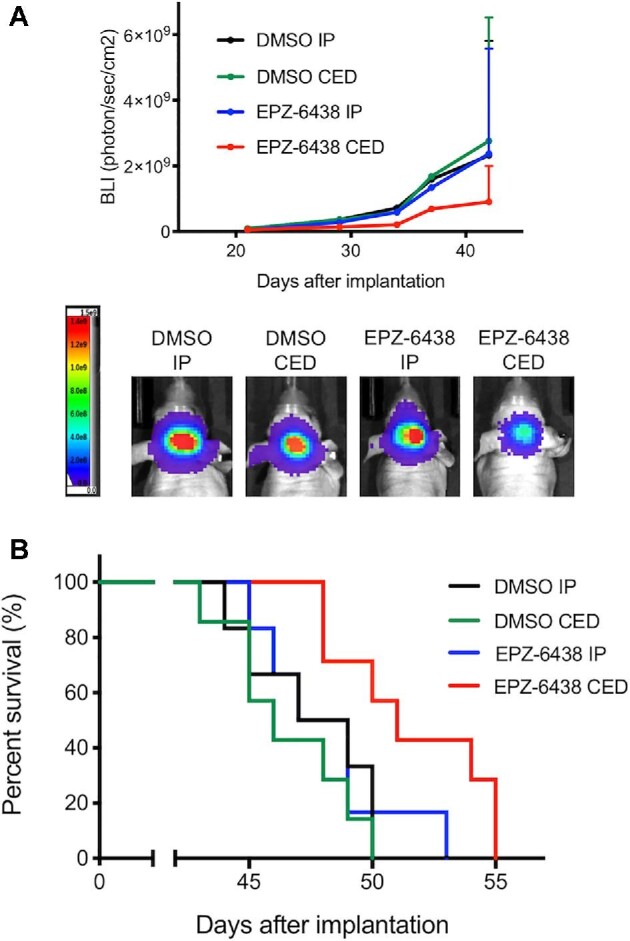
In Vivo anti-tumor activity of EPZ-6438 by CED administration compared to systemic administration in patient-derived DIPG xenografted models. A, Mice with SF8628 intracranial tumor were randomized to 4 treatment groups: 1. DMSO intraperitoneal (IP) injection (N = 6), 2. DMSO CED (N = 7), 3. EPZ-6438 IP (N = 6), 4. EPZ-6438 CED (N = 7). Tumor growth curve for bioluminescence values in each treatment group (upper). Tumor bioluminescence values show mean and upper standard deviation (SD). Representative bioluminescence imaging (BLI) signals in each treatment group (bottom). B, Corresponding survival analysis for each experiment. Median survival: DMSO IP, 48 d; DMSO CED, 46 d; EPZ-6438 IP, 48 d; EPZ-6438 CED, 51 d. Statistical analysis was performed using a log-rank test: DMSO CED vs EPZ-6438 CED, ***P = .0006, EPZ-6438 IP vs EPZ-6438 CED, *P = .0475.
