

ABSTRACT
Beverage consumption is an important contributor to total daily calorie intake among children and adolescents. While associations between excess calories from beverages and development of obesity are well established, a standardized approach for beverage categorization does not exist. As a result, there is marked heterogeneity in assessment and categorization of beverage intake across studies. The purpose of this article is to critically review beverage categorization in recent (published since 2010) observational studies that evaluated beverage intake in relation to weight/adiposity in US youth, and to put forth an initial proposal for a standardized beverage classification system. Standardized beverage classification is critical to ensure transparency in nutrition science research and facilitate comparison of findings across studies. A systematic literature search identified 37 eligible studies, across which beverage categorization varied considerably. The most heterogeneity was observed for categorization of “sugar-sweetened beverages” and the greatest consistency was observed for categorization of 100% juices. This review provides an evidence-based starting point for urgently needed, collaborative work to determine priorities for beverage categorization and leverage existing standards of identity in order to create and disseminate a standardized beverage classification system. A standardized approach will inform meaningful assessment of beverage consumption in research studies and facilitate impactful translation of research findings into public health nutrition policy.
Keywords: sugar-sweetened beverages, diet beverages, milk, fruit juice, childhood obesity
Introduction
Beverage consumption is an important contributor to total daily calorie intake among children and adolescents. Calories from milk and fruit juice are the predominant source of beverage calories among young children (2–11 y), whereas sugar-sweetened beverages (SSBs) are the primary source of beverage calories among adolescents and are the leading contributors to added sugar intake in the American diet (1). Positive associations between excess added sugar intake, defined as >10% of total energy intake (2), and child weight gain are consistently reported in epidemiologic studies (3–6).
Despite declines in soda and fruit drink consumption over the past decade (7), consumption of sports drinks has remained steady among children and adolescents. Additionally, consumption of lower-calorie SSBs (most of which are sweetened with low-calorie sweeteners) has increased in youth, as well as consumption of “other SSBs” (e.g., sweetened teas and sweetened coffees) beyond carbonated sodas and fruit drinks (7). A recent survey reported that <10% of parents in the United States consider regular sodas, diet sodas, or energy drinks to be healthy for their children (8). Yet, nearly half (48%) perceived sweetened water beverages (such as Vitamin Water™ Energy Brands, Coca-Cola Company) as healthy, and 30% and 27% of parents rated fruit drinks and sports drinks as nutritious, respectively (8). Similarly, calcium-containing dairy beverages that have calorie and sugar contents comparable to SSBs, such as chocolate milk, are frequently perceived as healthier options and complicate beverage categorization in research studies. As a result, marked inconsistencies in what constitutes “sugar-sweetened beverages,” “fruit juice,” “milk,” or “unsweetened beverages” exist in the scientific literature and limit the interpretation and comparison of study findings (9).
In this article, we evaluate and compare beverage categorization in observational studies investigating beverage intake in relation to weight and/or adiposity among children, and propose an initial beverage categorization framework to facilitate synthesis and interpretation of research findings and to inform evidence-based nutrition policy. This proposed framework is intended to serve as a starting point to move the field towards reaching consistency in beverage categorization and is not intended to be definitive, as validation studies and input from agencies overseeing beverage standards of identity are needed to arrive upon a more precise approach.
Example of Beverage Categorization across Studies
Study design and inclusion criteria
A systematic literature search was undertaken to identify observational studies that examined child beverage intake in relation to weight and/or adiposity. Only original articles reporting findings from observational studies that evaluated beverage intake in relation to weight/adiposity (e.g., BMI, weight status, % body fat, etc.) in US youth ages 2–18 y and that were published in scientific journals between 1 January 2010 and 31 December 2018 were included. This date range was selected because the US beverage landscape has evolved considerably over the past several decades (10). Additional inclusion criteria were as follows: 1) original research article, 2) study participants resided in the continental United States, and 3) the study reported individual-level data on child nonalcoholic beverage intake. Studies that examined only pregnant or lactating mothers, infants (<2 y), or adults (≥18 y) were excluded.
Search strategy
The search strategy was developed in consultation with a librarian from Himmelfarb Health Sciences Library at the George Washington University. Databases searched included PubMed (https://www.ncbi.nlm.nih.gov/pubmed), CINAHL (http://web.a.ebscohost.com.proxygw.wrlc.org), and Scopus (https://www-scopus-com.proxygw.wrlc.org/search/form.uri?display=basic). Search terms included relevant nomenclature for nonalcoholic beverages (carbonated water, mineral water, sparkling water, seltzer water, drinking water, carbonated beverage, carbonated drink, soft drink, soda, sugar-sweetened beverage, SSB, sweetened beverage, sugary drink, sugar-containing beverage, cola, caloric beverage, non-nutritive sweetener, artificially-sweetened beverage, non-caloric beverage, non-caloric sweetened beverage, diet drink, low-calorie beverage, no-calorie beverage, non-carbonated beverage, sports drink, energy drink, fruit juice, vegetable juice, fortified beverage, fortified drink, coffee, espresso, kombucha, milk, kefir, buttermilk, dairy beverage, fermented beverage, and toddler beverage) and weight-related outcomes (weight gain, body mass index, BMI, obese, overweight, weight loss, body weight maintenance, body weight, energy balance, body fat distribution, body fat, fatness, adiposity). Search results were imported directly into RefWorks Classic™ (Ex Libris USA).
The search identified 11,938 articles, of which 3,532 were duplicates and subsequently removed (Figure 1). Three team members (PEM, EKD, ACS) independently screened the remaining titles and abstracts for eligibility and inclusion. Any disagreements or uncertainties were resolved by discussion amongst the study team. A total of 8,406 articles underwent title and abstract screening, of which 151 full-text articles were initially determined to meet the eligibility criteria. Of these, 114 studies were subsequently excluded for ≥1 of the following reasons: not an observational study (n = 1), did not study children in the United States (n = 2), did not include 2–18-y-old children (n = 5), did not report individual-level beverage intake (n = 12), and/or did not assess the relation between beverage intake and weight or adiposity (n = 88). An additional 4 studies evaluating milk intake and body weight were also excluded because they assessed differences in fat content (skim vs. low-fat vs. 2% vs. whole) or flavor (flavored milk vs. unflavored milk) of milk varieties and did not assess “milk intake” (as a category) in relation to weight/adiposity. Two studies were excluded during full-text review because they were determined to be duplicates of already included studies. Thirty-seven articles ultimately met all the eligibility criteria and were included in the final review. Two team members (PEM and EKD) independently extracted relevant data from each eligible study. Disagreements were resolved through discussion amongst the team members, with a third team member (ACS) responsible for the final resolution.
FIGURE 1.

Article screening and eligibility assessment. The initial literature search identified 11,938 articles, of which 3532 were duplicates and subsequently removed. A total of 8406 articles underwent title and abstract screening, of which 151 full-text articles were initially determined to meet the eligibility criteria. Of these, 114 studies were subsequently excluded and 37 articles were included in the final review.
SSBs were the most commonly assessed beverage category
As shown in Table 1, 15 studies assessed a single beverage category (e.g., associations between SSB intake and weight gain) and 23 assessed multiple beverage categories [e.g., associations between sweetened beverages (SSBs and artificially sweetened beverages) and weight gain]. The most common beverages assessed (as described by the authors of each respective study) were SSBs (23 studies), milk (15 studies), and 100% juice (10 studies). However, across the 37 included studies, 23 different beverage categories were utilized (Table 2) and 17 of the 37 included studies did not explicitly define which beverages were included within the beverage categories evaluated. Of the 37 included studies, 27 (73.0%) assessed beverage intake using food-frequency questionnaires (FFQs), 8 (21.6%) used dietary recalls, and 1 (2.7%) used both dietary recalls and FFQs. Only 2 studies (5.4%) assessed beverage intake using a method other than FFQs or dietary recalls [Piontak et al. (11), which used the Ecological Momentary Assessment (EMA), and Hasnain et al. (12), which assessed beverage intake using 3-day diet records].
TABLE 1.
Characteristics of included studies1
| First author, year (reference) | Population, participants (n), age | Dietary assessment method | Beverage classification used as stated by author2 |
|---|---|---|---|
| O'Neil, 2010 (18) | NHANES 1999–2002 (n = 3,939) 12–18 y | 24-h recall | 100% Juice (100% juice with no additives) |
| Wiley, 2010 (19) | NHANES 1999–2004 (n = 4,019) 2–10 y | Food-frequency questionnaire and 24-h recall | Milk (plain and flavored milk, buttermilk, reconstituted powdered milk) |
| Cunningham, 2011 (20) | Early Childhood Longitudinal Study Kindergarten Class of 1998–99, waves 6 and 7 (n = 6,128), 5th–8th grade | Food consumption questionnaire | Sweetened beverages [soda pop (e.g., Coke™, Pepsi™, or Mountain Dew™),Sports Drinks (e.g., Gatorade™),Fruit Drinks not 100% fruit juice (e.g., Kool-Aid™, Hi-C™, Fruitopia™, Fruit works™)] |
| Carlson, 2012 (21) | Control group of community-based childhood obesity prevention program (n = 271) 6–9 y | Parent questionnaire | SSBs (soda; not diet, Hawaiian Punch™, fruit drinks, lemonade, sugar-sweetened ice tea, Tampico™, other non-carbonated sugary drinks, sports drinks like Gatorade™ and Powerade™);100% fruit or vegetable juice |
| Davis, 2012 (22) | Hispanic toddlers whose families were enrolled in Los Angeles WIC (n = 1,483),2–4 y | Public Health Foundation Enterprises Women, Infants, and Children Survey 2008 (questionnaire) | SSBs (e.g., Coke™ and Mountain Dew™) or other sweetened drinks (e.g., Gatorade™, Red Bull™, or Sunny Delight™); 100% juice NOT counted as SSB; Milk(whole, reduced fat, nonfat, soy, chocolate) |
| Evans, 2012 (23) | Children with and without autism spectrum disorders near UMass (n = 111), 3–11 y | Food-frequency questionnaire | Juice (e.g., orange juice);Sweetened nondairy beverages (iced tea, punch, soda (nondiet) |
| Laska, 2012 (24) | Minnesota adolescents from 7 counties in Minneapolis/St. Paul area (n = 693), 6th–11th grade | Beverage-frequency questionnaire | SSBs (regular soda, sports drinks [Gatorade™], Other sweetened beverages [sweetened teas, juice drinks, lemonade],Coffee drinks [lattes, mochas, Frappuccinos™, and Macchiatos, not including regular coffee]);Diet or sugar-free soda or pop |
| Taber, 2012 (25) | 9th–12th-grade students in 29 states (n = 272,044),9th–12th grade | Youth Risk Behavior Survey 2001–2007 (CDC) (Food Frequency Survey) | Milk;100% fruit juice |
| Tovar, 2012 (26) | Participants in the CHANGE (Creating Healthy, Active, and Nurturing Growing Up Environments) program (n = 401)6–11 y | Food-frequency questionnaire | SSBs (soda, other sugar-sweetened drinks); Dairy (whole milk, 1%, and nonfat milk) |
| DeBoer, 2013 (27) | Early Childhood Longitudinal Study—Birth Cohort (n = 9,600) 2–5 y | Parent interviews (beverage-frequency questionnaire) | SSBs [soda pop (e.g., Coke™, Pepsi™, or Mountain Dew™), sports drinks (e.g., Gatorade™), or fruit drinks not 100% fruit juice (e.g., Kool-Aid™, Sunny Delight™, Hi-C™, Fruitopia™, or Fruit works™)] |
| Flores, 2013 (28) | Early Childhood Longitudinal Birth Cohort (n = 6,800),2–5 y | Beverage-frequency questionnaire | Milk; 100% fruit juice; Sugary beverages;Coffee/tea |
| Govindan, 2013 (29) | Project Healthy Schools Southeastern Michigan (n = 1,714) 10–12 y [6th grade] | School Physical Activity and Nutrition Questionnaire | Milk (any type) |
| Kosova, 2013 (30) | NHANES 1999–2004 (n= 4,800) 3–11 y | 24-h recall | SSBs (energy-containing soft drinks, colas, sugar-sweetened fruit drinks, or other sugar-sweetened beverages); pure fruit juices and diet soft drinks not included |
| Ledoux, 2011 (31) | Children and adolescents in the Houston, TX, area (n = 665)9–10 y and 17–18 y | 24-h recall | Milk (2%, whole, 1%, skim);Sweetened beverages;Unsweetened beverages;Artificially sweetened beverages |
| Mandal, 2014 (32) | Early Childhood Longitudinal Study—Birth Cohort (n = 10,700)4–6 y | Food-frequency questionnaire | Soda[includes pop (e.g., Coke™), sports drinks (e.g., Gatorade™), or fruit drinks not 100% fruit juice (e.g., Kool-Aid™)];100% juice (e.g., Orange Juice, Apple Juice, Grape Juice, but excluding punch, Sunny Delight™, Kool-Aid™, sports drinks, or other fruit-flavored drinks); Milk (all types, including cow's milk and soy milk) |
| Beck, 2014 (33) | Kaiser Permanente Health Plan of Northern California Cohort (n= 319),8–10 y | Youth/Adolescent Food Frequency Questionnaire | Regular soda; Diet soda; Other SSBs (including fruit drinks, sports drinks, flavored ice teas, and other flavored drinks containing sugar);100% fruit juice; Milk(whole, 2%, 1%, skim, flavored);Plain water(tap or bottled) |
| Davis, 2014 (34) | Los Angeles County WIC (n = 2,295), 2–4 y | Los Angeles County Woman, Infant, and Children Survey 2011 (food-frequency questionnaire) | Milk (whole, reduced fat, nonfat, chocolate, soy, rice);Chocolate or sweetened milk; Fruit drinks (e.g., Sunny Delight™, Capri Sun™, or lemonade);Other sweetened drinks (e.g., Gatorade™, Kool Aid™, or Red Bull™);Diet sodas(e.g., Diet Coke™ or Diet Mountain Dew™);Regular soda (e.g., Coke™ or Mountain Dew™);100% juice |
| Field, 2014 (35) | Growing Up Today Study II Cohort (n = 7,559), 6–19 y | Youth/Adolescent Food Frequency Questionnaire | Regular soda;Diet soda; Sports drinks |
| Hasnain, 2014 (12) | Non-Hispanic whites from third- and fourth-generation descendants of the Framingham cohort (n = 103), 3–17 y | Continuing Survey of Food Intakes by Individuals (CSFII) | Milk (plain or flavored);Sweetened beverages;Fruit/vegetable juices;Unsweetened/diet beverages |
| Hauser, 2014 (36) | Students in eastern MA (n = 820)1st–3rd grade | 68-Item questionnaire | Low-fat dairy products;SSBs (not including 100% fruit juice) |
| Limbers, 2014 (37) | Rural Hispanic youth from 2 school districts in south Texas (n = 189), 8–19 y | Food-frequency questionnaire | Dairy (milk);SSBs (regular soda or soft drinks, fruit juice, punch, Kool-Aid™, sports drinks, or other flavored fruit drinks) |
| Santiago, 2015 (38 ) | Bruce Guadalupe Charter School (BGCS) in Milwaukee, WI (n= 187)5th–8th graders | Food-frequency questionnaire (Block for Kids Questionnaire with Hispanic Foods) | SSBs |
| Shefferly, 2016 (39) | Early Childhood Longitudinal Study—Birth Cohort (n = 8,950) 2–5 y | Food-frequency questionnaire (unvalidated) | 100% Fruit juice (e.g., orange juice, apple juice, or grape juice); excluding drinks like Sunny Delight™, Kool-Aid™, sports drinks, or other fruit-flavored drinks |
| Guerrero, 2016 (40) | Sample drawn in 2001 for the Early Childhood Longitudinal Survey Birth Cohort (n = 15,418) 2–5 y | Parent Interviews (Food-frequency questionnaire) | Soda;Juice (100% fruit juice) |
| Nezami, 2016 (41) | The Teen Food and Development Study (n = 536), 12–18 y | Food-frequency questionnaire | Milk (nonfat, low-fat, and whole milk) |
| Santiago-Torres, 2016 (42) | Urban Community School, Wisconsin (n = 187), 10–14 y | Food-frequency questionnaire | SSBs (including soda, fruit drinks, and sports drinks) |
| Shearrer, 2016 (43) | Diabetes Risk due to Ectopic Adiposity in Minority Youth adolescents recruited from hospitals, clinics, churches, schools, and community centers around the Los Angeles area between 2008 through 2011 into the initial study (n = 60), 14–18 y | 24-h recall | SSBs (sweetened soft drinks, sweetened fruit drinks, sweetened tea, sweetened coffee, sweetened coffee substitutes, and sweetened water) |
| DeBoer, 2015 (44) | Early Childhood Longitudinal Survey Birth Cohort (n = 8950) 4–5 y | Parent interviews (beverage-frequency questionnaire) | Milk (whole, 2%, 1%, skim, soy);SSBs |
| Fletcher, 2017 (45) | NHANES 2003–2006 (n = 1797)12–19 y | 24-h recall | SSBs [including soda, fruit-flavored drinks (not 100% fruit juice), sweetened tea, coffee, and milk drinks, sport drinks, and energy drinks] |
| Jackson, 2017 (46) | Early Childhood Longitudinal Study, kindergarten class of 1998–1999 (n = 4938) Kindergarten–8th grade | Food-frequency questionnaire (unvalidated) | SSBs (including soda and fruit drinks) |
| Marshall, 2017 (47) | Iowa Fluoride Study (n = 369) 13–17 y | Beverage-frequency questionnaire | 100% Juice;Milk;Water and other sugar-free beverages (SFBs);SSBs (soda pop, sports drinks, ready-to-drink beverages, reconstituted beverages) |
| Piontak, 2017 (11) | The miLife Study (n = 151), 11–15 y | Self-reported baseline assessment; Ecological Momentary Assessment (EMA) via mobile phones (unvalidated) | Caffeinated drinks (soda and sweet tea) |
| Sylvetsky, 2017 (48) | NHANES 2009-2014 (n = 9261)12–19 y | 24-h recall | Low-calorie sweetened (LCS) beverages (beverages containing terms “diet,” “dietetic,” “low-calorie,” “no-sugar added,” “light,” “sugar-free,” “sugar substitute,” “low-calorie sweetener,” or “no-calorie sweetener”) |
| Williams, 2017 (15) | 2014 Family Life, Activity, Sun, Health, and Eating Study (n = 1737) 12–17 y | Online survey/food-frequency questionnaire | Energy drinks (e.g., Rockstar™, Red Bull™, etc.);Water (not sweetened; e.g., tap water, filtered water, bottled water, or sparkling water);Milk(all types, including soy, rice, almond, etc.);Sweetened fruit drinks (e.g., Capri Sun™, Sunny D™, Arizona Iced Tea™, etc.);Pure fruit juice (e.g., orange, apple, grape, etc.);Soda (e.g., Coke™, Pepsi™, Sprite™, Dr. Pepper™, etc.);Sports Drinks (e.g., Gatorade™ or Powerade™) |
| Davis, 2018 (49) | Study of Latino Adolescents at Risk for Diabetes (n = 98),12–18 y | 24-h recall | Artificially sweetened beverages (those found in sodas, coffees, energy drinks, teas, sports drinks, juices, and flavored waters);SSBs |
| Marshall, 2018 (50) | Iowa Fluoride Study participants, (n = 369), 2–17 y | Beverage-frequency questionnaire | Water/sugar-free beverages;Milk (flavored and unflavored);100% juice(ready-to-drink 100% juice and juice drinks);SSBs (sports drinks, etc.) |
| Welsh, 2018 (13) | NHANES 2009–2014 (n = 8136)2–19 y | 24-h recall | Nondairy beverages with added sugars(e.g., SSBs);Nondairy beverages with naturally occurring sugars (e.g., juices);Dairy beverages with naturally occurring sugars (e.g., milk);Dairy beverages with added sugars (e.g., milkshakes) |
n = 37. CDC, Centers for Disease Control and Prevention; SSB, sugar-sweetened beverage; WIC, Special Supplemental Nutrition Program for Women, Infants, and Children.
Vitamin Water™ (Energy Brands, Coca-Cola Company), Mountain Dew™ (PepsiCo), Gatorade™ (PepsiCo) Kool-Aid™ (Kraft-Heinz), Hi-C™ (Minute Maid, Coca-Cola Company), Fruitopia™ (Coca-Cola Company), Fruitworks™ (PepsiCo), Hawaiian Punch™ (Dr Pepper Snapple Group), Tampico™ (Houchens Industries, Inc), Powerade™ (Coca-Cola Company), Red Bull™ (Red Bull GmbH), Sunny Delight™ (Sunny Delight Beverages Co.), Frappuccino™ (Starbucks), Capri Sun™ (Rudolf Wild Ltd., distributed by Kraft Foods), Rockstar™ (Rockstar, Inc.), Arizona Iced Tea™ (Arizona Beverage Company, Ltd.), Sprite™ (Coca-Cola Company), Dr Pepper™ (Dr Pepper Snapple Group)
TABLE 2.
Frequency of assessed beverage types in included articles
| Beverage assessed as stated by author | Frequency across all included studies |
|---|---|
| 100% Juice | 10 |
| Milk | 15 |
| Sugar-sweetened beverage | 23 |
| Juice | 3 |
| Sweetened nondairy beverage | 1 |
| Diet soda/sugar-free soda | 3 |
| Dairy | 3 |
| Coffee/tea | 1 |
| Unsweetened beverages | 2 |
| Artificially sweetened beverage | 2 |
| Soda | 5 |
| Water | 2 |
| Chocolate/sweetened milk | 1 |
| Fruit drinks | 2 |
| Sports drinks | 2 |
| Sugar-free beverages | 2 |
| Caffeinated drinks | 1 |
| Low-calorie sweetened beverages | 1 |
| Energy drinks | 1 |
| Nondairy beverages w/added sugar | 1 |
| Nondairy beverages w/naturally occurring sugars | 1 |
| Dairy beverages w/naturally occurring sugars | 1 |
| Dairy beverages w/added sugars | 1 |
Marked heterogeneity in classification of SSBs across studies
The greatest heterogeneity in beverage classification was observed for SSBs, with 21 different definitions used across 23 studies. Of the 23 studies that evaluated SSB intake, 17 (73.9%) explicitly defined “sugar sweetened beverages.” However, the most common beverages included in the definition of SSBs provided by the authors were “soda” (14 studies), “sports drinks” (10 studies), and “fruit drinks” (11 studies). Greater heterogeneity in SSB classification may be due to SSBs reflecting a large category of beverages, compared with milk or 100% fruit juice.
Other beverage types included as SSBs varied greatly across studies. Notably, 4 studies included “other sweetened beverages” within their categorization for SSB, and 1 study assessed “diet”/low-calorie beverages as SSBs (hereafter referred to as artificially sweetened beverages). With the exception of Welsh et al. (13), in which dietary recall data were used to quantify added and naturally occurring sugars from all sources, no other studies accounted for consumption of powdered beverages or beverages with sweetener added by the consumer during preparation. Moreover, no study explicitly mentioned powdered SSBs and/or other beverages with sugar added during preparation. While it is possible that these beverages were accounted for in other categories (e.g., powdered Kool-Aid as a fruit drink, etc.), this was not explicitly stated in any of the included studies. Added-sugar content of powdered SSBs may vary considerably based on consumer preparation, which may require assessment of these beverages separately from ready-to-drink varieties.
Other commonly omitted SSB subtypes included energy drinks and sports drinks. Only 2 studies considered sports drink consumption separately from SSB consumption, and similarly, only 1 study considered energy drink consumption separately from SSBs. This is noteworthy because 30% of adolescents (10–19 y old) regularly consume energy drinks (14), and their consumption is independently linked to obesity and other adverse health outcomes ( 14, 15, 16). It was also recently reported that 25% of parents perceive sports drinks as healthy (8); yet, similar to other SSBs, frequent consumption of sports drinks has been shown to promote weight gain (17).
Notably, the majority of studies used FFQs to assess beverage consumption, which have predetermined questions about broad beverage categories. Differences in beverage categorization and wording of specific questions across different FFQs, especially in comparison to studies that assessed intake using open-ended dietary recalls, likely further exacerbated heterogeneity in beverage categorization. This underscores the need to create standardized beverage categories in order to design FFQs that more consistently assess beverage consumption across studies.
Categorization of juices (including 100% juice) was relatively consistent across studies
The greatest consistency was observed for the categorization of 100% juice, likely because there is a legal definition of this term. According to the FDA, “Juices directly expressed from a fruit or vegetable (i.e., not concentrated and reconstituted) shall be considered to be 100% juice and shall be declared as ‘100% juice (51)’.” Thirteen studies assessed associations between juice intake and weight/adiposity, of which 10 specifically assessed 100% juice intake. However, only 4 of the 10 studies assessing 100% juice intake provided explicit definitions for beverages considered 100% juice and only 1 study mentioned 100% vegetable juice in addition to 100% fruit juice, while most did not specify whether they assessed fruit juice, vegetable juice, or both.
Categorization of milk across studies
Fifteen studies evaluated associations between milk intake and weight/adiposity among children, of which 12 explicitly defined which beverages were considered “milk.” While categorization of milk varied across the 12 studies, 6 assessed both flavored (including chocolate) and unflavored milk, 5 explicitly mentioned alternative (nondairy) milks, and 2 studies mentioned “any type” or “all types” of milk in their categorizations for “milk.”
Perspectives
Heterogeneity in beverage categorization has critical implications for nutritionsearch and nutlicy. As an example of the policy implications, nonfat and low-fat flavored, sweetened milks are allowed as part of the National School Lunch Program (52), which reaches ∼30 million children and adolescents across the United States each day. Failure to account for these sweetened, flavored milks as contributors to total SSB intake likely results in underestimation of overall SSB and added sugar consumption. SSB taxation is another policy-related example, which necessitates consistency in beverage classification. While SSB taxes have been implemented in several cities across the United States and worldwide (53), the specific beverages that are taxed differ. For example, artificially sweetened beverages are subjected to the tax in Philadelphia (54), but not in Berkeley, California (55).
In an effort to move the field towards greater transparency in beverage categorization, and to meaningfully inform development of nutrition policies to promote healthier beverage consumption among youth, we have developed an initial beverage classification system (Table 3). This approach was developed based on the observed inconsistencies in beverage classification across studies evaluating associations between beverage consumption and body weight and/or adiposity among children. In addition to facilitating meaningful comparisons across studies, having a standardized beverage classification system would facilitate the development of FFQs that could more consistently, accurately, and comprehensively assess beverage intake.
TABLE 3.
Proposed beverage categorization for use in studies evaluating associations between beverage consumption and body weight and/or adiposity among children

|

|
Includes powdered beverages, water enhancers, and concentrates.
Includes beverages containing low-calorie sweeteners, regardless of whether synthetic (e.g., sucralose) or naturally derived (e.g., stevia).
This approach (Table 3) is imprecise by design, as detailed in “Challenges in Beverage Categorization” below, and encompasses several layers of specificity. Categorization begins with the broadest categories (leftmost column) which are further subcategorized based on key beverage attributes (moving from left to right). While we recognize that numerous alternative subcategorizations are possible, our approach organizes beverages based on the presence and source of sugar and sweeteners and the presence of caffeine. This is particularly timely in light of changes to the Nutrition Facts Panel, specifically with regard to the addition of a line for “added sugar” content and a corresponding Daily Value (56). Added sugar content may be an appropriate starting point for beverage categorization. We also differentiated between beverages with and without caffeine because caffeine is a stimulant (57, 58), and thus, consuming caffeinated beverages may reflect a unique behavior. We have also differentiated between nondairy, dairy, and dairy-alternative beverages because milk is a key contributor to beverage calories among young children (1).
Input from scientific organizations and expert consensus panels is needed to first define priorities for beverage categorization (e.g., in relation to weight-related outcomes, with regard to cognitive development, in the context of bone health, etc.) before a definitive framework can be created. In addition, collaboration with regulatory bodies and agencies overseeing beverage standards of identity is also advised, in order to leverage and build upon existing classification systems.
Challenges in Beverage Categorization
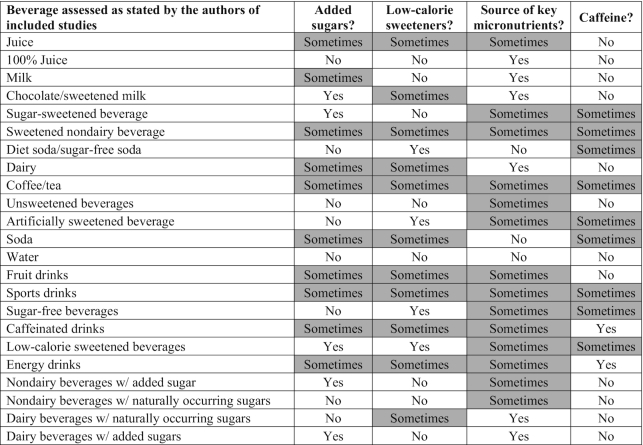
We encountered a number of challenges in developing this beverage categorization system. To illustrate these challenges, we organized the beverage categories that were used in the studies included in our systematic review, based on their ingredient compositions, in Table 4. Beverages grouped based on 1 ingredient (e.g., sugar content) were not always consistent across other ingredients (e.g., caffeine), and thus, many subcategories are labeled as “sometimes” in Table 4. This emphasizes the need to prioritize key aspects of beverages prior to classification system development in order to arrive at an ideal categorization.
TABLE 4.
Inherent imprecision in developing a standardized beverage classification system
|
Another issue adding complexity is the rapidly evolving US beverage landscape. For example, significant emphasis has been placed on lowering the sugar and calorie content of beverages over the past decade (59), which has led to increased use of low-calorie sweeteners. Initiatives such as the Balanced Calories Initiative have encouraged beverage companies to invest in healthy-product attributes, and have further diversified the beverage landscape with additions such as cold-pressed juices, plant-based beverages, value-added dairy, and energy drinks to name a few. In fact, from 2003 to 2015, the number of new beverage SKUs (stock-keeping units) increased from 2000 to 4300 (57).
Consumers are also increasingly health conscious, and manufacturers are responding by adding functional ingredients to beverages, such as calcium, antioxidants, and vitamins/minerals (60). In 2011, for example, the US beverage industry launched more products directed toward energy/alertness than any other functional ingredient, followed by beverages claiming digestive benefit and those claiming heart-health benefit (60). These product attributes have further complicated arriving at definitive beverage categorization, which underscores the need to create a standardized system to better inform evidence-based nutrition policy and facilitate synthesis and interpretation of research findings.
Despite these challenges, standardization of beverage categorization is certainly possible. We recommend a focus on key characteristics of beverages relative to a particular outcome of interest (e.g., sugar content for dental caries vs. energy content for body weight), rather than attempting to capture beverages based on an array of different ingredients (LCS, caffeine, specific micronutrients, etc.). Table 3 puts forth a stepwise approach for researchers, policy makers, and other key stakeholders to follow, with the goal of streamlining beverage categorization in light of the highly complex and rapidly evolving beverage landscape.
Conclusions
Marked differences in beverage categorization exist across observational studies investigating associations between beverage intake and body weight/adiposity among children. We recommend that professional organizations (such as ASN) and/or federal agencies (such as the NIH or the Centers for Disease Control and Prevention) involved in research related to beverage intake convene an expert working group to create the classification system. The classification system should build on existing beverage standards of identity put forward by the UN FAO Codex Alimentarius and other national agencies involved in overseeing food standards of identity. Researchers should consistently apply the agreed-upon final beverage categorization scheme in their dietary assessments to facilitate comparison of findings across studies, and to support the development of evidence-based public health nutrition policies.
ACKNOWLEDGEMENTS
The authors responsibilities were as follows—EKD, KR, and ACS: designed the study; PEM, EKD, and ACS: extracted and analyzed the data; all authors edited and reviewed the manuscript and read and approved the final version.
Notes
The authors reported no funding received for this work.
Author disclosures: The authors report no conflicts of interest.
Perspective articles allow authors to take a position on a topic of current major importance or controversy in the field of nutrition. As such, these articles could include statements based on author opinions or point of view. Opinions expressed in Perspective articles are those of the author and are not attributable to the funder(s) or the sponsor(s) or the publisher, Editor, or Editorial Board of Advances in Nutrition. Individuals with different positions on the topic of a Perspective are invited to submit their comments in the form of a Perspectives article or in a Letter to the Editor.
Contributor Information
Patrick E Merkel, Department of Exercise and Nutrition Sciences, Milken Institute School of Public Health, The George Washington University , Washington, DC, USA.
Emma K Ditto, Department of Exercise and Nutrition Sciences, Milken Institute School of Public Health, The George Washington University , Washington, DC, USA.
Kim Robien, Department of Exercise and Nutrition Sciences, Milken Institute School of Public Health, The George Washington University , Washington, DC, USA; Sumner M Redstone Global Center for Prevention and Wellness, Milken Institute School of Public Health, The George Washington University, Washington, DC, USA.
Allison C Sylvetsky, Department of Exercise and Nutrition Sciences, Milken Institute School of Public Health, The George Washington University , Washington, DC, USA; Sumner M Redstone Global Center for Prevention and Wellness, Milken Institute School of Public Health, The George Washington University, Washington, DC, USA.
References
- 1. Drewnowski A, Rehm CD. Consumption of added sugars among US children and adults by food purchase location and food source. Am J Clin Nutr. 2014;100(3):901–7. [DOI] [PMC free article] [PubMed] [Google Scholar]
- 2. World Health Organization. Sugar intake for adults and children. Geneva (Switzerland): WHO; 2015. [Google Scholar]
- 3. Woodward-Lopez G, Kao J, Ritchie L. To what extent have sweetened beverages contributed to the obesity epidemic?. Public Health Nutr. 2011;14(3):499–509. [DOI] [PubMed] [Google Scholar]
- 4. Luger M, Lafontan M, Bes-Rastrollo M, Winzer E, Yumuk V, Farpour-Lambert N. Sugar-sweetened beverages and weight gain in children and adults: a systematic review from 2013 to 2015 and a comparison with previous studies. Obes Facts. 2017;10(6):674–93. [DOI] [PMC free article] [PubMed] [Google Scholar]
- 5. Malik VS, Schulze MB, Hu FB. Intake of sugar-sweetened beverages and weight gain: a systematic review. Am J Clin Nutr. 2006;84(2):274–88. [DOI] [PMC free article] [PubMed] [Google Scholar]
- 6. Malik VS, Pan A, Willett WC, Hu FB. Sugar-sweetened beverages and weight gain in children and adults: a systematic review and meta-analysis. Am J Clin Nutr. 2013;98(4):1084–102. [DOI] [PMC free article] [PubMed] [Google Scholar]
- 7. Bleich SN, Vercammen KA, Koma JW, Li Z. Trends in beverage consumption among children and adults, 2003–2014. Obesity. 2018;26(2):432–41. [DOI] [PubMed] [Google Scholar]
- 8. Munsell CR, Harris JL, Sarda V, Schwartz MB. Parents' beliefs about the healthfulness of sugary drink options: opportunities to address misperceptions. Public Health Nutr. 2016;19(1):46–54. [DOI] [PMC free article] [PubMed] [Google Scholar]
- 9. Miller PE, McKinnon RA, Krebs-Smith SM, Subar AF, Chriqui J, Kahle L, Reedy J. Sugar-sweetened beverage consumption in the U.S.: novel assessment methodology. Am J Prev Med. 2013;45(4):416–21. [DOI] [PubMed] [Google Scholar]
- 10. Welsh JA, Lundeen EA, Stein AD. The sugar-sweetened beverage wars: public health and the role of the beverage industry. Curr Opin Endocrinol Diabetes Obes. 2013;20(5):401–6. [DOI] [PMC free article] [PubMed] [Google Scholar]
- 11. Piontak JR, Russell MA, Danese A, Copeland WE, Hoyle RH, Odgers CL. Violence exposure and adolescents' same-day obesogenic behaviors: new findings and a replication. Soc Sci Med. 2017;189:145–51. [DOI] [PMC free article] [PubMed] [Google Scholar]
- 12. Hasnain SR, Singer MR, Bradlee ML, Moore LL. Beverage intake in early childhood and change in body fat from preschool to adolescence. Child Obes. 2014;10(1):42–9. [DOI] [PMC free article] [PubMed] [Google Scholar]
- 13. Welsh JA, Wang Y, Figueroa J, Brumme C. Sugar intake by type (added vs. naturally occurring) and physical form (liquid vs. solid) and its varying association with children's body weight, NHANES 2009–2014. Pediatr Obes. 2018;13(4):213–21. [DOI] [PubMed] [Google Scholar]
- 14. Seifert SM, Schaechter JL, Hershorin ER, Lipshultz SE. Health effects of energy drinks on children, adolescents, and young adults. Pediatrics. 2011;127(3):511–28. [DOI] [PMC free article] [PubMed] [Google Scholar]
- 15. Williams RD Jr, Housman JM, Odum M, Rivera AE. Energy drink use linked to high-sugar beverage intake and BMI among teens. Am J Health Behav. 2017;41(3):259–65. [DOI] [PubMed] [Google Scholar]
- 16. Sanchis-Gomar F, Pareja-Galeano H, Cervellin G, Lippi G, Earnest CP. Energy drink overconsumption in adolescents: implications for arrhythmias and other cardiovascular events. Can J Cardiol. 2015;31(5):572–5. [DOI] [PubMed] [Google Scholar]
- 17. Committee on Nutrition, Council on Sports, Medicine, and Fitness. Sports drinks and energy drinks for children and adolescents: are they appropriate?. Pediatrics. 2011;127(6):1182–9. [DOI] [PubMed] [Google Scholar]
- 18. O'Neil CE, Nicklas TA, Kleinman R. Relationship between 100% juice consumption and nutrient intake and weight of adolescents. Am J Health Promot. 2010;24(4):231–7. [DOI] [PubMed] [Google Scholar]
- 19. Wiley AS. Dairy and milk consumption and child growth: is BMI involved? An analysis of NHANES 1999–2004. Am J Hum Biol. 2010;22(4):517–25. [DOI] [PubMed] [Google Scholar]
- 20. Cunningham SA, Zavodny M. Does the sale of sweetened beverages at school affect children's weight?. Soc Sci Med. 2011;73(9):1332–9. [DOI] [PMC free article] [PubMed] [Google Scholar]
- 21. Carlson JA, Crespo NC, Sallis JF, Patterson RE, Elder JP. Dietary-related and physical activity-related predictors of obesity in children: a 2-year prospective study. Child Obes. 2012;8(2):110–5. [DOI] [PMC free article] [PubMed] [Google Scholar]
- 22. Davis JN, Whaley SE, Goran MI. Effects of breastfeeding and low sugar-sweetened beverage intake on obesity prevalence in Hispanic toddlers. Am J Clin Nutr. 2012;95(1):3–8. [DOI] [PubMed] [Google Scholar]
- 23. Evans EW, Must A, Anderson SE, Curtin C, Scampini R, Maslin M, Bandini L. Dietary patterns and body mass index in children with autism and typically developing children. Res Autism Spectr Disord. 2012;6(1):399–405. [DOI] [PMC free article] [PubMed] [Google Scholar]
- 24. Laska MN, Murray DM, Lytle LA, Harnack LJ. Longitudinal associations between key dietary behaviors and weight gain over time: transitions through the adolescent years. Obesity. 2012;20(1):118–25. [DOI] [PMC free article] [PubMed] [Google Scholar]
- 25. Taber DR, Stevens J, Poole C, Maciejewski ML, Evenson KR, Ward DS. State disparities in time trends of adolescent body mass index percentile and weight-related behaviors in the United States. J Community Health. 2012;37(1):242–52. [DOI] [PMC free article] [PubMed] [Google Scholar]
- 26. Tovar A, Chui K, Hyatt RR, Kuder J, Kraak VI, Choumenkovitch SF, Hastings A, Bloom J, Economos CD. Healthy-lifestyle behaviors associated with overweight and obesity in US rural children. BMC Pediatr. 2012;12:102. [DOI] [PMC free article] [PubMed] [Google Scholar]
- 27. DeBoer MD, Scharf RJ, Demmer RT. Sugar-sweetened beverages and weight gain in 2- to 5-year-old children. Pediatrics. 2013;132(3):413–20. [DOI] [PMC free article] [PubMed] [Google Scholar]
- 28. Flores G, Lin H. Factors predicting severe childhood obesity in kindergarteners. Int J Obes. 2013;37(1):31–9. [DOI] [PubMed] [Google Scholar]
- 29. Govindan M, Gurm R, Mohan S, Kline-Rogers E, Corriveau N, Goldberg C, Durussel-Weston J, Eagle KA, Jackson EA; University of Michigan Health System . Gender differences in physiologic markers and health behaviors associated with childhood obesity. Pediatrics. 2013;132(3):468–74. [DOI] [PubMed] [Google Scholar]
- 30. Kosova EC, Auinger P, Bremer AA. The relationships between sugar-sweetened beverage intake and cardiometabolic markers in young children. J Acad Nutr Diet. 2013;113(2):219–27. [DOI] [PMC free article] [PubMed] [Google Scholar]
- 31. Ledoux TA, Watson K, Barnett A, Nguyen NT, Baranowski JC, Baranowski T. Components of the diet associated with child adiposity: a cross-sectional study. J Am Coll Nutr. 2011;30(6):536–46. [DOI] [PubMed] [Google Scholar]
- 32. Mandal B, Powell LM. Child care choices, food intake, and children's obesity status in the United States. Econ Hum Biol. 2014;14:50–61. [DOI] [PubMed] [Google Scholar]
- 33. Beck AL, Tschann J, Butte NF, Penilla C, Greenspan LC. Association of beverage consumption with obesity in Mexican American children. Public Health Nutr. 2014;17(2):338–44. [DOI] [PMC free article] [PubMed] [Google Scholar]
- 34. Davis JN, Koleilat M, Shearrer GE, Whaley SE. Association of infant feeding and dietary intake on obesity prevalence in low-income toddlers. Obesity (Silver Spring). 2014;22(4):1103–11. [DOI] [PubMed] [Google Scholar]
- 35. Field AE, Sonneville KR, Falbe J, Flint A, Haines J, Rosner B, Camargo CA Jr. Association of sports drinks with weight gain among adolescents and young adults. Obesity (Silver Spring). 2014;22(10):2238–43. [DOI] [PMC free article] [PubMed] [Google Scholar]
- 36. Hauser SI, Economos CD, Nelson ME, Goldberg JP, Hyatt RR, Naumova EN, Anderson SE, Must A. Household and family factors related to weight status in first through third graders: a cross-sectional study in Eastern Massachusetts. BMC Pediatr. 2014;14:167. [DOI] [PMC free article] [PubMed] [Google Scholar]
- 37. Limbers CA, Young D, Grimes GR. Dietary, physical activity, and sedentary behaviors associated with percent body fat in rural Hispanic youth. J Pediatr Health Care. 2014;28(1):63–70. [DOI] [PubMed] [Google Scholar]
- 38. Santiago S, Zazpe I, Bes-Rastrollo M, Sanchez-Tainta A, Sayon-Orea C, de la Fuente-Arrillaga C, Benito S, Martinez JA, Martinez-Gonzalez MA. Carbohydrate quality, weight change and incident obesity in a Mediterranean cohort: the SUN project. Eur J Clin Nutr. 2015;69(3):297–302. [DOI] [PubMed] [Google Scholar]
- 39. Shefferly A, Scharf RJ, DeBoer MD. Longitudinal evaluation of 100% fruit juice consumption on BMI status in 2-5-year-old children. Pediatr Obes. 2016;11(3):221–7. [DOI] [PMC free article] [PubMed] [Google Scholar]
- 40. Guerrero AD, Mao C, Fuller B, Bridges M, Franke T, Kuo AA. Racial and ethnic disparities in early childhood obesity: growth trajectories in body mass index. J Racial Ethn Health Disparities. 2016;3(1):129–37. [DOI] [PMC free article] [PubMed] [Google Scholar]
- 41. Nezami M, Segovia-Siapco G, Beeson WL, Sabate J. Associations between consumption of dairy foods and anthropometric indicators of health in adolescents. Nutrients. 2016;8(7):427. [DOI] [PMC free article] [PubMed] [Google Scholar]
- 42. Santiago-Torres M, Cui Y, Adams AK, Allen DB, Carrel AL, Guo JY, LaRowe TL, Schoeller DA. Structural equation modeling of the associations between the home environment and obesity-related cardiovascular fitness and insulin resistance among Hispanic children. Appetite. 2016;101:23–30. [DOI] [PMC free article] [PubMed] [Google Scholar]
- 43. Shearrer GE, Daniels MJ, Toledo-Corral CM, Weigensberg MJ, Spruijt-Metz D, Davis JN. Associations among sugar sweetened beverage intake, visceral fat, and cortisol awakening response in minority youth. Physiol Behav. 2016;167:188–93. [DOI] [PMC free article] [PubMed] [Google Scholar]
- 44. DeBoer MD, Agard HE, Scharf RJ. Milk intake, height and body mass index in preschool children. Arch Dis Child. 2015;100(5):460–5. [DOI] [PMC free article] [PubMed] [Google Scholar]
- 45. Fletcher EA, Carson V, McNaughton SA, Dunstan DW, Healy GN, Salmon J. Does diet mediate associations of volume and bouts of sedentary time with cardiometabolic health indicators in adolescents?. Obesity (Silver Spring). 2017;25(3):591–9. [DOI] [PMC free article] [PubMed] [Google Scholar]
- 46. Jackson SL, Cunningham SA. The stability of children's weight status over time, and the role of television, physical activity, and diet. Prev MedPrev Med. 2017;100:229–34. [DOI] [PMC free article] [PubMed] [Google Scholar]
- 47. Marshall TA, Van Buren JM, Warren JJ, Cavanaugh JE, Levy SM. Beverage consumption patterns at age 13 to 17 years are associated with weight, height, and body mass index at age 17 years. J Acad Nutr Diet. 2017;117(5):698–706. [DOI] [PMC free article] [PubMed] [Google Scholar]
- 48. Sylvetsky AC, Jin Y, Mathieu K, DiPietro L, Rother KI, Talegawkar SA. Low-calorie sweeteners: disturbing the energy balance equation in adolescents?. Obesity (Silver Spring). 2017;25(12):2049–54. [DOI] [PMC free article] [PubMed] [Google Scholar]
- 49. Davis JN, Asigbee FM, Markowitz AK, Landry MJ, Vandyousefi S, Khazaee E, Ghaddar R, Goran MI. Consumption of artificial sweetened beverages associated with adiposity and increasing HbA1c in Hispanic youth. Clin Obes. 2018;8(4):236–43. [DOI] [PMC free article] [PubMed] [Google Scholar]
- 50. Marshall TA, Curtis AM, Cavanaugh JE, VanBuren JM, Warren JJ, Levy SM. Description of child and adolescent beverage and anthropometric measures according to adolescent beverage patterns. Nutrients. 2018;10(8):E958. [DOI] [PMC free article] [PubMed] [Google Scholar]
- 51. Food for Human Consumption. 21 CFR Volume 2, CFR21.101.30 (2019). [Google Scholar]
- 52. USDA.The National School Lunch Program [Internet]. Available from: https://fns-prod.azureedge.net/sites/default/files/resource-files/NSLPFactSheet.pdf. [Google Scholar]
- 53. Chaloupka FJ, Powell LM, Warner KE. The use of excise taxes to reduce tobacco, alcohol, and sugary beverage consumption. Annu Rev Public Health. 2019;40:187–201. [DOI] [PubMed] [Google Scholar]
- 54. City of Philadelphia. Sugar-Sweetened Beverage Tax (“SBT”) regulations. Philadelphia (PA): City of Philadelphia; 2017. [Google Scholar]
- 55. Falbe J, Thompson HR, Becker CM, Rojas N, McCulloch CE, Madsen KA. Impact of the Berkeley excise tax on sugar-sweetened beverage consumption. Am J Public Health. 2016;106(10):1865–71. [DOI] [PMC free article] [PubMed] [Google Scholar]
- 56. Malik VS, Willett WC, Hu FB. The revised nutrition facts label: a step forward and more room for improvement. JAMA. 2016;316(6):583–4. [DOI] [PMC free article] [PubMed] [Google Scholar]
- 57. Heatherley SV, Hancock KM, Rogers PJ. Psychostimulant and other effects of caffeine in 9- to 11-year-old children. J Child Psychol Psychiatry. 2006;47(2):135–42. [DOI] [PubMed] [Google Scholar]
- 58. Temple JL. Caffeine use in children: what we know, what we have left to learn, and why we should worry. Neurosci Biobehav Rev. 2009;33(6):793–806. [DOI] [PMC free article] [PubMed] [Google Scholar]
- 59. Beverage Marketing Corporation. BevTech 2016: The shifting beverage landscape. New York (NY): Beverage Marketing Corporation; 2016. [Google Scholar]
- 60. Sloan EHC. Beverage trends in 2012 and beyond. Functional Beverages. 2012;23(4):8–12. [Google Scholar]