

ABSTRACT
Misreporting of added sugar intake has been the major criticism of studies linking high added sugar consumption to adverse health outcomes. Despite the advancement in dietary assessment methodologies, the bias introduced by self-reporting can never be completely eliminated. The search for an objective biomarker for total added sugar intake has therefore been a topic of interest. In this article, the reasons this search may be a wild goose chase will be outlined and discussed. The limitations and inability of the 2 candidate biomarkers, namely urinary sucrose and fructose and δ¹³C isotope, which are based on the 2 only possible ways (i.e., difference in metabolism and plant sources) to identify added sugar based on current knowledge in human physiology and food and nutritional sciences, are discussed in detail. Validation studies have shown that these 2 candidate biomarkers are unlikely to be suitable for use as a predictive or calibration biomarker for total added sugar intake. Unless advancement in our understanding in human physiology and food and nutritional sciences leads to new potential ways to distinguish between naturally occurring and added sugars, it is extremely unlikely that any accurate objective added sugar biomarker could be found. It may be time to stop the futile effort in searching for such a biomarker, and resources may be better spent on further improving and innovating dietary assessment methods to minimize the bias introduced by self-reporting.
Keywords: added sugars, biomarker, δ¹³C isotope, urinary sucrose, metabolite, validity
Introduction
Added sugars are commonly defined as sugars added to foods during production or cooking (1). The potential negative effects of excessive added sugar intake on health outcomes have been a hot topic of research in recent years. Studies have linked high added sugar consumption to overweight and obesity (2), as well as various chronic diseases such as metabolic syndrome (3) and cardiovascular diseases (4, 5). Individuals who consume a high proportion of energy from added sugars were also reported to have poorer diet quality (6–12). Health care professionals have long been recommending added sugar intake to be limited, as they are considered empty calories with little nutritional importance. Building upon the growing body of evidence, the World Health Organization (WHO) updated their quantitative guidelines on sugar intake in 2015, which focused on “free sugars,” defined as added sugars plus natural sugars found in honey, syrups, and fruit juices (13). The new guidelines recommend that free sugar intake should contribute <10% of the total energy intake of the diet, with a further reduction to <5% of total energy for additional health benefits (13).
Although the majority of studies point to positive associations between added sugars and adverse health outcomes as outlined above, some researchers argue that misreporting in self-reported dietary assessment methods may have biased the added sugars-disease relation in nutritional epidemiological studies, potentially attenuating the associations observed (14). Unarguably, most dietary assessment methods, especially those commonly used such as FFQs and 24-h recalls, are prone to misreporting (15), where food high in added sugars such as sugar-sweetened beverages and snacks are commonly underreported (16, 17). This could be due to memory bias, inability to estimate portion size accurately, or social desirability bias (18).
Researchers have therefore been searching for methods to estimate/measure added sugar intake which are not affected by underreporting, and biomarkers are proposed as a potential solution. It is not uncommon to see researchers list the development and use of a biomarker for added sugars to be a main point of improvement for future studies, e.g. (19), citing its ability to objectively reflect dietary added sugar intake, thus eliminating or at least minimizing the error introduced by misreporting. Nonetheless, there is little discussion on whether such a biomarker indeed exists. Therefore, in this article, the reasons the search for an objective total added sugar intake biomarker may be a wild goose chase will be outlined and discussed. Since recent studies have shifted from examining the association between foods and beverages high in added sugars (e.g., sugar-sweetened beverages) and health outcomes to that based on total added sugar intake, in order to inform quantitative added sugar intake guidelines, this article will focus on biomarkers for total added sugar intake rather than that for foods high in added sugars.
Characteristics of a Good Biomarker
Biomarkers of food/nutrient intake are biomolecules in the body that reflect the dietary intake and/or metabolism of the food/nutrient of interest (20). Ideally, a good biomarker should allow researchers to predict/estimate the true intake without the need of self-report, usually via a regression equation (e.g., predicted true intake = β1 × biomarker concentration + β2 × age + β3 × sex + constant). Nonetheless, at the very least, a biomarker of a nutrient should show good correlation (where r = 0.5 to 0.7 is considered acceptable) (21) or dose-response relation with the true intake, enabling its use for validating and calibrating self-reported intake, which is prone to misreporting (20, 22). Biomarkers should at least be able to correctly classify individuals into high versus low (and possibly non) consumers. It is important to note that due to the complexity and high interindividual variability in digestion, absorption, and human metabolism (22), it is virtually impossible to find a food/nutrient biomarker with perfect correlation (i.e., r = 1) to dietary intake.
Dietary Sources and Types of Added Sugars in the Human Diet
The major dietary sources of added/free sugars in various populations have been previous reported (23–33). Generally speaking, the majority of dietary added/free sugars in a typical diet come from sugar-sweetened beverages, grain-based desserts, and confectionery. Although some of these have rather simple compositions that are mostly plant-based, e.g., sugar-sweetened beverages; others have more complicated compositions made of plant- and animal-based ingredients, e.g., cake and biscuits.
Several studies to date have examined the types of added sugars used in the food supply in various countries (34–37). A summary of the top 3 types of added sugars used in these countries is provided in Table 1. All of these top added sugar contributors were either single or a mixture of monomers of glucose or fructose, or sucrose (table sugar) which is a disaccharide consisting of 2 units: glucose and fructose. The other commonly used added sugars in the food supply include lactose (glucose + galactose), molasses (glucose + fructose), honey (mainly fructose, glucose, and maltose with other disaccharides), rice or starch syrup (glucose), and fruit juice concentrates (glucose + fructose) (Table 2). Current food science knowledge suggests there is no structural difference between naturally occurring forms of these sugars and the forms used in the abovementioned sweetening agents, especially when some of the sugar-producing crops can be used as food themselves (e.g., corn) and in that case the sugars they contain are considered naturally occurring.
TABLE 1.
Top 3 types of added sugars used in different countries
| Countries | Most frequently used | Second most frequently used | Third most frequently used |
|---|---|---|---|
| Australia (36) | Cane sugar (sucrose) | Glucose syrups | Glucose |
| Brazil (37) | Cane sugar (sucrose) | Maltodextrin | Glucose syrup |
| Canada (34) | Cane sugar (sucrose) | Glucose | Corn syrup |
| United States (35) | Corn syrup | Sorghum sugar (sucrose rich) | Cane sugar (sucrose) |
TABLE 2.
Chemical composition of commonly used added sugars and their natural source
| Added sugars | Chemical composition of sugar | Natural sources |
|---|---|---|
| Sucrose/table sugar | Sucrose (1 glucose + 1 fructose) | 1 Sugarcane, beets |
| High-fructose corn syrup | Fructose (42–55%) and glucose | 1 Corn |
| Lactose | Lactose (1 glucose + 1 galactose) | Dairy products |
| Glucose | Glucose | Wheat, 1corn |
| Fructose | Fructose | Wheat, 1corn, fruits |
| Corn syrup | Maltose and oligoglucose | 1 Corn |
| Molasses | Sucrose (1 glucose + 1 fructose) and invert sugar (1 glucose + 1 fructose) | 1 Sugarcane, beets |
| Honey | Fructose, glucose, maltose (glucose + glucose), and other disaccharides | Beehives |
| Starch/glucose syrup | Glucose, oligoglucose, and dextrin | Rice, wheat, potatoes, barley, cassava, 1corn |
| Maltodextrin | Glucose oligomer and/or polymer | Wheat, 1corn |
| Fruit juice concentrates | Varying proportions of glucose, fructose, and sucrose | Fruits |
Plants using the C4-pathway for sugar synthesis.
An Overview of Digestion, Absorption, and Metabolism of Dietary Sugars; and the Possible Existence of Metabolism/Metabolite-Based Added Sugar Biomarkers
Most nonmonosaccharide dietary sugars undergo some form of digestion before being absorbed into the bloodstream for further metabolism, which involves breaking down the di- or oligosaccharide molecules into their constituent monosaccharide units. These units could be glucose, fructose, or galactose. Glucose and galactose are readily absorbed into the body with the help of sodium-dependent and -independent glucose transporters, whilst fructose is absorbed with the assistance of the fructose transporter type 5 (GLUT5; 38). Once in the body, galactose is metabolized via the Leloir pathway into glucose for further metabolism via the glycolytic pathway (39), or into D-xylulose for use in the pentose phosphate pathway. In some rare situations disaccharides such as sucrose could “leak” into the bloodstream via nonmediated passive diffusion through the intact intestinal wall (40, 41), but there is high intra- and interindividual variation (41). For example, the gut lining of some individuals may allow more sucrose molecules to pass through than others, and the permeability of the gut lining to sucrose molecules may also be affected by the health condition of the individuals, e.g. healthy compared with during gut infection. The amount of sucrose that appears in the urine is therefore not uniformly correlated to the intake of total sugars in different individuals. Nonetheless, there is no known human biochemical pathway that utilizes sucrose, and as such it will need to be broken down into glucose and fructose for further metabolism or remain intact and be excreted in the urine.
Urinary excretion of sucrose and fructose have recently been proposed to be a good biomarker for total sugar intake (41, 42). However, its potential as an objective and accurate added sugar biomarker is likely low given the correlation between total sugar and added sugar intake may not always follow a linear pattern. Individuals with high total sugar consumption could either have a high intake of natural sugars (e.g. from fruits), a high intake of high added sugar foods, or both. Using data of the first 24-h recall from the adult respondents of the 2011–2012 Australian Health Survey dataset (unweighted n = 6228 adults after excluding energy misreporters) (32), it was observed that although the correlation between total sugar and added sugar intake was found to be 0.85 (Figure 1A), the proportion of total sugars as added sugars ranged widely from 0 to 100% (IQR: 28.7–64.4%) with a roughly normal distribution (Figure 1B). Due to the chemical indistinguishability between naturally occurring and added forms of the same sugar molecule, this limitation seems insurmountable.
FIGURE 1.

(A) Scatterplot of total sugar vs. added sugar intake; and (B) distribution of proportion of total sugars as added sugars of adult respondents of the 2011–2012 Australian Health Survey (32). The line of best fit and R2 in panel A were calculated using simple linear regression between x and y values. Panel A showed that there was great variability in the proportion of total sugars as added sugar across the spectrum of total sugar intake; and panel B illustrated that the distribution of proportion of total sugars as added sugar roughly follows a normal distribution.
Once absorbed into the blood, the main biochemical pathways involved in glucose and fructose metabolism are glycolysis, glycogenesis, and de novo fatty acid synthesis (43), where glucose and fructose enter these pathways at different points. However, since naturally occurring glucose and fructose (and their corresponding disaccharide and oligosaccharide forms) and those found in sweetening agents are chemically identical, there is no reason to expect them to be metabolized differently in the human body, which disproves the existence of a biomarker based on sugar metabolism/metabolites, although the existence of a biomarker for high added sugar foods (rather than added sugars per se) based on metabolites of other unique constituents of those foods (e.g., cola-flavoring for cola-based soft drinks) could not be completely ruled out (44).
Biomarkers Based on Distinguishing Between Naturally Occurring and Added Sugars According to Their Natural Source
Another way to distinguish between naturally occurring and added sugars is to examine their natural sources (Table 2) using an isotope-based method (45–53). In brief, it was proposed that since certain types of crops used to produce sweeteners (e.g., corn for high-fructose corn syrup) utilize the C4-pathway for sugar synthesis compared with the C3-pathway used by plants, which are used as food high in naturally occurring sugars (e.g., fruits) (45, 54), and that the δ¹³C isotope is more readily incorporated in the sugar molecules in the C4-pathway than the C3-pathway (45), it may be possible to develop a biomarker based on the δ¹³C isotope, which is rather stable and could be found in various types of tissue or blood samples such as hair and RBCs from fingerstick blood (47, 55). While acknowledging certain limitations which are discussed below, proponents of the isotope-based method claim that it is promising and should be further developed and improved.
A main limitation of this isotope-based method is that it will theoretically only work for added sugars from corn- and sugarcane-based sweeteners; and it cannot reflect the intake of other added sugars produced from wheat or other plants (Table 2). Although sugarcane- and corn-based sweeteners account for the majority of sweeteners used in the food supply, this proportion varies between countries, as reflected by the top type of sweeteners used in different countries shown in Table 1. Furthermore, data from the USA, where the use of corn-based sweeteners is common, suggest that the contribution of corn-based sweeteners to total sweetener intake dropped from 50.8% to 43.2% between 2008 and 2018, whereas that contributed by refined sugars (sugarcane- and sugar beets-based) increased from 48.0% to 55.1% in the same period (56). Nonetheless, even in countries where the main sweeteners used are corn- and/or sugarcane-based, the δ¹³C isotopic method is still unable able to reflect 100% of total added sugar intake.
Second, as the proponents themselves have acknowledged, there are other food sources of δ¹³C-isotope in a typical diet, such as meat from animals fed corn-based diets, marine foods, and different forms of corn used as foods, e.g., fresh/canned corn, cornflakes (49). They performed studies (49, 57) attempting to correct for the meat/marine source of δ¹³C using a nitrogen isotope (δ15N) which is found in protein but not sugar; however, the results were mixed. In 1 study (57), the R2 between the reported and predicted added sugar intake based on δ¹³C alone was only 0.03, suggesting 97% of the variance in the self-reported added sugar intake was unexplained by the δ¹³C isotope-based biomarker. Adding δ15N in the regression model improved the R2 to 0.33, which means two-thirds of the variation in the self-reported added sugar intake were still due to other factors not addressed by the isotope-based equation. In another population (49), adding δ15N in the regression model only marginally improved the R2 from 0.09 to 0.11. Although the accuracy of the self-reported added sugar intake in reflecting true intake is uncertain, such magnitude of error does not appear to be fully attributable to this limitation.
Third, the metabolic fates of the glucose and fructose moieties from C3 and C4 sugars are theoretically the same, thus their concentration in various tissues and the blood is highly unpredictable. Glucose entering the blood can either be immediately transported to various parts of the body for energy production via the glycolytic pathway and Kreb's cycle (58), where the δ¹³C in these glucose molecules are quickly lost as CO2; or for glycogen and fat production (58) in varying proportion depending on the condition when the glucose influx occurs, e.g., during exercise compared with resting. Fructose is quickly metabolized in the small intestine to glucose (which is then metabolized in the same way as described above) and organic acids when the dosage is low. In high consumption, fructose is transported to the liver for conversion into triacylglycerol via de novo fatty acid synthesis (59). δ¹³C in the liver, muscles, and adipose tissues are therefore more likely to be able to reflect usual added sugar intake from corn or sugarcane sources as these organs contain glycogen and/or triacylglycerol molecules. Nonetheless, the procedures of sampling tissues from these organs are highly invasive and may be risky (22), and the amount stored is highly dependent on the individuals’ energy balance which has high interindividual variability. On the other hand, once glucose or fructose enter the glycolytic pathway, the intermediate molecules could also be used to synthesize nonessential amino acids for protein synthesis and ribose for RNA and DNA synthesis (60), therefore some of the δ¹³C from C4 sugars may end up in these biomolecules in different tissues and cells, allowing its detection using less invasive samples such as hair or blood (55). However, a big assumption of this approach is that the interindividual variability in the metabolic fate of dietary glucose and fructose moieties is low, which is unlikely (22).
Fourth, the precision of the method also appears to be suboptimal for an objective biomarker. Further examination of the data of the study by Hedrick et al. which attempted to correct for δ15N (49) raised additional concerns about the robustness of the statistical analyses behind the validation of the δ¹³C isotope-based method. Using data generated from reverse-engineering the scatterplot (using WebPlotDigitizer https://apps.automeris.io/wpd/) in the article (49) to illustrate the point, with the understanding that it may have introduced minor errors in the process, the original scatterplot where the x- and y-axes are drawn in the same scale (Figure 2A), the nonnatural logged version of the scatterplot (Figure 2B) and a Bland–Altman plot (Figure 3) were produced. All 3 plots raised substantial concerns regarding the precision of the isotope-based method, especially the Bland–Altman plot which showed there is an increasing trend of underestimation of added sugar intake by the δ¹³C isotope-based method at higher intakes. The mean ± SD absolute difference between the predicted and self-reported value was 34.7 ± 33.7 g/d (range 0.4–169 g/d). Compared with the mean ± SD self-reported added sugar intake of 81.9 ± 51.5 g/d, this magnitude of error (>40%) seems unacceptably high. Using the median self-reported intake as the cut-point for classifying respondents as high and low consumers, the isotope-based method has a sensitivity and specificity of only 61.0% and 53.2%, respectively (Table 3). In fact, the study by MacDougall et al. (51) also reported that δ¹³C only has a specificity of 38% in discriminating between low and high consumers, although with a slightly better sensitivity of 83%. These data suggest that the δ¹³C isotopic biomarker is likely to grossly misidentify either low or high added sugar consumers, or both.
FIGURE 2.
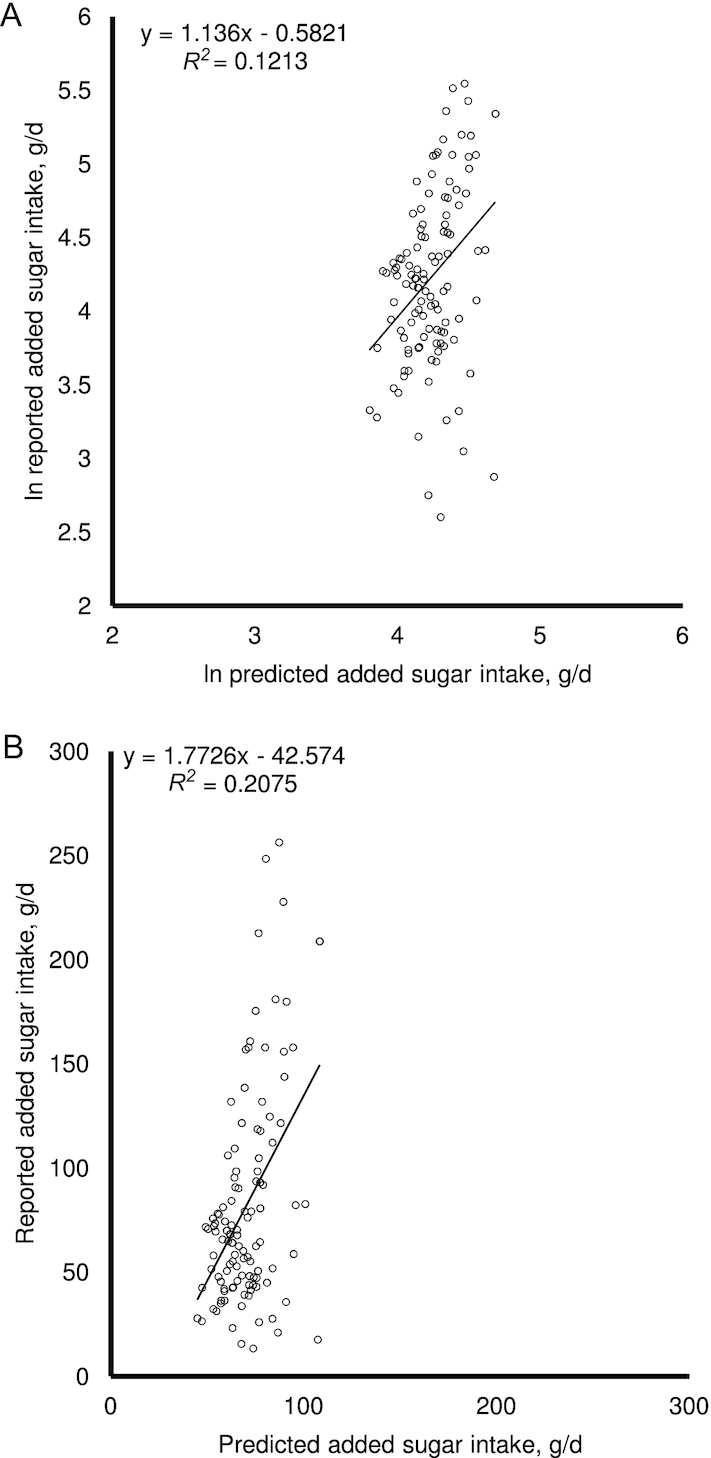
(A) Replot of data where both axes have the same scale; and (B) scatterplot of nonnatural logged values. Data were obtained from reverse-engineering of Figure 2 in Hedrick et al. (49) (n = 106, Southwest Virginian adults). The lines of best fit and R2 values were calculated using simple linear regression between x and y values. It was evident from the graphs that the predicted added sugar intake varied within a much smaller range (∼50 to 100 g/d) compared with the reported added sugar intake (∼10 to 250 g/d).
FIGURE 3.

Bland–Altman plot of data obtained from reverse-engineering of Figure 2 in Hedrick et al. (49) (n = 106, Southwest Virginian adults). The solid horizontal line represents the mean difference between the predicted and reported added sugar intake, and the 2 dotted horizontal lines represent the upper and lower limits of agreement (mean difference ± 1.96 × SD). The line of best fit and R2 were generated using simple linear regression between x and y values. Results indicated there is a significant increase in underestimation as added sugar intake increases.
TABLE 3.
Specificity and sensitivity of the δ¹³C isotope-based method in discriminating low added sugar consumers from high added sugar consumers (n = 106, Southwest Virginian adults)1
| Self-reported added sugar intakes, n | |||
|---|---|---|---|
| Low | High | ||
| Isotope-based estimate of added sugar intake, n | Low | 36 | 22 |
| High | 23 | 25 | |
Calculated from reverse-engineered data from Hedrick et al. (49). The sensitivity and specificity of the δ¹³C isotope-based method are 61.0% and 53.2%, respectively.
Last but not least, using the predicted added sugar value from the δ¹³C isotope-based biomarker to examine the added sugars-disease relation could also be problematic. To further illustrate the point, a mock dataset based on the reverse-engineered dataset from Hedrick et al. (49) was created with the association between self-reported added sugar intake and disease prevalence as outlined in Table 4. Results from simple binary logistic regression using the first quartile of added sugar intake as the referent group revealed that the significant dose-dependent association obtained using the self-reported added sugar intake became nonsignificant when predicted added sugar intake was used as the exposure, which is highly concerning.
TABLE 4.
Illustrative example based on 1binary logistic regression examining the added sugar-disease relation based on self-reported added sugar intake compared with added sugar intake estimated by the δ¹³C isotope-based equation (n = 106, Southwest Virginian adults)
| Quartiles of added sugar intake | |||||
|---|---|---|---|---|---|
| Q1 (ref) | Q2 | Q3 | Q4 | P trend | |
| Self-reported | |||||
| n (case) | 29 (8) | 28 (10) | 31 (15) | 28 (16) | — |
| Median (range) added sugar intake, g/d | 36.5 (13.5–45.6) | 56.0 (45.9–67.9) | 79.3 (68.3–98.5) | 156.5 (104.8–256.4) | — |
| OR (95% CI) | 1.00 | 1.46 (0.47, 4.48) | 2.46 (0.84, 7.22) | 3.50 (1.16, 10.58) | 0.016 |
| δ¹³C isotope-based | |||||
| n (case) | 29 (12) | 29 (13) | 29 (11) | 29 (13) | — |
| Median (range) added sugar intake, g/d | 55.7 (44.8–60.8) | 64.3 (61.6–68.8) | 73.7 (69.2–77.3) | 86.5 (77.3–108.3) | — |
| OR (95% CI) | 1.00 | 1.15 (0.41, 3.26) | 0.87 (0.30, 2.48) | 1.15 (0.41, 3.26) | 0.933 |
Calculated from a mock dataset generated based on the reverse-engineered data from Hedrick et al. (49).
Taking all the above together, it appears that the δ¹³C isotope-based biomarker is unlikely to be usable as a stand-alone biomarker for studies linking total added sugar intake (based on absolute, quantiles, or as high compared with low intake) to diseases without introducing substantial errors. Its inability to account for noncorn- or sugarcane-based added sugar intake and nonsugar sources of δ¹³C are the main caveats. With the magnitude of error reported in the literature thus far and as demonstrated above, it also appears to be unsuitable as a biomarker for calibrating self-reported intake.
Implications and Conclusions
As Potischman nicely put it in her article published in 2003 (22), “for some purposes, dietary data can be more appropriate than biomarker data.” The assessment of total added sugar intake clearly falls into this category. Although it may sound pessimistic, having considered the points raised above, it may be time for researchers to cease the obsession and futile effort in finding an accurate and objective biomarker for total added sugar intake, as the only 2 possible ways (i.e., difference in metabolism and plant sources) to distinguish between naturally occurring and added sugars based on the current knowledge and evidence in human physiology and food and nutritional sciences have been shown to be unable to accurately reflect total added sugar intake.
In fact, the margins of error reported in studies thus far, and their limitations as discussed above suggest that improvements to make these 2 ways work is unlikely to be achievable. Total added sugar intake biomarkers based on sugar metabolism/metabolites are theoretically nonexistent due to the chemical indistinguishability between the naturally occurring and added forms of the same sugars. The δ¹³C isotope-based biomarker would need to adequately address the high interindividual variability of dietary sources of C and N (possibly also O and H) and the metabolism of sugars, distinguish between δ¹³C from corn-based sweeteners and those in corn used as food, as well as improve the biomarker's specificity to a wide range of sugars used as added sugars, all of which seems to be impossible based on the current understanding of food and nutritional science.
There also does not seem to be a logical biomarker that could distinguish between the sugars eaten as refined/added sugars and those eaten as part of the same sugar-producing plants used as foods, such as sugars in corn. Although it may be technically possible to develop biomarkers for foods high in added sugars based on other characteristic constituent(s) of these items, in studies where the research question relates to total added/free sugar intake, which are required to inform future development of quantitative sugar intake guidelines, such biomarkers are unable to stand-alone without the need for total added/free sugar intake estimated via self-report or other methods.
It should also be noted that the δ¹³C isotope-based method is technically unable to estimate/predict free sugar intake, as sugars from whole fruits and their counterparts from fruit juices essentially came from the same types of plants that utilize the C3 pathway, thus nullifying the theoretical basis of the isotope-based method. Given that the WHO guidelines on sugar consumption now refer to free sugars rather than added sugars (13), the utility of an isotope-based added sugar biomarker is further limited. Resources may be better spent on improving or innovating dietary assessment methods to minimize the bias introduced by misreporting.
ACKNOWLEDGEMENTS
The author's contributions were as follows—JCYL: formatted the research question, researched data, analyzed data, wrote the manuscript, and approved the submission of this manuscript; JCYL is the guarantor of this work and has sole responsibility for the final content, and has read and approved the final manuscript.
Notes
The author reported no funding received for this work.
Author disclosure: JCYL reports no conflicts of interest.
Perspective articles allow authors to take a position on a topic of current major importance or controversy in the field of nutrition. As such, these articles could include statements based on author opinions or point of view. Opinions expressed in Perspective articles are those of the author and are not attributable to the funder(s) or the sponsor(s) or the publisher, Editor, or Editorial Board of Advances in Nutrition. Individuals with different positions on the topic of a Perspective are invited to submit their comments in the form of a Perspectives article or in a Letter to the Editor.
References
- 1. Newens KJ, Walton J. A review of sugar consumption from nationally representative dietary surveys across the world. J Hum Nutr Diet. 2016;29(2):225–40. [DOI] [PMC free article] [PubMed] [Google Scholar]
- 2. World Health Organization Guideline: Sugar Intake For Adults and Children. Geneva; 2015. [PubMed] [Google Scholar]
- 3. Cottrell RC. Sugar: an excess of anything can harm. Nature. 2012;483(7388):158. [DOI] [PubMed] [Google Scholar]
- 4. Johnson RK, Appel LJ, Brands M, Howard BV, Lefevre M, Lustig RH, Sacks F, Steffen LM, Wylie-Rosett J, American Heart Association Nutrition Committee of the Council on Nutrition PA et al. Dietary sugars intake and cardiovascular health: a scientific statement from the American Heart Association. Circulation. 2009;120(11):1011–20. [DOI] [PubMed] [Google Scholar]
- 5. Watts G. Sugar and the heart: old ideas revisited. BMJ. 2013;346:e7800. [DOI] [PubMed] [Google Scholar]
- 6. Louie JC, Tapsell LC. Association between intake of total vs added sugar on diet quality: a systematic review. Nutr Rev. 2015;73(12):837–57. [DOI] [PubMed] [Google Scholar]
- 7. Moshtaghian H, Louie JC, Charlton KE, Probst YC, Gopinath B, Mitchell P, Flood VM. Added sugar intake that exceeds current recommendations is associated with nutrient dilution in older Australians. Nutrition. 2016;32(9):937–42. [DOI] [PubMed] [Google Scholar]
- 8. Livingstone MB, Rennie KL. Added sugars and micronutrient dilution. Obes Rev. 2009;10(Suppl 1):34–40. [DOI] [PubMed] [Google Scholar]
- 9. Louie JC, Tapsell LC. Intake of total and added sugars and nutrient dilution in Australian children and adolescents. Br J Nutr. 2015;114(11):1875–86. [DOI] [PubMed] [Google Scholar]
- 10. Fulgoni VL 3rd, Gaine PC, Scott MO, Ricciuto L, DiFrancesco L. Association of added sugars intake with micronutrient adequacy in US children and adolescents: NHANES 2009–2014. Curr Dev Nutr. 2019;3(12):nzz126. [DOI] [PMC free article] [PubMed] [Google Scholar]
- 11. Mok A, Ahmad R, Rangan A, Louie JCY. Intake of free sugars and micronutrient dilution in Australian adults. Am J Clin Nutr. 2018;107(1):94–104. [DOI] [PubMed] [Google Scholar]
- 12. Wong THT, Mok A, Ahmad R, Rangan A, Louie JCY. Intake of free sugar and micronutrient dilution in Australian children and adolescents. Eur J Nutr. 2019;58(6):2485–95. [DOI] [PubMed] [Google Scholar]
- 13. World Health Organization Guideline: Sugars Intake for Adults and Children. Geneva, Switzerland: World Health Organization; 2015. [PubMed] [Google Scholar]
- 14. Mendez MA. Invited commentary: dietary misreporting as a potential source of bias in diet-disease associations: future directions in nutritional epidemiology research. Am J Epidemiol. 2015;181(4):234–6. [DOI] [PubMed] [Google Scholar]
- 15. Subar AF, Freedman LS, Tooze JA, Kirkpatrick SI, Boushey C, Neuhouser ML, Thompson FE, Potischman N, Guenther PM, Tarasuk V et al. Addressing current criticism regarding the value of self-report dietary data. J Nutr. 2015;145(12):2639–45. [DOI] [PMC free article] [PubMed] [Google Scholar]
- 16. Gemming L, Ni Mhurchu C. Dietary under-reporting: what foods and which meals are typically under-reported?. Eur J Clin Nutr. 2016;70(5):640–1. [DOI] [PubMed] [Google Scholar]
- 17. Krebs-Smith SM, Graubard BI, Kahle LL, Subar AF, Cleveland LE, Ballard-Barbash R. Low energy reporters vs others: a comparison of reported food intakes. Eur J Clin Nutr. 2000;54(4):281–7. [DOI] [PubMed] [Google Scholar]
- 18. Macdiarmid J, Blundell J. Assessing dietary intake: who, what and why of under-reporting. Nutr Res Rev. 1998;11(2):231–53. [DOI] [PubMed] [Google Scholar]
- 19. Amarra MS, Khor GL, Chan P. Intake of added sugar in Malaysia: a review. Asia Pac J Clin Nutr. 2016;25(2):227–40. [DOI] [PubMed] [Google Scholar]
- 20. Potischman N, Freudenheim JL. Biomarkers of nutritional exposure and nutritional status: an overview. J Nutr. 2003;133(3):873S–4S. [DOI] [PubMed] [Google Scholar]
- 21. Willett WC, Lenart E. Nutritional Epidemiology. 3rd ed. New York: Oxford University Press; 2013. [Google Scholar]
- 22. Potischman N. Biologic and methodologic issues for nutritional biomarkers. J Nutr. 2003;133(3):875S–80S. [DOI] [PubMed] [Google Scholar]
- 23. Afeiche MC, Koyratty BNS, Wang D, Jacquier EF, Lê K-A. Intakes and sources of total and added sugars among 4 to 13-year-old children in China, Mexico and the United States. Pediatr Obes. 2018;13(4):204–12. [DOI] [PMC free article] [PubMed] [Google Scholar]
- 24. Atmarita, Imanningsih N, Jahari AB, Permaesih ID, Chan P, Amarra MS. Consumption and sources of added sugar in Indonesia: a review. Asia Pac J Clin Nutr. 2018;27:47–64. [DOI] [PubMed] [Google Scholar]
- 25. Azaïs-Braesco V, Sluik D, Maillot M, Kok F, Moreno LA. A review of total & added sugar intakes and dietary sources in Europe. Nutr J. 2017;16(1):6. [DOI] [PMC free article] [PubMed] [Google Scholar]
- 26. Bailey RL, Fulgoni VL, Cowan AE, Gaine PC. Sources of added sugars in young children, adolescents, and adults with low and high intakes of added sugars. Nutrients. 2018;10(1):102. [DOI] [PMC free article] [PubMed] [Google Scholar]
- 27. Brisbois TD, Marsden SL, Anderson GH, Sievenpiper JL. Estimated intakes and sources of total and added sugars in the Canadian diet. Nutrients. 2014;6(5):1899–912. [DOI] [PMC free article] [PubMed] [Google Scholar]
- 28. Chatelan A, Gaillard P, Kruseman M, Keller A. Total, added, and free sugar consumption and adherence to guidelines in Switzerland: results from the First National Nutrition Survey menuCH. Nutrients. 2019;11(5):1117. [DOI] [PMC free article] [PubMed] [Google Scholar]
- 29. Drewnowski A, Rehm CD. Consumption of added sugars among US children and adults by food purchase location and food source. Am J Clin Nutr. 2014;100(3):901–7. [DOI] [PMC free article] [PubMed] [Google Scholar]
- 30. Kovalskys I, Cavagnari BM, Favieri A, Guajardo V, Gerardi A, Nogueira Previdelli A, Fisberg M, Grupo Elans. Main sources of added sugars in Argentina. Medicina (B Aires). 2019;79:358–66. [PubMed] [Google Scholar]
- 31. Kriengsinyos W, Chan P, Amarra MSV. Consumption and sources of added sugar in Thailand: a review. Asia Pac J Clin Nutr. 2018;27:262–83. [DOI] [PubMed] [Google Scholar]
- 32. Lei L, Rangan A, Flood VM, Louie JCY. Dietary intake and food sources of added sugar in the Australian population. Br J Nutr. 2016;115(5):868–77. [DOI] [PubMed] [Google Scholar]
- 33. Marinho AR, Severo M, Correia D, Lobato L, Vilela S, Oliveira A, Ramos E, Torres D, Lopes C. Total, added and free sugar intakes, dietary sources and determinants of consumption in Portugal: the National Food, Nutrition and Physical Activity Survey (IAN-AF 2015–2016). Public Health Nutr. 2020;23(5):869–81. [DOI] [PMC free article] [PubMed] [Google Scholar]
- 34. Bernstein JT, Schermel A, Mills CM, L'Abbé MR. Total and free sugar content of Canadian prepackaged foods and beverages. Nutrients. 2016;8(9):582. [DOI] [PMC free article] [PubMed] [Google Scholar]
- 35. Ng SW, Slining MM, Popkin BM. Use of caloric and noncaloric sweeteners in US consumer packaged foods, 2005–2009. J Acad Nutr Diet. 2012;112(11):1828–34.e346. [DOI] [PMC free article] [PubMed] [Google Scholar]
- 36. Probst YC, Dengate A, Jacobs J, Louie JCY, Dunford EK. The major types of added sugars and non-nutritive sweeteners in a sample of Australian packaged foods. Public Health Nutr. 2017;20(18):3228–33. [DOI] [PMC free article] [PubMed] [Google Scholar]
- 37. Scapin T, Fernandes AC, dos Anjos A, Proença RPdC. Use of added sugars in packaged foods sold in Brazil. Public Health Nutr. 2018;21(18):3328–34. [DOI] [PMC free article] [PubMed] [Google Scholar]
- 38. Wright EM, Martín MnG, Turk E. Intestinal absorption in health and disease – sugars. Best Pract Res Clin Gastroenterol. 2003;17(6):943–56. [DOI] [PubMed] [Google Scholar]
- 39. Coelho AI, Berry GT, Rubio-Gozalbo ME. Galactose metabolism and health. Curr Opin Clin Nutr Metab Care. 2015;18(4):422–7. [DOI] [PubMed] [Google Scholar]
- 40. Menzies IS. Absorption of intact oligosaccharide in health and disease. Biochem Soc Trans. 1974;2(5):1042–7. [Google Scholar]
- 41. Tasevska N. Urinary sugars – a biomarker of total sugars intake. Nutrients. 2015;7(7):5816–33. [DOI] [PMC free article] [PubMed] [Google Scholar]
- 42. Tasevska N, Midthune D, Potischman N, Subar AF, Cross AJ, Bingham SA, Schatzkin A, Kipnis V. Use of the predictive sugars biomarker to evaluate self-reported total sugars intake in the Observing Protein and Energy Nutrition (OPEN) Study. Cancer Epidemiol Biomarkers Prev. 2011;20(3):490–500. [DOI] [PMC free article] [PubMed] [Google Scholar]
- 43. Frayn KN, Kingman SM. Dietary sugars and lipid metabolism in humans. Am J Clin Nutr. 1995;62(1):250S–61S. [DOI] [PubMed] [Google Scholar]
- 44. Rothwell JA, Madrid-Gambin F, Garcia-Aloy M, Andres-Lacueva C, Logue C, Gallagher AM, Mack C, Kulling SE, Gao Q, Praticò G et al. Biomarkers of intake for coffee, tea, and sweetened beverages. Genes Nutr. 2018;13(1):15. [DOI] [PMC free article] [PubMed] [Google Scholar]
- 45. Jahren AH, Saudek C, Yeung EH, Kao WL, Kraft RA, Caballero B. An isotopic method for quantifying sweeteners derived from corn and sugar cane. Am J Clin Nutr. 2006;84(6):1380–4. [DOI] [PubMed] [Google Scholar]
- 46. Davy B, Jahren H. New markers of dietary added sugar intake. Curr Opin Clin Nutr Metab Care. 2016;19(4):282–8. [DOI] [PMC free article] [PubMed] [Google Scholar]
- 47. Davy BM, Jahren AH, Hedrick VE, Comber DL. Association of δ¹³C in fingerstick blood with added-sugar and sugar-sweetened beverage intake. J Am Diet Assoc. 2011;111(6):874–8. [DOI] [PMC free article] [PubMed] [Google Scholar]
- 48. Davy BM, Jahren AH, Hedrick VE, You W, Zoellner JM. Influence of an intervention targeting a reduction in sugary beverage intake on the δ13C sugar intake biomarker in a predominantly obese, health-disparate sample. Public Health Nutr. 2017;20(1):25–9. [DOI] [PMC free article] [PubMed] [Google Scholar]
- 49. Hedrick VE, Zoellner JM, Jahren AH, Woodford NA, Bostic JN, Davy BM. A dual-carbon-and-nitrogen stable isotope ratio model is not superior to a single-carbon stable isotope ratio model for predicting added sugar intake in Southwest Virginian adults. J Nutr. 2015;145(6):1362–9. [DOI] [PMC free article] [PubMed] [Google Scholar]
- 50. Yeung EH, Saudek CD, Jahren AH, Kao WHL, Islas M, Kraft R, Coresh J, Anderson CAM. Evaluation of a novel isotope biomarker for dietary consumption of sweets. Am J Epidemiol. 2010;172(9):1045–52. [DOI] [PMC free article] [PubMed] [Google Scholar]
- 51. MacDougall CR, Hill CE, Jahren AH, Savla J, Riebl SK, Hedrick VE, Raynor HA, Dunsmore JC, Frisard MI, Davy BM. The δ13C value of fingerstick blood is a valid, reliable, and sensitive biomarker of sugar-sweetened beverage intake in children and adolescents. J Nutr. 2018;148(1):147–52. [DOI] [PMC free article] [PubMed] [Google Scholar]
- 52. Jahren AH, Bostic JN, Davy BM. The potential for a carbon stable isotope biomarker of dietary sugar intake. J Anal At Spectrom. 2014;29(5):795–816. [Google Scholar]
- 53. Kraft RA, Jahren AH, Saudek CD. Clinical-scale investigation of stable isotopes in human blood: δ13C and δ15N from 406 patients at the Johns Hopkins Medical Institutions. Rapid Commun Mass Spectrom. 2008;22(22):3683–92. [DOI] [PubMed] [Google Scholar]
- 54. O'Brien DM. Stable isotope ratios as biomarkers of diet for health research. Annu Rev Nutr. 2015;35:565–94. [DOI] [PMC free article] [PubMed] [Google Scholar]
- 55. Nash SH, Kristal AR, Hopkins SE, Boyer BB, O'Brien DM. Stable isotope models of sugar intake using hair, red blood cells, and plasma, but not fasting plasma glucose, predict sugar intake in a Yup'ik study population. J Nutr. 2014;144(1):75–80. [DOI] [PMC free article] [PubMed] [Google Scholar]
- 56. United States Department of Agriculture Economic Research Service Table 50-U.S. Per Capita Caloric Sweeteners Estimated Deliveries for Domestic Food and Beverage Use, by Calendar Year. Washington, DC: USDA ERS; 2019. [Google Scholar]
- 57. Nash SH, Kristal AR, Bersamin A, Hopkins SE, Boyer BB, O'Brien DM. Carbon and nitrogen stable isotope ratios predict intake of sweeteners in a Yup'ik study population. J Nutr. 2013;143(2):161–5. [DOI] [PMC free article] [PubMed] [Google Scholar]
- 58. Lefèbvre PJ, Scheen AJ. Glucose metabolism and the postprandial state. Eur J Clin Invest. 1999;29(S2):1–6. [DOI] [PubMed] [Google Scholar]
- 59. Pinnick KE, Hodson L. Challenging metabolic tissues with fructose: tissue-specific and sex-specific responses. J Physiol. 2019;597(14):3527–37. [DOI] [PubMed] [Google Scholar]
- 60. Adeva-Andany MM, Pérez-Felpete N, Fernández-Fernández C, Donapetry-García C, Pazos-García C. Liver glucose metabolism in humans. Biosci Rep. 2016;36(6):e00416. [DOI] [PMC free article] [PubMed] [Google Scholar]