

ABSTRACT
The use of postprandial triglyceride (ppTG) as a cardiovascular disease risk indicator has gained recent popularity. However, the influence of different foods or food ingredients on the ppTG response has not been comprehensively characterized. A systematic literature review and meta-analysis was conducted to assess the effects of foods or food ingredients on the ppTG response. PubMed, MEDLINE, Cochrane, and CINAHL databases were searched for relevant acute (<24-h) randomized controlled trials published up to September 2018. Based on our selection criteria, 179 relevant trials (366 comparisons) were identified and systematically compiled into distinct food or food ingredient categories. A ppTG-lowering effect was noted for soluble fiber (Hedges' giAUC = −0.72; 95% CI: −1.33, −0.11), sodium bicarbonate mineral water (Hedges' gAUC = −0.42; 95% CI: −0.79, −0.04), diacylglycerol oil (Hedges' giAUC = −0.38; 95% CI: −0.75, −0.00), and whey protein when it was contrasted with other proteins. The fats group showed significant but opposite effects depending on the outcome measure used (Hedges' giAUC = −0.32; 95% CI: −0.61, −0.03; and Hedges' gAUC = 0.16; 95% CI: 0.06, 0.26). Data for other important food groups (nuts, vegetables, and polyphenols) were also assessed but of limited availability. Assessing for oral fat tolerance test (OFTT) recommendation compliance, most trials were ≥4 h long but lacked a sufficiently high fat challenge. iAUC and AUC were more common measures of ppTG. Overall, our analyses indicate that the effects on ppTG by different food groups are diverse, largely influenced by the type of food or food ingredient within the same group. The type of ppTG measurement can also influence the response.
Keywords: postprandial, triglyceride, triglyceridemia, lipemia, food, ingredient, oral fat tolerance test recommendation
This study assesses the effects of different food or food ingredients on post-prandial triglyceride (ppTG) response through a systematic review and meta-analysis.
Introduction
Postprandial triglyceride (ppTG) refers to the rise in circulating blood triglyceride (TG) after the consumption of a meal (1). The concept was first brought to extensive research attention by Zilversmit (2) back in 1979, when ppTG as well as postprandial TG-rich lipoproteins were deemed as risk factors for the development of atherosclerosis. Early focus drew attention to the link between postprandial lipemia and cardiovascular disease (CVD) risk (3, 4), with subsequent large prospective epidemiological studies establishing a firm association between ppTG and several cardiovascular events, including ischemic stroke, ischemic heart disease, myocardial infarction, and CVD mortality (5–7). Several reviews have called for the use of ppTG as a new measure of CVD risk (8–11). ppTG has also been incorporated into several countries’ clinical guidelines given their potential association with the incidence of CVD (12). Conventionally, fasting TG concentrations are measured to assess CVD risk because these are less variable than nonfasting concentrations. However, given that most individuals are predominantly in a fed state (∼18 h) throughout the day, ppTG would be equally important, or an even better indicator of an individual's daily TG, which can inherently correlate more closely with CVD risk (13).
Hence, being in a constant fed state brings in the relevance of clinically monitoring the effect of various foods, ingredients, or meal consumption on ppTG responses, enabling the use of dietary choices as a method of modulating ppTG. The different types, compositions, and structures of food can influence the quantity and rate of release of dietary lipids (1) and subsequently affect ppTG responses (14). In relation to this, there has been interest in observing the changes in the ppTG response in acute clinical trials following the consumption of various foods or food ingredients (15–17). However, the effects on ppTG of similar foods or food ingredients tend to be relatively inconsistent, as in the case of fructose (18, 19) or PUFAs (20, 21). Inconsistencies have also been noted in recent reviews (1, 22), attributing the differences in the conclusions to study design factors such as test meal fat composition, population, and trial duration, as well as the dynamic nature of ppTGs under different clinical trial settings (23). There have been calls for standardization of ppTG trials through a standardized oral fat tolerance test (OFTT) (24) with 75 g test fat (25) and observation of peak concentration at the 4-h time point (9). Other recommendations include the use of incremental area under the curve (iAUC) compared with AUC because it is more reflective of ppTG (26) despite a lower reproducibility compared with AUC (27). However, the lack of standardization of measurement of the ppTG response and a standardized control test meal composition is still evident, making comparisons across different studies a huge challenge.
With the current concerns and trends in mind, it is of value to systematically review and meta-analyze the effects of different foods or food ingredients on ppTG responses in randomized controlled trials (RCTs). Our work also aimed to examine the study designs of selected RCTs and summarize their compliance with the current recommendations for ppTG measurements.
Methods
The reporting for this systematic review was conducted following the Preferred Reporting Items for Systematic Reviews and Meta-Analyses (PRISMA) guidelines (28). The PICOS (population, intervention, comparison, outcome, setting) statement used in this study is presented in Supplemental Table 1.
Search strategy
The databases of PubMed, CINAHL Plus, ProQuest MEDLINE, and the Cochrane Library were searched and assessed up to September 28, 2018, with the following search terms or MeSH terms: (("postprandial period”) OR (postprandial) OR (post-prandial)) AND ((“triglycerides/blood*” OR (triglyceride*) OR (hypertriglyceridemia) OR (hypertriglyceridemia)). Limitations used included human, adult(s) (aged ≥19 y), and English language, with the searches focused on title and abstract only. For the PubMed database, an additional RCT filter derived from the Cochrane Handbook was used. Relevant trials were selected based on a comprehensive list of inclusion criteria, mainly: 1) acute RCT; 2) intervention only involving the use of foods or food ingredients with no other treatment; 3) adults aged ≥19 y; 4) outcome of interest includes ppTG measured in plasma, serum, chylomicron (CM), or VLDL and expressed as iAUC, AUC, peak concentration (Cmax), peak time (tmax), or concentration at each time point measured.
The relevant titles and abstracts obtained based on the inclusion criteria and search terms were screened independently by both the primary (DPSL) and secondary (JHML) reviewers to reduce selection bias. The narrowed selection after the initial screening was reviewed for its full text for data extraction by both reviewers independently. Any disagreements between authors were resolved by consensus with a third reviewer (JEK). The search strategy is summarized in Figure 1, with the trials subsequently exported to EndNote X8 (Clarivate Analytics) for compilation.
FIGURE 1.
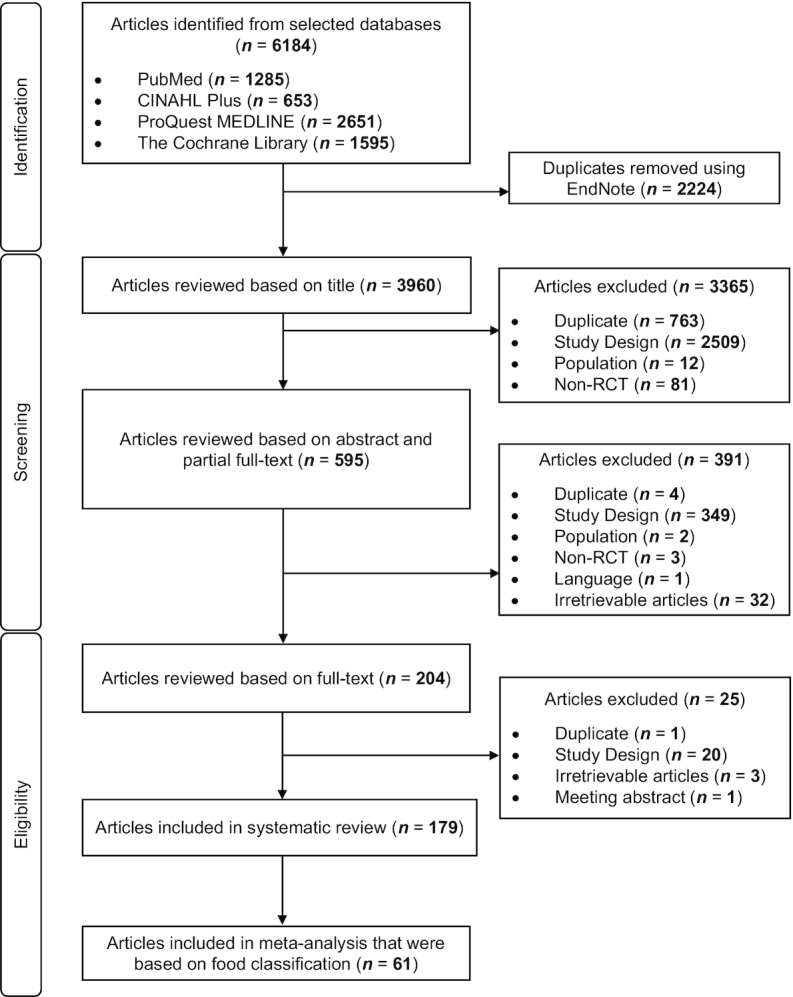
Flow diagram of the systematic review and meta-analysis of postprandial triglycerides. RCT, randomized controlled trial.
Data extraction and risk assessment
The full texts of the narrowed selections were independently extracted by DPSL and JHML for the following study characteristics and results: intervention food or food ingredient, control food or food ingredient, quantity, macronutrient composition of food challenge, population, acute trial duration, overall ppTG effect, measure of ppTG concentration (iAUC or AUC or Cmax or tmax or concentration at each time point measured), and trial title/author. The food or food ingredients were further categorized into the following categories for the systematic review: 1) sugars; 2) artificial sweeteners; 3) oligosaccharides; 4) carbohydrate-based food; 5) fiber-rich food or ingredients; 6) fats; 7) polyphenols; 8) proteins, peptides, or amino acids; 9) dairy products; 10) chocolate; 11) nuts or legumes; 12) alcohol; 13) vegetables or fruits or juices; 14) cholesterol-rich food; 15) minerals; 16) bicarbonate water; 17) food additives (emulsifiers, stabilizers, or encapsulations); and 18) commercial products. Meta-analysis was carried out for trials with available iAUC or AUC or Cmax change values, with the analysis conducted within each food or food ingredient category and type of TG measure. The food or food ingredients categories include: 1) sugars, 2) oligosaccharides, 3) fiber-rich food or ingredients, 4) fats, 5) polyphenols, 6) proteins, 7) peptides, 8) dairy products, 9) nuts, 10) legumes, 11) alcohol, 12) vegetables, 13) fruit juices, 14) cholesterol-rich food, and 15) bicarbonate water. Corresponding authors were contacted if the outcome of interest was not explicitly shown in the trial or when clarification was required.
The Cochrane Collaboration modified tool for assessing risk of bias for RCTs was used to determine the quality of the studies selected. A judgment level (high, low, or unclear) was assigned to each trial to determine any prevalence of selection bias (random sequence generation, allocation concealment), reporting bias (selective reporting), performance bias (blinding of participants and investigator), detection bias (blinding of outcome assessor), attrition bias (incomplete outcome data), and other sources of bias (29).
Calculation and statistical analysis
All values were calculated and presented in terms of mean ± SD. Hedges' g was obtained for iAUC and AUC values due to the limited sample size available within each food or food ingredient category. Standardized mean difference (SMD) was determined for the Cmax change values (difference between post- and pre-intervention) between intervention and control group and used for the pool effect determination.
Data were analyzed using STATA (Version 13; StataCorp LLC) for the meta-analysis, which was conducted for each food or food ingredient category and for each type of ppTG measurement (iAUC, AUC, or Cmax change value only). The metan function was used for the determination of pooled outcome effects. A random-effects model was used given the research question's broad inclusion criteria. Positive effect sizes were indicative of a ppTG-raising effect whereas negative values indicated a ppTG-lowering effect.
Crossover trials were regarded and analyzed as parallel. Although this can introduce some unit-of-analysis error, the error is conservative and only results in minimal underweighting of the comparisons (30). For multiple comparisons within the same study, results were presented as several comparisons with the overlapping of control group data. Splitting of the control group across the different comparisons was conducted to determine the extent of unit-of-analysis error and validate its effect through sensitivity test.
Heterogeneity was quantified by the I2 statistic, which was derived from the χ2 statistic, with a value >50% indicative of substantial heterogeneity (31). Publication bias was determined using metafunnel and metabias function and the Egger test. Sensitivity analysis was conducted to determine the robustness of the results by omitting single sets of study comparisons before running the meta-analysis again.
Subgroup analysis based on the trial population and type of food or food ingredients within the category was further conducted for studies with available data. Trial population referred to the type of subject population, defined as healthy individuals and individuals with metabolic impairment. The latter refers to trials where subjects were overweight, obese, had mild hypertriglyceridemia, metabolic syndrome, insulin resistance, type 2 diabetes, or other metabolic impairment.
Results
Search results
As seen in Figure 1, an initial 6184 trials were obtained from the search of 4 databases, with 3960 trials left after the removal of duplicates. Subsequently, 3365 trials were excluded after reviewing their titles, due to 3 main reasons: 1) the study was not an RCT or was a duplicate; 2) the study population was not humans or adults; or 3) the study design did not fall in line with the PICOS statement. This left 595 trials for review of abstract, of which 391 trials were either ineligible based on inclusion criteria or irretrievable. Of 204 trials that were identified for full-text review, a further 25 were excluded due to reasons such as duplicate, irretrievable articles, meeting abstract, or study designs that did not align with our study focus and inclusion criteria. Data extraction was conducted with the remaining 179 relevant trials.
Qualitative systematic review and study characteristics
From the 179 trials that were shortlisted, 366 trial comparisons were obtained and included for the systematic review and classified into various food or food ingredient categories; their qualitative impact on ppTG response is summarized in Supplemental Table 2. Although many comparisons did not observe significant changes to ppTG, some food or food ingredient comparisons showed a greater tendency toward a ppTG-raising or -lowering effect. A ppTG-raising effect was noted for specific foods or food ingredients, such as fructose (9 trials with 12 comparisons, 8 comparisons with a ppTG-raising effect), trans-unsaturated fatty acids (4 trials with 5 comparisons, 4 comparisons with a ppTG-raising effect), and alcohol category (9 trials with 12 comparisons, 10 comparisons with a ppTG-raising effect). However, a ppTG-lowering effect was generally noted for the fiber-rich food or food ingredient category (16 trials with 36 comparisons, 15 comparisons with a ppTG-lowering effect), as well as specific foods or food ingredients such as diacylglycerol (DAG) oil (8 trials with 17 comparisons, 13 comparisons with a ppTG-lowering effect), catechin or epicatechin (3 trials with 6 comparisons, 4 comparisons with a ppTG-lowering effect), dietary calcium (2 trials with 3 comparisons, 2 comparisons with a ppTG-lowering effect), and sodium bicarbonate mineral water (2 trials with 3 comparisons, 2 comparisons with a ppTG-lowering effect).
Each intervention food or food ingredient was separated according to their effect on ppTG and their general characteristics were systematically summarized into 3 categories: 1) intervention food or food ingredients with ≥1 significant ppTG-lowering effect (Supplemental Table 3); 2) intervention food or food ingredients with ≥1 significant ppTG-raising effect and no cases of a significant ppTG-lowering effect (Supplemental Table 4); and 3) no significant effect on ppTG response compared with control (Supplemental Table 5). Trial duration ranged from 105 min to 24 h, with most trials lasting for 6–8 h. Most studies measured ppTG in the form of plasma or serum TG and reported either iAUC or AUC data.
Fat content of the meals in all the trials ranged from 7.8 g to 100 g. In general, control groups consumed water, a placebo, or a low dose of the food or food ingredient of interest. Exceptions for the control group were present for the fats; proteins or peptides or amino acids; and sugars and artificial sweeteners categories. In the fats category, control meals were generally standardized as saturated fatty acids (SFAs), except for trials that evaluated the effect of MUFAs or PUFAs compared with different types of MUFA. Proteins or amino acids category controls were standardized as whey protein or isolate. Sugars and artificial sweeteners categories had glucose or bread as controls.
Risk-of-bias assessment of shortlisted trials
The bias assessment using the modified Cochrane tool can be found in Supplemental Table 6. Selection bias (random sequence allocation and allocation concealment) was marked “low” for about one-third of the trials, whereas most were labeled under the “unclear” category due to the lack of explicit mention of how the randomization or concealment was conducted. Selective reporting and other sources of bias were marked “unclear” for most trials, though some trials were clear in their presentation and hence necessitated a “low” rating. Selective reporting was marked “high” for Ezenwaka and Kalloo (32). Performance bias and detection bias was marked “unclear” for most trials, with some labeled as “low” because explicit mention of the respective blinding was evident. Performance bias was marked “high” for Yokomichi et al. (33), Huebbe et al. (34), Tan et al. (35, 36), and McCrea et al. (37). This was due to the inevitable nature of the food of interest being hard to blind toward participants, hence resulting in only single blinding. Blinding of assessors was marked as “high” for Ferreira et al. (38). Attrition bias was deemed “low” for most trials, with some labeled “unclear” due to lack of more explicit stating. None of the trials that were labeled “high” in any of the categories were used for the meta-analysis.
Meta-analysis on food or food ingredient categories
For the subsequent meta-analysis, only trials with available iAUC, AUC, or Cmax change values were used. As a result, 61 of 179 trials were selected, with a total of 124 comparisons used for analysis. In some food or food ingredient categories, although there was only 1 trial in the category, there were multiple comparisons conducted in the trial and hence the meta-analysis was still conducted with these comparisons.
Sugars
A total of 3 trials (6 comparisons) were considered for this analysis, with the food of interest being fructose, maltodextrin, and glucose (39–41). The overall pooled Hedges' g values were 0.78 (95% CI: −0.39, 1.95) with I2 = 26.9% for iAUC (3 comparisons) (Supplemental Figure 1) (39, 40) and 0.19 (95% CI: −0.14, 0.52) with I2 = 0.0% for AUC (3 comparisons) (Supplemental Figure 2) (41). The overall pooled SMD was 0.02 (95% CI: −0.37, 0.41) with I2 = 0.0% for Cmax change values (3 comparisons) (41) (Supplemental Figure 3). No change in outcome was observed through sensitivity testing, except for iAUC where Fisher-Wellman and Bloomer (40) was excluded, with the resultant overall pooled Hedges' g value of 1.52 (95% CI: 0.03, 3.01) with I2 = 0.0%.
Oligosaccharides
Only 1 trial (2 comparisons) was included for this analysis (42), with the overall pooled Hedges' g value being −0.16 (95% CI: −0.52, 0.20) with I2 = 0.0% for iAUC (Supplemental Figure 4).
Fiber-rich food or food ingredients
In this analysis, 8 trials (14 comparisons) were considered (16, 43–49) and, as seen in Supplemental Figure 5, the overall pooled Hedges' g value for iAUC was −0.28 (95% CI: −0.66, 0.11) and I2 = 0.0% (12 comparisons) (16, 43–47). Hedges' g value was 0.00 (95% CI: −0.04, 0.05) with I2 = 46.7% for AUC (4 comparisons) (Supplemental Figure 6) (16, 48, 49), and the overall pooled SMD was −0.20 (95% CI: −0.54, 0.15) with I2 = 0.0% for Cmax change values (3 comparisons) (16, 46) (Supplemental Figure 7).
Fats
Analysis included 24 trials (49 comparisons) and the effect sizes were of opposing outcomes for iAUC compared with AUC data, with strong presence of heterogeneity in both (21, 50–72). Overall pooled Hedges' g value was −0.32 (95% CI: −0.61, −0.03) with I2 = 61.2% for iAUC (36 comparisons) (Supplemental Figure 8) (21, 50–65), indicative of a significant ppTG-lowering effect, whereas the Hedges' g value reflected 0.16 (95% CI: 0.06, 0.26) with I2 = 35.8% for AUC (18 comparisons) (Supplemental Figure 9) (54, 59, 61, 66–71), indicative of a significant ppTG-raising effect. The overall pooled SMD was −0.23 (95% CI: −0.58, 0.12) with I2 = 0.0% for Cmax change values (7 comparisons) (Supplemental Figure 10) (21, 58, 72). When Lopez et al. (57) was excluded for iAUC, heterogeneity decreased to I2 = 44.1%, with Hedges' g = −0.25 (95% CI: −0.49, −0.00).
Polyphenols
This analysis involved 3 trials (5 comparisons), inclusive of tea catechin, wine polyphenols, and polyphenols from curry spices, with the overall pooled Hedges' g value of −0.58 (95% CI: −1.52, 0.36) with I2 = 36.9% for iAUC (Supplemental Figure 11) (73–75).
Proteins
Six trials (15 comparisons) were considered for this analysis to give an overall pooled Hedges' g value of 0.30 (95% CI: −0.12, 0.73) with I2 = 57.9% for iAUC (15 comparisons) (Supplemental Figure 12) (17, 42, 76–79). Sensitivity testing attributed the high heterogeneity to the findings of Pal et al. (76) due to differences in the control meal for this study (glucose) compared with the others (whey protein or isolate). When the analysis was conducted with the exclusion of this study, the overall pooled Hedges' g value was 0.50 (95% CI: 0.11, 0.88) with I2 = 29.8% for iAUC (13 comparisons) (Supplemental Figure 13).
Peptides
Only 1 trial (3 comparisons), which focused on the consumption of globin digest, was included. The overall pooled Hedges' g value was −0.47 (95% CI: −1.28, 0.34) with I2 = 0.0% for AUC (Supplemental Figure 14) (80).
Dairy products
This analysis involved 5 trials (7 comparisons) (81–85), with the overall pooled Hedges' g value being 0.22 (95% CI: −0.24, 0.67) with I2 = 0.0% for iAUC (7 comparisons) (Supplemental Figure 15) (81–85), whereas the overall pooled SMD was 0.19 (95% CI: −0.23, 0.60) with I2 = 0.0% for Cmax (2 comparisons) (Supplemental Figure 16) (83, 85).
Nuts
Only 1 trial (2 comparisons) on almonds compared with sunflower oil was involved, with the overall pooled Hedges' g value being −0.22 (95% CI: −1.84, 1.41), albeit with a high heterogeneity of I2 = 92.2% for iAUC (Supplemental Figure 17) (86).
Legumes
Two trials (5 comparisons) were involved in this analysis, with the overall pooled Hedges' g value being −0.73 (95% CI: −1.46, 0.01) with I2 = 35.0% for AUC (Supplemental Figure 18) (87, 88).
Alcohol
The analysis included 5 trials (6 comparisons), with food items of vodka or red wine (73, 89–92). The overall pooled Hedges' g value was 0.30 (95% CI: −0.10, 0.71) with I2 = 82.2% for iAUC (6 comparisons) (Supplemental Figure 19) (73, 89–92,) and 2.61 (95% CI: −1.16, 6.38) with I2 = 73.2% for AUC (2 comparisons) (Supplemental Figure 20) (89, 92).
Vegetables
Only 1 trial (2 comparisons) on spinach consumption was involved, with the overall pooled Hedges' g value being −0.09 (95% CI: −1.14, 0.97) with I2 = 14.3% for iAUC (Supplemental Figure 21) (93).
Fruits or juices
A single trial (3 comparisons) on orange or orange juice consumption was involved, with the overall pooled SMD of −0.16 (95% CI: −0.43, 0.10) with I2 = 0.0% for Cmax change values (Supplemental Figure 22) (94).
Cholesterol-rich food
This analysis involved 1 trial (3 comparisons) evaluating egg yolk consumption, with the overall pooled Hedges' g value of 0.42 (95% CI: −0.39, 1.22) with I2 = 0.0% for iAUC (Supplemental Figure 23) (95).
Bicarbonate water
This analysis involved 1 trial (2 comparisons) assessing sodium bicarbonate mineral water, with the overall pooled Hedges' g value of −0.42 (95% CI: −0.79, −0.04) with I2 = 0.0% for AUC (Supplemental Figure 24) (96).
Subgroup analysis on selected food categories
Subgroup analysis was conducted for fiber-rich foods or food ingredients and fats categories given the clear type distinctions within these 2 categories (the distinctions were less clear in the other food or food ingredient categories).
The fiber-rich food or food ingredient category (iAUC) was subgrouped based on type (Figure 2) and trial population (Supplemental Figure 25). As seen in Figure 2, subgroup analysis on type showed a significant ppTG-lowering effect from soluble fiber (Hedges' g = −0.72; 95% CI: −1.33, −0.11; I2 = 0.0%) but not insoluble fiber (Hedges' g = 0.02; 95% CI: −0.48, 0.52; I2 = 0.0%). Population subgroup analysis showed no significant difference for the healthy (Hedges' g = −0.26; 95% CI: −0.77, 0.26; I2 = 0.0%) and metabolically impaired (Hedges' g = −0.36; 95% CI: −1.09, 0.38; I2 = 30.4%) categories.
FIGURE 2.

Forest plot of subgroup analysis on type for fiber-rich food or food ingredient category (iAUC). A significant ppTG-lowering effect was noted for soluble fiber (Hedges' g = −0.72; 95% CI: −1.33, −0.11; I2 = 0.0%) whereas no significant difference in ppTG response was noted for insoluble fiber (Hedges' g = 0.02; 95% CI: −0.48, 0.52; I2 = 0.0%). The whiskers on either side of the data points represent the 95% CIs, grey box indicate the % weight of the comparison and the red dashed line indicate the mid-point of the overall effect size diamond. Cmax, peak concentration; F, female; iAUC, incremental area under the curve; M, male; ppTG, postprandial triglyceride; TG, triglyceride.
Type and population subgroup analysis was also conducted for the fats group for iAUC (Figure 3, Supplemental Figure 26, respectively) and AUC (Figure 4, Supplemental Figure 27, respectively). Subgroup analysis on type in Figure 3 showed a significant lowering effect for DAG oil [Hedges' g for iAUC (Hedges' giAUC) = −0.38; 95% CI: −0.75, −0.00; I2 = 0.0%]. Other types of fats involved yielded no distinct effect on the ppTG response. For AUC, subgroup analysis based on type noted no significant effect on the ppTG response compared with SFAs except for MUFAs, which had a significant ppTG-increasing effect [Hedges' g for AUC (Hedges' gAUC) = 0.29; 95% CI: 0.03, 0.55; I2 = 51.9%]. Subgroup analysis on population for iAUC showed a significant ppTG-lowering effect for the individuals with metabolic impairment (Hedges' giAUC = −1.25; 95% CI: −1.92, −0.58; I2 = 73.6%) but high heterogeneity. Healthy populations showed no significant difference in ppTG response (Hedges' giAUC = −0.03; 95% CI: −0.23, 0.17; I2 = 1.1%). For AUC, a significant ppTG-raising effect was noted for the healthy individuals (Hedges' gAUC = 0.16; 95% CI: 0.05, 0.27; I2 = 51.4%), whereas the individuals with metabolic impairment had no significant difference in the ppTG response when compared with the respective control meal (Hedges' gAUC = 0.18; 95% CI: −0.23, 0.59; I2 = 0.0%).
FIGURE 3.

Forest plot of subgroup analysis on type for fats food category (iAUC). A significant ppTG-lowering effect was noted for DAG oil (Hedges' g = −0.38; 95% CI: −0.75, −0.00; I2 = 0.0%). No significant effect was noted for interesterified oil (Hedges' g = 0.59; 95% CI: −1.40, 2.59; I2 = 81.5%), MCT (Hedges' g = −0.55; 95% CI: −1.65, 0.54; I2 = 45.5%), MUFA (Hedges' g = −0.39; 95% CI: −1.50, 0.73; I2 = 86.6%), PUFA (Hedges' g = −0.23; 95% CI: −0.54, 0.08; I2 = 0.0%), and MUFA + PUFA categories (Hedges' g = −0.84; 95% CI: −2.32, 0.64; I2 = 80.7%). SFA and TUFA only had 1 comparison per category. The whiskers on either side of the data points represent the 95% CIs, grey box indicate the % weight of the comparison and the red dashed line indicate the mid-point of the overall effect size diamond. aLNA, α-linolenic acid; DAG, diacylglycerol; F, female; iAUC, incremental area under the curve; LA, linoleic acid; LC, long-chain; M, male; MCT, medium-chain triglyceride; MetS, metabolic syndrome; ppTG, postprandial triglyceride; SFA, saturated fatty acid; TG, triglyceride; TUFA, trans-unsaturated fatty acid.
FIGURE 4.

Forest plot of subgroup analysis on type for fats food category (AUC). A significant ppTG-raising effect was noted for MUFA (Hedges' g = 0.29; 95% CI: 0.03, 0.55; I2 = 51.9%). No significant effect was noted for PUFA (Hedges' g = 0.09; 95% CI: −0.01, 0.18; I2 = 0.0%), SFA (Hedges' g = 0.07; 95% CI: −0.69, 0.82; I2 = 31.2%), TUFA (Hedges' g = 0.08; 95% CI: −0.35, 0.52; I2 = 18.8%), and MUFA + PUFA categories (Hedges' g = 0.20; 95% CI: −0.36, 0.75; I2 = 0.0%). The whiskers on either side of the data points represent the 95% CIs, grey box indicate the % weight of the comparison and the red dashed line indicate the mid-point of the overall effect size diamond. Interesterified oil and MCT only had 1 comparison per category. ALA, α-linolenic acid; F, female; M, male; MCT, medium-chain triglyceride; ppTG, postprandial triglyceride; SFA, saturated fatty acid; TUFA, trans-unsaturated fatty acid.
Risk of publication bias
Funnel plot and Egger test combination showed low publication bias for all categories except for the category of alcohol (iAUC) and cholesterol (AUC) (Supplemental Figures 28–31).
Compliance with current ppTG recommendations
The trials used in the meta-analysis were evaluated for their compliance with the OFTT recommendations by Kolovou et al. (24) (Table 1). Most trials (∼93% of total trials) had a ppTG trial period of ≥4 h. Only 18% used a fat meal of ≥75g. For ppTG measurements, most trials used iAUC (44 of 61 trials), followed by AUC (21 of 61 trials), then Cmax (15 of 61 trials).
TABLE 1.
Summary of study characteristics of 61 trials from meta-analysis organized according to the recommendations established by Kolovou et al. (24)1
| Duration | Mass of fats in test meal | Circulating TG metric | |||||||
|---|---|---|---|---|---|---|---|---|---|
| Category | No. of studies | <4 h | ≥4 h | <75 g | ≥75 g | Unknown | iAUC | AUC | C max |
| Sugar | 3 | 0 | 3 | 1 | 1 | 1 | 2 | 1 | 1 |
| Oligosaccharide2 | 1 | 0 | 1 | 0 | 1 | 0 | 1 | 0 | 0 |
| Fiber or fiber-rich food ingredients | 8 | 3 | 5 | 7 | 0 | 1 | 6 | 3 | 2 |
| Fats | 24 | 1 | 23 | 20 | 2 | 2 | 16 | 10 | 8 |
| Polyphenols3 | 3 | 0 | 3 | 3 | 0 | 0 | 3 | 0 | 0 |
| Proteins2 | 6 | 0 | 6 | 2 | 3 | 1 | 6 | 0 | 0 |
| Peptides | 1 | 0 | 1 | 1 | 0 | 0 | 0 | 1 | 0 |
| Dairy products | 5 | 0 | 5 | 4 | 1 | 0 | 5 | 0 | 2 |
| Nuts | 1 | 0 | 1 | 1 | 0 | 0 | 1 | 0 | 0 |
| Legumes | 2 | 0 | 2 | 1 | 0 | 1 | 0 | 2 | 0 |
| Alcohol3 | 5 | 0 | 5 | 3 | 2 | 0 | 5 | 2 | 0 |
| Vegetables | 1 | 0 | 1 | 1 | 0 | 0 | 1 | 0 | 0 |
| Fruits or juices | 1 | 0 | 1 | 1 | 0 | 0 | 0 | 0 | 1 |
| Cholesterol | 1 | 0 | 1 | 1 | 0 | 0 | 0 | 1 | 0 |
| Bicarbonate water | 1 | 0 | 1 | 0 | 1 | 0 | 0 | 1 | 1 |
Discussion
ppTG is increasingly being recognized as a relevant marker of CVD risk. Although many studies have assessed the ppTG effect of various foods or food ingredients, this information has yet to be systematically summarized. This systematic review and meta-analysis of the various food and food ingredient categories illustrates the specific effects that foods and food ingredients have on ppTG responses. The heterogeneous nature of different foods and food ingredients makes it challenging to distinctly categorize them for best overall interpretation of each meta-analysis. Hence, we conducted subgroup analysis for categories wherever possible to best account for vast differences within the same food category. In particular after subgroup analysis, soluble fiber and DAG oil were shown to have a ppTG-lowering effect. Subgroup assessment according to population type showed that populations with metabolic impairment exhibited a significant ppTG-lowering effect for fats (iAUC) whereas this was not observed in healthy populations. Our subsequent paragraphs are focused on the primary trends observed in our meta-analysis, potential mechanisms, accordance with recommendations, and strengths and limitations.
Within the sugars category, although no significant overall effect on ppTG response was noted, further sensitivity analysis observed a ppTG-raising effect attributed to fructose. This was consistent with our systematic review, where we noted a potential ppTG-raising effect of fructose. One potential mechanism of action by fructose has been attributed to the reduced stimulation of insulin secretion by fructose compared with glucose, and consequent reduced lipoprotein lipase (LPL) activity in adipose tissue (97, 98). As a result, lipolysis of TGs in CMs and VLDLs is delayed, resulting in a prolonged TG presence in the blood and hence elevated concentrations postprandially (97, 98). Lower insulin secretion has also been shown to acutely increase lipolysis in adipose tissue and delivery of free fatty acids (FFAs) from adipose tissue to the liver (99, 100). Additionally, fructose consumption has also been associated with hepatic de novo lipogenesis, which increases large VLDL-TGs (97, 101). Fructose is a preferred substrate for lipogenesis over glucose, hence accounting for the greater ppTG-raising effect compared with glucose (101). Two other systematic reviews/meta-analyses have been conducted for fructose: one review assessed only isocaloric trials whereas the other assessed both hypercaloric and isocaloric trials (102, 103). Both reviews noted borderline significance for a ppTG-raising effect, although ppTG was significantly raised in a hypercaloric trial based on 1 of the reviews (102, 103). It is important to note that in both reviews, data were interpreted as Cmax SMD, differing from our use of iAUC or AUC Hedges' g, and this could explain the discrepancy in ppTG response.
Subgroup analysis noted a ppTG-lowering effect from soluble fiber consumption (iAUC). The distinct ppTG-lowering effect from soluble fiber has been attributed strongly to its viscous property, which slows gastric emptying and the disruption of fat emulsification and micelle formation in the gastrointestinal tract via reductions in circulating bile acid availability (16, 46, 104–106). Additionally, soluble fiber can be fermented by the gut microbiota to release metabolites (butyrate, acetate, propionate, isobutyrate), which upregulate genes [peroxisome proliferator–activated receptor-α (PPARα) and PPAR-γ coactivator-1α (PGC-1α)] involved in lipid metabolism and the regulation of ppTG (107). Although insoluble fiber has been said to be a physical barrier to lipid digestion and might also improve insulin sensitivity which in turn regulates lipid metabolism (108), it showed no effect on ppTG response in our study. Similar observations were made in a long-term fiber intervention study for ppTG and a cross-sectional study for plasma TGs (109, 110). In general, insoluble fiber yields a lower degree of TG reduction than soluble fiber. Although the mechanism for the difference is relatively unexplored, it is potentially due to the poorer water solubility and fermentability of insoluble fiber compared with soluble fiber (111).
In the analysis of the fats category (iAUC), which was contrasted against SFAs, all other fats exhibited a relative ppTG-lowering effect, indicative of a ppTG-raising effect due to SFA consumption. However, an opposite ppTG response was observed for AUC. This discrepancy could be due to the choice of TG measure, whereby a strong correlation was established between iAUC and ppTG, on the one hand, and between AUC and fasting TG on the other hand (26). When subgrouped based on population, the metabolically impaired population had a significant ppTG-lowering effect whereas the healthy population had no change in ppTG relative to the control (SFA). In general, the beneficial effect of an intervention food item is more pronounced in metabolically impaired individuals (112). Factors such as insulin resistance or hypertriglyceridemia might be responsible for the exaggerated responses in these individuals compared with the healthy population (26, 113, 114).
When subgrouped based on the type of fats, no significant effect on ppTG response was noted except for DAG oil, which had a ppTG-lowering effect. Several mechanisms might be involved. A previous animal study found that DAG oil in the small intestinal epithelium has a lower rate of TG resynthesis than triacylglycerol (TAG) oil as a result of its lower substrate affinity to DAG acyltransferase, the main enzyme for TG synthesis (115). Additionally, DAG oil has a lower occurrence of re-esterification after absorption when compared with TAG oil due to a lower supply of 2-monoacylglycerol (2-MAG) generated in the small intestine, and hence it re-esterifies via the slower glycerol-3-phosphate pathway instead of the 2-MAG pathway, causing slower TG secretion to the lymph and blood (116). Consumption of DAG oil can stimulate a lower rate of glucose-dependent insulinotropic polypeptide (GIP) secretion; GIP subsequently reduces the stimulation of insulin secretion, resulting in reduced CM formation and ppTG response (117). However, despite the promises of DAG oil, it is crucial to note that the trials involved were mostly conducted in the Japanese population and the findings would be more robust if validated in other populations.
The comparative effects of different types of fats on ppTG in acute trial settings are diverse. It has been noted that SFA consumption has a tendency for slower absorption of TGs compared with MUFAs or PUFAs (15), and this might have accounted for the lower ppTG response compared to MUFAs in several articles (65, 69, 118). However, contrasting results showed no ppTG response or raising effect compared with SFA in other SFA/MUFA trials (64, 70), making it difficult to fully comprehend their comparative effects on ppTG. This was additionally accentuated in our study by the different ppTG response outcomes obtained based on the type of circulating TG metric selected.
Although not statistically significant, PUFAs had a ppTG-lowering response (iAUC). In a separate meta-analysis of fatty acid type on ppTG response, PUFAs exhibited a significant ppTG-lowering effect in acute trials with a trial duration >8 h, but this was not statistically significant for trial durations of >4 h (119). This is consistent with our own findings. Another recent review also noted no acute ppTG effect of PUFA consumption but a distinct lowering effect in longer-term trials, indicating that time could be crucial for the effect of different fats to be distinguished (22). The potential mechanisms explaining the ppTG-lowering effect from PUFAs involve reduced hepatic lipogenesis, greater fatty acid oxidation in the liver, and greater LPL expression in the adipose tissue (120). In addition, PUFA consumption can result in accelerated clearance of CMs via LPL-mediated lipolysis during the postprandial period (121, 122).
A significant ppTG-raising effect was noted when protein category comparisons were standardized against whey protein or whey protein isolate. This finding indicates that whey protein could have a potential ppTG-lowering effect unlike other proteins. Most of the trials were contrasted against casein, and one possible mechanism for the ppTG-lowering response of whey protein is a higher expression of LPL mRNA in the adipose tissue as a result of greater insulin stimulation compared with casein (123). The higher LPL activity subsequently contributed to upregulated CM clearance (17). In contrast, another trial showed that VLDL production was downregulated during whey protein consumption with CM concentration remaining constant, resulting in a lower TG:apoB-48 ratio which is an indicator of smaller CM size, making CM more susceptible to LPL activity and postprandial state clearance (76). Whey protein has a higher content of branched chain amino acids, which are not only insulinotropic, but also have a faster rate of digestion and absorption (76, 124). This stimulates insulin more readily, which in turn regulates subsequent lipid metabolism through LPL upregulation in adipose tissue.
Although we have not discussed all the food categories in depth, we have summarized the overall potential mechanism of a ppTG-lowering effect by the various foods or food ingredients in Figure 5; that of a ppTG-raising effect is summarized in Supplemental Figure 32.
FIGURE 5.

ppTG-lowering mechanism by various foods. CM, chylomicron; DAG, diacylglycerol; GIP, glucose-dependent insulinotropic polypeptide; GLP-1, glucagon-like peptide 1; LPL, lipoprotein lipase; MCT, medium-chain triglyceride; PGC-1α, peroxisome proliferator–activated receptor γ coactivator-1α; PPARα, peroxisome proliferator–activated receptor α; ppTG, postprandial triglyceride; SFA, saturated fatty acid; TG, triglyceride; TRL, triglyceride-rich lipoprotein.
With reference to OFTT recommendations established by Kolovou et al. (24), most trials included in the meta-analysis had a ppTG trial duration of ≥4 h (∼93% of total). It is crucial for trials to be ≥4 h long, given that ppTG reviews for OFTT design noted the greatest SMD differences in ppTG at the 4-h and 6-h time points (125). Additionally, trial duration can affect the ppTG response because certain foods or food ingredients might require a longer observation period for clear differentiation, as in the case of fatty acid types (119). Assessment of fat content in the test meal showed that only 18% of trials met the recommendation of 75 g. The use of mixed meals in ppTG trials generally tend to be more representative of a habitual diet. However, for the purpose of measuring a ppTG effect, a sufficiently high amount of fat (i.e., 75 g) is recommended for explicit identification of any excess response to the fat load given that the highest SMD in ppTG was noted at this quantity for healthy individuals (125). The lack of sufficiently high fat in most of the trials could be a reason for the lack or discrepancy of a ppTG response in some of the trials. Unlike the recommendation to use Cmax as the preferred measure of ppTG, most trials used iAUC (∼72%) as ≥1 of the measurements of ppTG, and it is worth noting that iAUC provides a strong correlation with ppTG (26). Although Cmax might be a useful indicator of ppTG in trials with a large population size and for clinical testing, iAUC could be a better outcome metric of circulating TGs for research purposes (24). This is because different foods or food ingredients can peak at different times, such as when a food item is encapsulated (126, 127).
It is of paramount importance to recognize that the clinical settings mentioned by Kolovou et al. (24) are recommendations for conducting OFTT rather than official guidelines. Additionally, use of the OFTT is oriented more toward diagnosis as a marker for CVD rather than for nutritional research purposes. Moreover, other concerns related to conducting clinical trials can arise from the difficulty in providing 75 g fat in a meal without causing gastrointestinal discomfort. Therefore, further discussion of food-related ppTG research is needed so that trials are better customized to foods or food ingredients.
To the best of our knowledge, this is the first study to systematically review and meta-analyze the impact of a wide range of foods and food ingredients on the ppTG response in acute RCTs, and assess the compliance of RCTs with the current ppTG methodological recommendations. This could provide a more holistic and quantified viewpoint, which will be relevant for the structuring of future research, for the subsequent development of food products, as well as for the substantiation of health claims. Additionally, we conducted subgroup analyses based on food or food ingredient type and trial population and found distinct ppTG responses, with lowering effects being often more prominent for specific foods or food ingredients and in populations with metabolic impairment. Risk assessments, publication bias assessment, and sensitivity analysis were also conducted to validate the quality of the evidence selected for this review. For the meta-analysis, trials selected were not deemed “high” in the risk-of-bias analysis, with generally low publication bias except in the case of alcohol and cholesterol, hence, enhancing the quality of the meta-analysis.
However, several limitations are evident in this study. Primarily, although major food categories such as fats and fibers had a substantial number of trials available, many other food categories had limited data available. As a result, meta-analysis of some categories was based on a single trial, even though the trial included 2 or 3 comparisons. In those cases, findings should be interpreted with caution. In addition, many trials within the same food or food ingredient category had different study designs mainly in terms of trial duration, content of fat, and health status of included population, making it difficult to discern if the ppTG response was due to study design difference or to the intervention food or food ingredient itself. Moreover, the results of the current study only reflect acute effects; chronic effects might differ substantially (22).
Conclusion
In conclusion, our study suggests that different categories of foods or food ingredients yield differential ppTG responses and that the specific type of food within the same category, type of ppTG measure, or the trial population can matter. We noted distinct ppTG-lowering effects from the consumption of soluble dietary fiber and whey protein. Additionally, the overall ppTG effect can differ based on the circulating TG metric chosen, as seen in the case of using iAUC or AUC for fats. Importantly, different study designs for the same intervention food or food ingredient can result in divergent ppTG responses, and this emphasizes the important need for methodological standardization of ppTG trials.
Supplementary Material
ACKNOWLEDGEMENTS
Ng Tao Tao Magdeline, a librarian from the National University of Singapore, assisted with the literature search terms.
The authors responsibilities were as follows—DPSL, JRC, DZ, and JEK: contributed to the conceptualization and design of the systematic review and meta-analysis; DPSL and JHML: conducted the data extraction and analysis; DPSL, JRC, DZ, LA-G, and JEK: conducted the data interpretation; DPSL and JEK: drafted the manuscript and had primary responsibility for final content; and all authors: read and approved the final manuscript.
Notes
This study was funded by Société des Produits Nestlé SA (SPN).
Author disclosures: JRC, DZ, and LA-G are employees of Société des Produits Nestlé SA (SPN). All other authors report no conflicts of interest.
Supplemental Tables 1–6 and Supplemental Figures 1–32 are available from the “Supplementary data” link in the online posting of the article and from the same link in the online table of contents at https://academic.oup.com/advances/.
Abbreviations used: CM, chylomicron; Cmax, peak concentration; CVD, cardiovascular disease; DAG, diacylglycerol; FFA, free fatty acid; GIP, glucose-dependent insulinotropic polypeptide; Hedges' gAUC, Hedges' g value for AUC; Hedges' giAUC, Hedges' g value for iAUC;
iAUC, incremental area under curve; LPL, lipoprotein lipase; MAG, monoacylglycerol; OFTT, oral fat tolerance test; PGC-1α, peroxisome proliferator–activated receptor-γ coactivator-1α; PICOS, population, intervention, comparison, outcome, setting; PPAR, peroxisome proliferator–activated receptor; ppTG, postprandial triglyceride; RCT, randomized clinical trial; SMD, standardized mean difference; TAG, triacylglycerol; tmax, time of peak concentration.
Contributor Information
Delia Pei Shan Lee, Department of Food Science and Technology, National University of Singapore, Singapore.
Jasmine Hui Min Low, Department of Food Science and Technology, National University of Singapore, Singapore.
Jacklyn Ruilin Chen, Nestlé Research Singapore Hub, Singapore.
Diane Zimmermann, Nestlé Research, Lausanne, Switzerland.
Lucas Actis-Goretta, Nestlé Research Singapore Hub, Singapore; Nestlé Research, Lausanne, Switzerland.
Jung Eun Kim, Department of Food Science and Technology, National University of Singapore, Singapore.
References
- 1. Dias CB, Moughan PJ, Wood LG, Singh H, Garg ML. Postprandial lipemia: factoring in lipemic response for ranking foods for their healthiness. Lipids Health Dis. 2017;16(1):178. [DOI] [PMC free article] [PubMed] [Google Scholar]
- 2. Zilversmit DB. Atherogenesis: a postprandial phenomenon. Circulation. 1979;60(3):473–85. [DOI] [PubMed] [Google Scholar]
- 3. Lefebvre PJ, Scheen AJ. The postprandial state and risk of cardiovascular disease. Diabet Med. 1998;15(Suppl 4):S63–8. [DOI] [PubMed] [Google Scholar]
- 4. Hyson D, Rutledge JC, Berglund L. Postprandial lipemia and cardiovascular disease. Curr Atheroscler Rep. 2003;5(6):437–44. [DOI] [PubMed] [Google Scholar]
- 5. Bansal S, Buring JE, Rifai N, Mora S, Sacks FM, Ridker PM. Fasting compared with nonfasting triglycerides and risk of cardiovascular events in women. JAMA. 2007;298(3):309–16. [DOI] [PubMed] [Google Scholar]
- 6. Lindman AS, Veierod MB, Tverdal A, Pedersen JI, Selmer R. Nonfasting triglycerides and risk of cardiovascular death in men and women from the Norwegian Counties Study. Eur J Epidemiol. 2010;25(11):789–98. [DOI] [PMC free article] [PubMed] [Google Scholar]
- 7. Langsted A, Freiberg JJ, Nordestgaard BG. Fasting and nonfasting lipid levels: influence of normal food intake on lipids, lipoproteins, apolipoproteins, and cardiovascular risk prediction. Circulation. 2008;118(20):2047–56. [DOI] [PubMed] [Google Scholar]
- 8. Kannel WB, Vasan RS. Triglycerides as vascular risk factors: new epidemiologic insights. Curr Opin Cardiol. 2009;24(4):345–50. [DOI] [PMC free article] [PubMed] [Google Scholar]
- 9. Kolovou GD, Mikhailidis DP, Kovar J, Lairon D, Nordestgaard BG, Ooi TC, Perez-Martinez P, Bilianou H, Anagnostopoulou K, Panotopoulos G. Assessment and clinical relevance of non-fasting and postprandial triglycerides: an expert panel statement. Curr Vasc Pharmacol. 2011;9:258–70. [DOI] [PubMed] [Google Scholar]
- 10. Kolovou G, Mikailidis DP, Nordestgaard BG, Bilianou H, Panotopoulos G. Definition of postprandial lipaemia. Curr Vasc Pharmacol. 2011;9(3):292–301. [DOI] [PubMed] [Google Scholar]
- 11. Miller M, Stone NJ, Ballantyne C, Bittner V, Criqui MH, Ginsberg HN, Goldberg AC, Howard WJ, Jacobson MS, Kris-Etherton PM et al. Triglycerides and cardiovascular disease: a scientific statement from the American Heart Association. Circulation. 2011;123(20):2292–333. [DOI] [PubMed] [Google Scholar]
- 12. Higgins V, Adeli K. Postprandial dyslipidemia; pathophysiology and cardiovascular disease risk assessment. EJIFCC 2017;28(3):168–84. [PMC free article] [PubMed] [Google Scholar]
- 13. Jackson KG, Poppitt SD, Minihane AM. Postprandial lipemia and cardiovascular disease risk: interrelationships between dietary, physiological and genetic determinants. Atherosclerosis. 2012;220(1):22–33. [DOI] [PubMed] [Google Scholar]
- 14. Vors C, Pineau G, Gabert L, Drai J, Louche-Pélissier C, Defoort C, Lairon D, Désage M, Danthine S, Lambert-Porcheron S et al. Modulating absorption and postprandial handling of dietary fatty acids by structuring fat in the meal: a randomized crossover clinical trial. Am J Clin Nutr. 2013;97(1):23–36. [DOI] [PubMed] [Google Scholar]
- 15. Tholstrup T, Sandstrom B, Bysted A, Holmer G. Effect of 6 dietary fatty acids on the postprandial lipid profile, plasma fatty acids, lipoprotein lipase, and cholesterol ester transfer activities in healthy young men. Am J Clin Nutr. 2001;73(2):198–208. [DOI] [PubMed] [Google Scholar]
- 16. Takagaki R, Ishida Y, Sadakiyo T, Taniguchi Y, Sakurai T, Mitsuzumi H, Watanabe H, Fukuda S, Ushio S. Effects of isomaltodextrin in postprandial lipid kinetics: rat study and human randomized crossover study. PLoS One. 2018;13(5):e0196802. [DOI] [PMC free article] [PubMed] [Google Scholar]
- 17. Mortensen LS, Hartvigsen ML, Brader LJ, Astrup A, Schrezenmeir J, Holst JJ, Thomsen C, Hermansen K. Differential effects of protein quality on postprandial lipemia in response to a fat-rich meal in type 2 diabetes: comparison of whey, casein, gluten, and cod protein. Am J Clin Nutr. 2009;90(1):41–8. [DOI] [PubMed] [Google Scholar]
- 18. Stanhope KL, Griffen SC, Bair BR, Swarbrick MM, Keim NL, Havel PJ. Twenty-four-hour endocrine and metabolic profiles following consumption of high-fructose corn syrup-, sucrose-, fructose-, and glucose-sweetened beverages with meals. Am J Clin Nutr. 2008;87(5):1194–203. [DOI] [PMC free article] [PubMed] [Google Scholar]
- 19. Jeppesen J, Chen YI, Zhou MY, Schaaf P, Coulston A, Reaven GM. Postprandial triglyceride and retinyl ester responses to oral fat: effects of fructose. Am J Clin Nutr. 1995;61(4):787–91. [DOI] [PubMed] [Google Scholar]
- 20. Griffo E, Di Marino L, Patti L, Bozzetto L, Annuzzi G, Cipriano P, Mangione A, Della Pepa G, Cocozza S, Riccardi G et al. Test meals rich in marine long-chain n-3 polyunsaturated fatty acids increase postprandial chylomicron response. Nutr Res. 2014;34(8):661–6. [DOI] [PubMed] [Google Scholar]
- 21. Song Z, Yang L, Shu G, Lu H, Sun G. Effects of the n-6/n-3 polyunsaturated fatty acids ratio on postprandial metabolism in hypertriacylglycerolemia patients. Lipids Health Dis. 2013;12:181. [DOI] [PMC free article] [PubMed] [Google Scholar]
- 22. Desmarchelier C, Borel P, Lairon D, Maraninchi M, Valero R. Effect of nutrient and micronutrient intake on chylomicron production and postprandial lipemia. Nutrients. 2019;11(6):1299. [DOI] [PMC free article] [PubMed] [Google Scholar]
- 23. Lopez-Miranda J, Williams C, Lairon D. Dietary, physiological, genetic and pathological influences on postprandial lipid metabolism. Br J Nutr. 2007;98(3):458–73. [DOI] [PubMed] [Google Scholar]
- 24. Kolovou GD, Watts GF, Mikhailidis DP, Perez-Martinez P, Mora S, Bilianou H, Panotopoulos G, Katsiki N, Ooi TC, Lopez-Miranda J et al. Postprandial hypertriglyceridaemia revisited in the era of non-fasting lipid profile testing: a 2019 expert panel statement, main text. Curr Vasc Pharmacol. 2019;17(5):498–514. [DOI] [PubMed] [Google Scholar]
- 25. Mihas C, Kolovou GD, Mikhailidis DP, Kovar J, Lairon D, Nordestgaard BG, Ooi TC, Perez-Martinez P, Bilianou H, Anagnostopoulou K et al. Diagnostic value of postprandial triglyceride testing in healthy subjects: a meta-analysis. Curr Vasc Pharmacol. 2011;9(3):271–80. [DOI] [PubMed] [Google Scholar]
- 26. Carstensen M, Thomsen C, Hermansen K. Incremental area under response curve more accurately describes the triglyceride response to an oral fat load in both healthy and type 2 diabetic subjects. Metabolism. 2003;52(8):1034–7. [DOI] [PubMed] [Google Scholar]
- 27. Weiss EP, Fields DA, Mittendorfer B, Haverkort MAD, Klein S. Reproducibility of postprandial lipemia tests and validity of an abbreviated 4-hour test. Metabolism. 2008;57(10):1479–85. [DOI] [PMC free article] [PubMed] [Google Scholar]
- 28. Moher D, Liberati A, Tetzlaff J, Altman DG, Group TP. Preferred Reporting Items for Systematic Reviews and Meta-Analyses; the PRISMA statement. PLoS Med. 2009;6(7):e1000097. [DOI] [PMC free article] [PubMed] [Google Scholar]
- 29. Higgins JP, Altman DG. Assessing risk of bias in included studies. In: Higgins JP, Green S, Cochrane handbook for systematic reviews of interventions: Cochrane Book Series. Chichester (West Sussex, UK: ): John Wiley & Sons; 2008. pp. 187–242. [Google Scholar]
- 30. Higgins JP, Deeks JJ, Altman DG. Special topics in statistics. In: Higgins JP, Green S, Cochrane handbook for systematic reviews of interventions: Cochrane Book Series. Chichester (West Sussex, UK): John Wiley & Sons; 2008. pp. 481–529. [Google Scholar]
- 31. Deeks JJ, Higgins JP, Altman DG. Analysing data and undertaking meta-analyses. In: Higgins JP, Green S, Cochrane handbook for systematic reviews of interventions: Cochrane Book Series. Chichester (West Sussex, UK): John Wiley & Sons; 2008. pp. 243–96. [Google Scholar]
- 32. Ezenwaka CE, Kalloo R. Carbohydrate-induced hypertriglyceridaemia among West Indian diabetic and non-diabetic subjects after ingestion of three local carbohydrate foods. Indian J Med Res. 2005;121(1):23–31. [PubMed] [Google Scholar]
- 33. Yokomichi H, Matsuoka T, Ayuzawa N, Suzuki K, Sato M, Shinohara R, Mizorogi S, Yamagata Z. Sorghum tea does not alter postprandial plasma triglycerides – a randomized, placebo-controlled, crossover clinical trial. Jpn Pharmacol Ther. 2015;43(7):961–7. [Google Scholar]
- 34. Huebbe P, Giller K, de Pascual-Teresa S, Arkenau A, Adolphi B, Portius S, Arkenau CN, Rimbach G. Effects of blackcurrant-based juice on atherosclerosis-related biomarkers in cultured macrophages and in human subjects after consumption of a high-energy meal. Br J Nutr. 2012;108(2):234–44. [DOI] [PubMed] [Google Scholar]
- 35. Tan SY, Peh E, Siow PC, Marangoni AG, Henry CJ. Effects of the physical-form and the degree-of-saturation of oil on postprandial plasma triglycerides, glycemia and appetite of healthy Chinese adults. Food Funct. 2017;8(12):4433–40. [DOI] [PubMed] [Google Scholar]
- 36. Tan SY, Wan-Yi Peh E, Marangoni AG, Henry CJ. Effects of liquid oil vs. oleogel co-ingested with a carbohydrate-rich meal on human blood triglycerides, glucose, insulin and appetite. Food Funct. 2017;8(1):241–9. [DOI] [PubMed] [Google Scholar]
- 37. McCrea CE, West SG, Kris-Etherton PM, Lambert JD, Gaugler TL, Teeter DL, Sauder KA, Gu Y, Glisan SL, Skulas-Ray AC. Effects of culinary spices and psychological stress on postprandial lipemia and lipase activity: results of a randomized crossover study and in vitro experiments. J Transl Med. 2015;13:7. [DOI] [PMC free article] [PubMed] [Google Scholar]
- 38. Ferreira TdS, Antunes VP, Leal PM, Sanjuliani AF, Klein MRST. The influence of dietary and supplemental calcium on postprandial effects of a high-fat meal on lipaemia, glycaemia, C-reactive protein and adiponectin in obese women. Br J Nutr. 2017;118(8):607–15. [DOI] [PubMed] [Google Scholar]
- 39. Abraha A, Humphreys SM, Clark ML, Matthews DR, Frayn KN. Acute effect of fructose on postprandial lipaemia in diabetic and non-diabetic subjects. Br J Nutr. 1998;80(2):169–75. [PubMed] [Google Scholar]
- 40. Fisher-Wellman KH, Bloomer RJ. Lack of effect of a high-calorie dextrose or maltodextrin meal on postprandial oxidative stress in healthy young men. Int J Sport Nutr Exerc Metab. 2010;20(5):393–400. [DOI] [PubMed] [Google Scholar]
- 41. Singleton MJ, Heiser C, Jamesen K, Mattes RD. Sweetener augmentation of serum triacylglycerol during a fat challenge test in humans. J Am Coll Nutr. 1999;18(2):179–85. [DOI] [PubMed] [Google Scholar]
- 42. Westphal S, Kästner S, Taneva E, Leodolter A, Dierkes J, Luley C. Postprandial lipid and carbohydrate responses after the ingestion of a casein-enriched mixed meal. Am J Clin Nutr. 2004;80(2):284–90. [DOI] [PubMed] [Google Scholar]
- 43. Hagander B, Holm J, Asp NG, Efendic S, Lundquist I, Nilsson-Ehle P, Schersten B. Metabolic response to beet fibre test meals. J Hum Nutr Diet. 1988;1(4):239. [Google Scholar]
- 44. Morgan LM, Tredger JA, Shavila Y, Travis JS, Wright J. The effect of non-starch polysaccharide supplementation on circulating bile acids, hormone and metabolite levels following a fat meal in human subjects. Br J Nutr. 1993;70(2):491–501. [DOI] [PubMed] [Google Scholar]
- 45. Guévin N, Jacques H, Nadeau A, Galibois I. Postprandial glucose, insulin, and lipid responses to four meals containing unpurified dietary fiber in non-insulin-dependent diabetes mellitus (NIDDM), hypertriglyceridemic subjects. J Am Coll Nutr. 1996;15(4):389–96. [DOI] [PubMed] [Google Scholar]
- 46. Kondo S, Xiao J-Z, Takahashi N, Miyaji K, Iwatsuki K, Kokubo S. Suppressive effects of dietary fiber in yogurt on the postprandial serum lipid levels in healthy adult male volunteers. Biosci Biotechnol Biochem. 2004;68(5):1135–8. [DOI] [PubMed] [Google Scholar]
- 47. Khossousi A, Binns CW, Dhaliwal SS, Pal S. The acute effects of psyllium on postprandial lipaemia and thermogenesis in overweight and obese men. Br J Nutr. 2008;99(5):1068–75. [DOI] [PubMed] [Google Scholar]
- 48. Dubois C, Cara L, Armand M, Borel P, Senft M, Portugal H, Pauli AM, Bernard PM, Lafont H, Lairon D. Effects of pea and soybean fibre on postprandial lipaemia and lipoproteins in healthy adults. Eur J Clin Nutr. 1993;47(7):508–20. [PubMed] [Google Scholar]
- 49. Kishimoto Y, Oga H, Tagami H, Okuma K, Gordon DT. Suppressive effect of resistant maltodextrin on postprandial blood triacylglycerol elevation. Eur J Nutr. 2007;46(3):133–8. [DOI] [PubMed] [Google Scholar]
- 50. Taguchi H, Watanabe H, Onizawa K, Nagao T, Gotoh N, Yasukawa T, Tsushima R, Shimasaki H, Itakura H. Double-blind controlled study on the effects of dietary diacylglycerol on postprandial serum and chylomicron triacylglycerol responses in healthy humans. J Am Coll Nutr. 2000;19(6):789–96. [DOI] [PubMed] [Google Scholar]
- 51. Yli-Jokipii K, Kallio H, Schwab U, Mykkänen H, Kurvinen JP, Savolainen MJ, Tahvonen R. Effects of palm oil and transesterified palm oil on chylomicron and VLDL triacylglycerol structures and postprandial lipid response. J Lipid Res. 2001;42(10):1618–25. [PubMed] [Google Scholar]
- 52. Kasai M, Maki H, Nosaka N, Aoyama T, Ooyama K, Uto H, Okazaki M, Igarashi O, Kondo K. Effect of medium-chain triglycerides on the postprandial triglyceride concentration in healthy men. Biosci Biotechnol Biochem. 2003;67(1):46–53. [DOI] [PubMed] [Google Scholar]
- 53. Burdge GC, Powell J, Calder PC. Lack of effect of meal fatty acid composition on postprandial lipid, glucose and insulin responses in men and women aged 50–65 years consuming their habitual diets. Br J Nutr. 2006;96(3):489–500. [PubMed] [Google Scholar]
- 54. Cantwell MM, Flynn MAT, Gibney MJ. Acute postprandial effect of hydrogenated fish oil, palm oil and lard on plasma cholesterol, triacylglycerol and non-esterified fatty acid metabolism in normocholesterolaemic males. Br J Nutr. 2006;95(4):787–94. [DOI] [PubMed] [Google Scholar]
- 55. Tomonobu K, Hase T, Tokimitsu I. Dietary diacylglycerol in a typical meal suppresses postprandial increases in serum lipid levels compared with dietary triacylglycerol. Nutrition. 2006;22(2):128–35. [DOI] [PubMed] [Google Scholar]
- 56. Berry SE, Woodward R, Yeoh C, Miller GJ, Sanders TA. Effect of interesterification of palmitic acid-rich triacylglycerol on postprandial lipid and factor VII response. Lipids. 2007;42(4):315–23. [DOI] [PubMed] [Google Scholar]
- 57. Lopez S, Bermudez B, Ortega A, Varela LM, Pacheco YM, Villar J, Abia R, Muriana FJG. Effects of meals rich in either monounsaturated or saturated fat on lipid concentrations and on insulin secretion and action in subjects with high fasting triglyceride concentrations. Am J Clin Nutr. 2011;93(3):494–9. [DOI] [PubMed] [Google Scholar]
- 58. Masson CJ, Mensink RP. Exchanging saturated fatty acids for (n-6) polyunsaturated fatty acids in a mixed meal may decrease postprandial lipemia and markers of inflammation and endothelial activity in overweight men. J Nutr. 2011;141(5):816–21. [DOI] [PubMed] [Google Scholar]
- 59. Svensson J, Rosenquist A, Ohlsson L. Postprandial lipid responses to an alpha-linolenic acid-rich oil, olive oil and butter in women: a randomized crossover trial. Lipids Health Dis. 2011;10:106. [DOI] [PMC free article] [PubMed] [Google Scholar]
- 60. Shoji K, Mizuno T, Shiiba D, Kawagoe T, Mitsui Y. Effects of a meal rich in 1,3-diacylglycerol on postprandial cardiovascular risk factors and the glucose-dependent insulinotropic polypeptide in subjects with high fasting triacylglycerol concentrations. J Agric Food Chem. 2012;60(10):2490–6. [DOI] [PubMed] [Google Scholar]
- 61. Calabuig-Navarro MV, Jackson KG, Walden CM, Minihane AM, Lovegrove JA. Apolipoprotein E genotype has a modest impact on the postprandial plasma response to meals of varying fat composition in healthy men in a randomized controlled trial. J Nutr. 2014;144(11):1775–80. [DOI] [PubMed] [Google Scholar]
- 62. Teng K-T, Chang C-Y, Kanthimathi MS, Tan ATB, Nesaretnam K. Effects of amount and type of dietary fats on postprandial lipemia and thrombogenic markers in individuals with metabolic syndrome. Atherosclerosis. 2015;242(1):281–7. [DOI] [PubMed] [Google Scholar]
- 63. Hall WL, Iqbal S, Li H, Gray R, Berry SEE. Modulation of postprandial lipaemia by a single meal containing a commonly consumed interesterified palmitic acid-rich fat blend compared to a non-interesterified equivalent. Eur J Nutr. 2017;56(8):2487–95. [DOI] [PMC free article] [PubMed] [Google Scholar]
- 64. Montserrat-de la Paz S, Lopez S, Bermudez B, Guerrero JM, Abia R, Muriana FJ. Effects of immediate-release niacin and dietary fatty acids on acute insulin and lipid status in individuals with metabolic syndrome. J Sci Food Agric. 2018;98(6):2194–200. [DOI] [PubMed] [Google Scholar]
- 65. Sun L, Tan KWJ, Lim JZ, Magkos F, Henry CJ. Dietary fat and carbohydrate quality have independent effects on postprandial glucose and lipid responses. Eur J Nutr. 2018;57(1):243–50. [DOI] [PubMed] [Google Scholar]
- 66. Muesing RA, Griffin P, Mitchell P. Corn oil and beef tallow elicit different postprandial responses in triglycerides and cholesterol, but similar changes in constituents of high-density lipoprotein. J Am Coll Nutr. 1995;14(1):53–60. [DOI] [PubMed] [Google Scholar]
- 67. Sanders TAB, de Grassi T, Miller GJ, Morrissey JH. Influence of fatty acid chain length and cis/trans isomerization on postprandial lipemia and factor VII in healthy subjects (postprandial lipids and factor VII). Atherosclerosis. 2000;149(2):413–20. [DOI] [PubMed] [Google Scholar]
- 68. Sanders TA, Oakley FR, Cooper JA, Miller GJ. Influence of a stearic acid-rich structured triacylglycerol on postprandial lipemia, factor VII concentrations, and fibrinolytic activity in healthy subjects. Am J Clin Nutr. 2001;73(4):715–21. [DOI] [PubMed] [Google Scholar]
- 69. Peairs AD, Rankin JW, Lee YW. Effects of acute ingestion of different fats on oxidative stress and inflammation in overweight and obese adults. Nutr J. 2011;10:122. [DOI] [PMC free article] [PubMed] [Google Scholar]
- 70. Dias CB, Phang M, Wood LG, Garg ML. Postprandial lipid responses do not differ following consumption of butter or vegetable oil when consumed with omega-3 polyunsaturated fatty acids. Lipids. 2015;50(4):339–47. [DOI] [PubMed] [Google Scholar]
- 71. Valente FX, Cândido FG, Lopes LL, Dias DM, Carvalho SDL, Pereira PF, Bressan J. Effects of coconut oil consumption on energy metabolism, cardiometabolic risk markers, and appetitive responses in women with excess body fat. Eur J Nutr. 2018;57(4):1627–37.. [DOI] [PubMed] [Google Scholar]
- 72. Takase H, Shoji K, Hase T, Tokimitsu I. Effect of diacylglycerol on postprandial lipid metabolism in non-diabetic subjects with and without insulin resistance. Atherosclerosis. 2005;180(1):197–204. [DOI] [PubMed] [Google Scholar]
- 73. Naissides M, Mamo JC, James AP, Pal S. The effect of acute red wine polyphenol consumption on postprandial lipaemia in postmenopausal women. Atherosclerosis. 2004;177(2):401. [DOI] [PubMed] [Google Scholar]
- 74. Unno T, Tago M, Suzuki Y, Nozawa A, Sagesaka YM, Kakuda T, Egawa K, Kondo K. Effect of tea catechins on postprandial plasma lipid responses in human subjects. Br J Nutr. 2005;93(4):543–7. [DOI] [PubMed] [Google Scholar]
- 75. Haldar S, Chia SC, Lee SH, Lim J, Leow M-S, Chan ECY, Henry CJ. Polyphenol-rich curry made with mixed spices and vegetables benefits glucose homeostasis in Chinese males (Polyspice Study): a dose-response randomized controlled crossover trial. Eur J Nutr. 2017;. 58:1–13. [DOI] [PubMed] [Google Scholar]
- 76. Pal S, Ellis V, Ho S. Acute effects of whey protein isolate on cardiovascular risk factors in overweight, post-menopausal women. Atherosclerosis. 2010;212(1):339–44. [DOI] [PubMed] [Google Scholar]
- 77. Holmer-Jensen J, Hartvigsen ML, Mortensen LS, Astrup A, de Vrese M, Holst JJ, Thomsen C, Hermansen K. Acute differential effects of milk-derived dietary proteins on postprandial lipaemia in obese non-diabetic subjects. Eur J Clin Nutr. 2012;66(1):32–8. [DOI] [PubMed] [Google Scholar]
- 78. Mortensen LS, Holmer-Jensen J, Hartvigsen ML, Jensen VK, Astrup A, de Vrese M, Holst JJ, Thomsen C, Hermansen K. Effects of different fractions of whey protein on postprandial lipid and hormone responses in type 2 diabetes. Eur J Clin Nutr. 2012;66(7):799–805. [DOI] [PubMed] [Google Scholar]
- 79. Holmer-Jensen J, Mortensen LS, Astrup A, de Vrese M, Holst JJ, Thomsen C, Hermansen K. Acute differential effects of dietary protein quality on postprandial lipemia in obese non-diabetic subjects. Nutr Res. 2013;33(1):34–40. [DOI] [PubMed] [Google Scholar]
- 80. Kagawa K, Matsutaka H, Fukuhama C, Fujino H, Okuda H. Suppressive effect of globin digest on postprandial hyperlipidemia in male volunteers. J Nutr. 1998;128(1):56–60. [DOI] [PubMed] [Google Scholar]
- 81. Clemente G, Mancini M, Nazzaro F, Lasorella G, Rivieccio A, Palumbo AM, Rivellese AA, Ferrara L, Giacco R. Effects of different dairy products on postprandial lipemia. Nutr Metab Cardiovasc Dis. 2003;13(6):377–83. [DOI] [PubMed] [Google Scholar]
- 82. Ohlsson L, Burling H, Duan RD, Nilsson A. Effects of a sphingolipid-enriched dairy formulation on postprandial lipid concentrations. Eur J Clin Nutr. 2010;64(11):1344–9. [DOI] [PubMed] [Google Scholar]
- 83. van Meijl LEC, Mensink RP. Effects of milk and milk constituents on postprandial lipid and glucose metabolism in overweight and obese men. Br J Nutr. 2013;110(3):413–9. [DOI] [PubMed] [Google Scholar]
- 84. Schmid A, Petry N, Walther B, Bütikofer U, Luginbühl W, Gille D, Chollet M, McTernan PG, Gijs MAM, Vionnet N et al. Inflammatory and metabolic responses to high-fat meals with and without dairy products in men. Br J Nutr. 2015;113(12):1853–61. [DOI] [PMC free article] [PubMed] [Google Scholar]
- 85. Baumgartner S, van de Heijning BJM, Acton D, Mensink RP. Infant milk fat droplet size and coating affect postprandial responses in healthy adult men: a proof-of-concept study. Eur J Clin Nutr. 2017;71(9):1108–13. [DOI] [PubMed] [Google Scholar]
- 86. Berry SE, Tydeman EA, Lewis HB, Phalora R, Rosborough J, Picout DR, Ellis PR. Manipulation of lipid bioaccessibility of almond seeds influences postprandial lipemia in healthy human subjects. Am J Clin Nutr. 2008;88(4):922–9. [DOI] [PubMed] [Google Scholar]
- 87. Kristensen M, Savorani F, Christensen S, Engelsen SB, Bügel S, Toubro S, Tetens I, Astrup A. Flaxseed dietary fibers suppress postprandial lipemia and appetite sensation in young men. Nutr Metab Cardiovasc Dis. 2013;23(2):136–43. [DOI] [PubMed] [Google Scholar]
- 88. Olmedilla-Alonso B, Pedrosa MM, Cuadrado C, Brito M, Asensio-S-Manzanera C, Asensio-Vegas C. Composition of two Spanish common dry beans (Phaseolus vulgaris), ‘Almonga’ and ‘Curruquilla’, and their postprandial effect in type 2 diabetics. J Sci Food Agric. 2013;93(5):1076–82. [DOI] [PubMed] [Google Scholar]
- 89. Fielding BA, Reid G, Grady M, Humphreys SM, Evans K, Frayn KN. Ethanol with a mixed meal increases postprandial triacylglycerol but decreases postprandial non-esterified fatty acid concentrations. Br J Nutr. 2000;83(6):597–604. [DOI] [PubMed] [Google Scholar]
- 90. Dalgaard M, Thomsen C, Rasmussen BM, Holst JJ, Hermansen K. Ethanol with a mixed meal decreases the incretin levels early postprandially and increases postprandial lipemia in type 2 diabetic patients. Metabolism. 2004;53(1):77–83. [DOI] [PubMed] [Google Scholar]
- 91. Greenfield JR, Samaras K, Hayward CS, Chisholm DJ, Campbell LV. Beneficial postprandial effect of a small amount of alcohol on diabetes and cardiovascular risk factors: modification by insulin resistance. J Clin Endocrinol Metab. 2005;90(2):661–72. [DOI] [PubMed] [Google Scholar]
- 92. Mudráková E, Poledne R, Kovář J. Postprandial triglyceridemia after single dose of alcohol in healthy young men. Nutr Metab Cardiovasc Dis. 2013;23(3):183–8. [DOI] [PubMed] [Google Scholar]
- 93. Maruyama C, Kikuchi N, Masuya Y, Hirota S, Araki R, Maruyama T. Effects of green-leafy vegetable intake on postprandial glycemic and lipidemic responses and α-tocopherol concentration in normal weight and obese men. J Nutr Sci Vitaminol. 2013;59(4):264. [DOI] [PubMed] [Google Scholar]
- 94. Dong H, Rendeiro C, Kristek A, Sargent LJ, Saunders C, Harkness L, Rowland I, Jackson KG, Spencer JP, Lovegrove JA. Addition of orange pomace to orange juice attenuates the increases in peak glucose and insulin concentrations after sequential meal ingestion in men with elevated cardiometabolic risk. J Nutr. 2016;146(6):1197–203. [DOI] [PubMed] [Google Scholar]
- 95. Dubois C, Armand M, Mekki N, Portugal H, Pauli AM, Bernard PM, Lafont H, Lairon D. Effects of increasing amounts of dietary cholesterol on postprandial lipemia and lipoproteins in human subjects. J Lipid Res. 1994;35(11):1993–2007. [PubMed] [Google Scholar]
- 96. Schoppen S, Pérez-Granados AM, Carbajal Á, Sarriá B, Sánchez-Muniz J, Gómez-Gerique JA, Vaquero MP. Sodium bicarbonated mineral water decreases postprandial lipaemia in postmenopausal women compared to a low mineral water. Br J Nutr. 2005;94(4):582–7. [DOI] [PubMed] [Google Scholar]
- 97. Saito H, Kato M, Yoshida A, Naito M. The ingestion of a fructose-containing beverage combined with fat cream exacerbates postprandial lipidemia in young healthy women. J Atheroscler Thromb. 2015;22(1):85–94. [DOI] [PubMed] [Google Scholar]
- 98. Hudgins LC, Parker TS, Levine DM, Hellerstein MK. A dual sugar challenge test for lipogenic sensitivity to dietary fructose. J Clin Endocrinol Metab. 2011;96(3):861–8. [DOI] [PMC free article] [PubMed] [Google Scholar]
- 99. Lewis GF, Uffelman KD, Szeto LW, Steiner G. Effects of acute hyperinsulinemia on VLDL triglyceride and VLDL apoB production in normal weight and obese individuals. Diabetes. 1993;42(6):833–42. [DOI] [PubMed] [Google Scholar]
- 100. Malmstrom R, Packard CJ, Caslake M, Bedford D, Stewart P, Yki-Jarvinen H, Shepherd J, Taskinen MR. Effects of insulin and acipimox on VLDL1 and VLDL2 apolipoprotein B production in normal subjects. Diabetes. 1998;47(5):779–87. [DOI] [PubMed] [Google Scholar]
- 101. Parks EJ, Skokan LE, Timlin MT, Dingfelder CS. Dietary sugars stimulate fatty acid synthesis in adults. J Nutr. 2008;138(6):1039–46. [DOI] [PMC free article] [PubMed] [Google Scholar]
- 102. Wang DD, Sievenpiper JL, de Souza RJ, Cozma AI, Chiavaroli L, Ha V, Mirrahimi A, Carleton AJ, Di Buono M, Jenkins AL et al. Effect of fructose on postprandial triglycerides: a systematic review and meta-analysis of controlled feeding trials. Atherosclerosis. 2014;232(1):125–33. [DOI] [PubMed] [Google Scholar]
- 103. Evans RA, Frese M, Romero J, Cunningham JH, Mills KE. Fructose replacement of glucose or sucrose in food or beverages lowers postprandial glucose and insulin without raising triglycerides: a systematic review and meta-analysis. Am J Clin Nutr. 2017;106(2):506–18. [DOI] [PubMed] [Google Scholar]
- 104. Ulmius M, Johansson A, Onning G. The influence of dietary fibre source and gender on the postprandial glucose and lipid response in healthy subjects. Eur J Nutr. 2009;48(7):395–402. [DOI] [PubMed] [Google Scholar]
- 105. Iseki K, Kaido K, Kobayashi M, Sugawara M, Miyazaki K. The effect of membrane surface potential on the permeability of anionic compounds across the apical membrane in human intestinal epithelial (Caco-2) cells. Biol Pharm Bull. 1997;20(7):794–9. [DOI] [PubMed] [Google Scholar]
- 106. Dahl WJ, Stewart ML. Position of the Academy of Nutrition and Dietetics: health implications of dietary fiber. J Acad Nutr Diet. 2015;115(11):1861–70. [DOI] [PubMed] [Google Scholar]
- 107. Putaala H, Mäkivuokko H, Tiihonen K, Rautonen N. Simulated colon fiber metabolome regulates genes involved in cell cycle, apoptosis, and energy metabolism in human colon cancer cells. Mol Cell Biochem. 2011;357(1):235. [DOI] [PubMed] [Google Scholar]
- 108. Weickert MO, Pfeiffer AF. Metabolic effects of dietary fiber consumption and prevention of diabetes. J Nutr. 2008;138(3):439–42. [DOI] [PubMed] [Google Scholar]
- 109. Jenkins D, Wolever T, Rao AV, Hegele RA, Mitchell SJ, Ransom T, Boctor DL, Spadafora PJ, Jenkins AL, Mehling C et al. Effect on blood lipids of very high intakes of fiber in diets low in saturated fat and cholesterol. N Engl J Med. 1993;329(1):21–6. [DOI] [PubMed] [Google Scholar]
- 110. Hannon BA, Thompson SV, Edwards CG, Skinner SK, Niemiro GM, Burd NA, Holscher HD, Teran-Garcia M, Khan NA. Dietary fiber is independently related to blood triglycerides among adults with overweight and obesity. Curr Dev Nutr. [Internet] 2019;3(2). doi:10.1093/cdn/nzy094. [DOI] [PMC free article] [PubMed] [Google Scholar]
- 111. Surampudi P, Enkhmaa B, Anuurad E, Berglund L. Lipid lowering with soluble dietary fiber. Curr Atheroscler Rep. 2016;18(12):75. [DOI] [PubMed] [Google Scholar]
- 112. Toh DWK, Koh ES, Kim JE. Lowering breakfast glycemic index and glycemic load attenuates postprandial glycemic response: a systematically searched meta-analysis of randomized controlled trials. Nutrition. 2020;71:110634. [DOI] [PubMed] [Google Scholar]
- 113. Coppack SW. Postprandial lipoproteins in non-insulin-dependent diabetes mellitus. Diab Med. 1997;14(Suppl 3):S67–74. [DOI] [PubMed] [Google Scholar]
- 114. Lewis GF, O'Meara NM, Soltys PA, Blackman JD, Iverius PH, Pugh WL, Getz GS, Polonsky KS. Fasting hypertriglyceridemia in non insulin-dependent diabetes mellitus is an important predictor of postprandial lipid and lipoprotein abnormalities. J Clin Endocrinol Metab. 1991;72(4):934–44. [DOI] [PubMed] [Google Scholar]
- 115. Kondo H, Hase T, Murase T, Tokimitsu I. Digestion and assimilation features of dietary DAG in the rat small intestine. Lipids. 2003;38(1):25–30. [DOI] [PubMed] [Google Scholar]
- 116. Yanagitaa T, Ikedab I, Wanga Y, Nakagirib H. Comparison of the lymphatic transport of radiolabeled 1,3-dioleoylglycerol and trioleoylglycerol in rats. Lipids. 2004;39(9):827–32. [DOI] [PubMed] [Google Scholar]
- 117. Shimotoyodome A, Fukuoka D, Suzuki J, Fujii Y, Mizuno T, Meguro S, Tokimitsu I, Hase T. Coingestion of acylglycerols differentially affects glucose-induced insulin secretion via glucose-dependent insulinotropic polypeptide in C57BL/6J mice. Endocrinology. 2009;150(5):2118–26. [DOI] [PubMed] [Google Scholar]
- 118. Mekki N, Charbonnier M, Borel P, Leonardi J, Juhel C, Portugal H, Lairon D. Butter differs from olive oil and sunflower oil in its effects on postprandial lipemia and triacylglycerol-rich lipoproteins after single mixed meals in healthy young men. J Nutr. 2002;132(12):3642–9. [DOI] [PubMed] [Google Scholar]
- 119. Monfort-Pires M, Delgado-Lista J, Gomez-Delgado F, Lopez-Miranda J, Perez-Martinez P, Ferreira SRG. Impact of the content of fatty acids of oral fat tolerance tests on postprandial triglyceridemia: systematic review and meta-analysis. Nutrients. 2016;8(9):580. [DOI] [PMC free article] [PubMed] [Google Scholar]
- 120. Khan S, Minihane AM, Talmud PJ, Wright JW, Murphy MC, Williams CM, Griffin BA. Dietary long-chain n-3 PUFAs increase LPL gene expression in adipose tissue of subjects with an atherogenic lipoprotein phenotype. J Lipid Res. 2002;43(6):979–85. [PubMed] [Google Scholar]
- 121. Park Y, Harris WS. Omega-3 fatty acid supplementation accelerates chylomicron triglyceride clearance. J Lipid Res. 2003;44(3):455–63. [DOI] [PubMed] [Google Scholar]
- 122. Harris WS, Hustvedt BE, Hagen E, Green MH, Lu G, Drevon CA. n-3 fatty acids and chylomicron metabolism in the rat. J Lipid Res. 1997;38(3):503–15. [PubMed] [Google Scholar]
- 123. McAllan L, Skuse P, Cotter PD, O'Connor P, Cryan JF, Ross RP, Fitzgerald G, Roche HM, Nilaweera KN. Protein quality and the protein to carbohydrate ratio within a high fat diet influences energy balance and the gut microbiota in C57BL/6J mice. PLoS One. 2014;9(2):e88904. [DOI] [PMC free article] [PubMed] [Google Scholar]
- 124. Nilsson M, Stenberg M, Frid AH, Holst JJ, Björck IM. Glycemia and insulinemia in healthy subjects after lactose-equivalent meals of milk and other food proteins: the role of plasma amino acids and incretins. Am J Clin Nutr. 2004;80(5):1246–53. [DOI] [PubMed] [Google Scholar]
- 125. Mihas C, Kolovou GD, Mikhailidis DP, Kovar J, Lairon D, Nordestgaard BG, Ooi TC, Perez-Martinez P, Bilianou H, Anagnostopoulou K et al. Diagnostic value of postprandial triglyceride testing in healthy subjects: a meta-analysis. Curr Vasc Pharmacol. 2011;9:271–80. [DOI] [PubMed] [Google Scholar]
- 126. Tan S-Y, Wan-Yi Peh E, Marangoni AG, Henry CJ. Effects of liquid oil vs. oleogel co-ingested with a carbohydrate-rich meal on human blood triglycerides, glucose, insulin and appetite. Food Funct. 2017;8(1):241–9. [DOI] [PubMed] [Google Scholar]
- 127. Tan S-Y, Peh E, Siow PC, Marangoni AG, Henry CJ. Effects of the physical-form and the degree-of-saturation of oil on postprandial plasma triglycerides, glycemia and appetite of healthy Chinese adults. Food Funct. 2017;8(12):4433–40. [DOI] [PubMed] [Google Scholar]
Associated Data
This section collects any data citations, data availability statements, or supplementary materials included in this article.