

ABSTRACT
The number of cancer survivors is growing rapidly worldwide, especially long-term survivors. Although a healthy diet with a high vegetable and fruit consumption is a key factor in primary cancer prevention, there is a lack of specific dietary recommendations for cancer survivors, except in the case of breast cancer [World Cancer Research Fund (WCRF)/American Institute for Cancer Research (AICR) report]. We have therefore carried out a systematic review and meta-analysis of cohort studies reporting on the associations between vegetable and fruit intake with cancer recurrence and mortality and all-cause mortality in cancer patients. After a comprehensive search of PubMed and Scopus databases, the results of 28 selected articles were analyzed. A high vegetable intake before diagnosis was inversely associated with overall mortality in survivors of head and neck (HR: 0.75; 95% CI: 0.65, 0.87) and ovarian cancer (HR: 0.78; 95% CI: 0.66, 0.91). In ovarian cancer patients, prediagnosis fruit intake was also inversely associated with all-cause mortality (HR: 0.82; 95% CI: 0.70, 0.96). The evidence was insufficient for survivors of other cancers, although these associations generally tended to be protective. Therefore, more studies are needed to clarify the association between vegetable and fruit consumption and the prognosis of these different types of cancer. To date, the general recommendation to consume ≥5 servings of vegetables and fruit per day (∼400 g/d) could underestimate the needs of cancer survivors, particularly those with ovarian tumors, in which the recommendation could increase to ∼600 g/d (i.e., 300 g/d of vegetables and 300 g/d of fruit).
Keywords: cancer, survival, mortality, recurrence, prognosis, vegetables, fruit, cohort, meta-analysis
Introduction
The global burden of cancer is increasing because of an aging and expanding population and a growing prevalence of unhealthy habits (1). In parallel, advances in early detection, treatment, and supportive care have led to a rapid and steady rise in the number of cancer survivors worldwide (2). The amount of people predicted to survive a diagnosis of cancer is increasing by ∼3% per year (3), the majority now surviving 5 y or more (4). Indeed, in 2011, 50% of UK cancer patients had a 10-y survival rate (5). However, there is considerable variation according to the cancer type, location, and stage (6). A cancer survivor is considered to be anyone who has been diagnosed with cancer, completed treatment with curative-intent (but not maintenance treatment), and is disease-free (no evidence of active cancer) (7).
One-third of deaths from cancer are due to lifestyle and dietary risk factors (e.g., high levels of adiposity, low vegetable and fruit intake, lack of physical activity, and tobacco and alcohol consumption) (8). The role of diet and nutrition in the cancer burden is well-established (9), ∼5% of cancers being exclusively attributed to dietary factors (10), without taking into account obesity (20%) and alcohol (4%). Islami et al. reported that 6.9% of cancers in the Chinese population and 1.9% of cancers in the US population were attributable to a low vegetable and fruit intake (11, 12). In European and US cohorts, adherence to a healthy diet, such as the Mediterranean diet and World Cancer Research Fund (WCRF)/American Institute for Cancer Research (AICR) dietary recommendations (13, 14), has been associated with a lower overall cancer risk (15, 16). In addition, an updated meta-analysis concluded that greater adherence to the Mediterranean diet was associated with a lower risk and mortality of several cancer types, especially colorectal cancer (17). Other dietary quality indexes and dietary patterns have shown similar results (18, 19).
Healthy diets are largely based on plant-derived foods, predominantly vegetables and fruit, which are low in fat, especially saturated fat, high in fiber, and contain many vitamins, minerals, and phytochemical compounds (such as carotenoids, polyphenols, and sulfur compounds) (20). Vegetable consumption has been associated with a reduced overall cancer mortality among cancer survivors (19). Although vegetable and fruit intake was not related to cancer survival in breast cancer patients in 2 similar meta-analyses (21, 22); the WCRF/AICR report concluded that there is limited suggestive evidence linking a higher consumption of foods containing fiber with increased breast cancer survival (2). Among vegetable classes, the strongest associations with reduced cancer incidence have been found for green-yellow and cruciferous vegetables (23), which may be due to the chemopreventive properties of carotenoids and isothiocyanates, respectively (24). Among fruit, citrus fruits may have a relevant protective role against several cancers because of their high content of flavanones and vitamin C (25–29).
Apart from the WCRF/AICR recommendations for breast cancer survivors (2), there are no dietary guidelines for other cancer survivors beyond those recommended for primary cancer prevention. There is therefore a need for specific dietary recommendations for cancer survivors. In this context, the aim of this work was to review the literature and conduct a meta-analysis, wherever possible, of cohort studies reporting associations between vegetable and fruit intake and prognosis in cancer, evaluating cancer recurrence, site-specific cancer mortality, and overall mortality in cancer survivors. Our systematic review and meta-analysis is an update of the Schwedhelm et al. (19) article published in 2016. Whereas their review scope was broad, investigating all food classes and especially highlighting the relations with dietary patterns; our analysis has only focused on the intake of vegetables and fruit and their subclasses. Thus, we have had the opportunity to analyze in more detail the specific evidence by cancer subtype.
Methods
Data sources and search method
The literature search was independently performed by SH-B and MT-S using PubMed and Scopus databases (from their inception to March 2019). The following search terms were used: (cancer OR neoplasm OR carcinoma) AND (mortality OR survival OR recurrence OR prognosis OR outcome OR death) AND (vegetable OR fruit). Cancer prognosis was the main focus of this study, considering overall mortality, cancer-specific mortality, as well as cancer recurrence. Additionally, the term “tumor” was added to the search, but no changes were found in the results. The search was restricted to the English language. In addition, a human filter was used in the PubMed database. References to reviews and recovered articles were also checked. This work was conducted according to PRISMA (Preferred Reporting Items for Systematic Reviews and Meta-Analysis) (30) and MOOSE (Meta-analysis of Observational Studies in Epidemiology) (31) guidelines.
Inclusion and exclusion criteria
The study selection was independently carried out by 2 authors (SH-B and MT-S). Full-text articles were selected according to the following inclusion criteria: 1) cohort study design, 2) vegetable and fruit intake pre- and postdiagnosis as exposure, 3) overall mortality, site-specific cancer mortality, cancer recurrence, and prognosis as end-points, and 4) HR or risk ratio (RR) (with 95% CI) estimated and adjusted by confounding variables. Exclusion criteria were: 1) duplicated studies, 2) in vitro or animal studies, 3) clinical trials, ecological studies, editorials, reviews, and meta-analyses, 4) outcomes of cancer incidence, 5) nonvegetable and fruit foods and dietary patterns, 6) breast cancer survivors, and 7) no RR or HR (with 95% CI).
Data extraction
Discrepancies in data from the selected studies were analyzed by SH-B and MT-S. For each study, the model adjusted for the highest number of confounding variables was extracted. Studies were classified and aggregated by cancer site [bladder, colorectal, head and neck (including the oral cavity, pharynx, and larynx), gastric, lung, melanoma, non-Hodgkin lymphoma (NHL), esophagus, ovarian, pancreas, and prostate tumors]. Data from each study included in the systematic review and meta-analysis were the following: 1) cancer site, 2) outcome (cancer and overall mortality and recurrence), 3) identification of cohort (country, name of study), 4) follow-up (from the cancer diagnosis to the outcome), 5) sample characterization (size, number of cases, age and sex of subjects), 6) dietary assessment and timeframe, 7) exposures and their extreme categories (such as highest compared with lowest), 8) risk estimated as HR or RR (95% CI), 9) adjustments for confounding variables, and 10) author and year of study.
Study quality assessment
The quality of each study was independently checked and reviewed by SH-B and MT-S. Any discrepancies in the study inclusion, data extraction, and quality assessment were resolved with the support of a third person (RZ-R). To evaluate the risk of bias in individual studies, 2 validated scales were used: the STROBE-nut (extension of Strengthening the Reporting of Observational Studies in Epidemiology) (32) and the ROBINS-E (risk of bias in nonrandomized studies of exposures) checklists (33). STROBE-nut focuses on epidemiological studies relating to nutrition and shares some common items with the original STROBE Statement (32). In the present work, 30 items were used to evaluate study quality. The ROBINS-E tool evaluates the risk of bias assessment of nonrandomized trials, diagnostic test accuracy studies, and observational studies of exposures. The tool assesses 7 domains of bias: confounding, selection of participants into the study, classification of exposures, departures from intended exposures, missing data, measurement of outcomes, and selection of the reported result. Overall risk of bias assessment for each study is summarized within each domain. Low, moderate, serious, critical, or no information risk of bias was established in each study considering all domains (33).
Evidence quality assessment
The Hierarchies of Evidence Applied to Lifestyle Medicine (HEALM) scale was used to evaluate the overall strength of evidence for each outcome (34). HEALM items were evaluated for each association and classified into strong (Grade A), moderate/suggestive (Grade B), or insufficient/weak (Grade C) evidence.
Statistical analysis
Prior to the analyses, the studies were classified by cancer site and outcome (i.e., cancer recurrence, site-specific cancer mortality, and overall mortality). The meta-analysis was performed by pooling the multivariable-adjusted RRs or HRs of the highest dietary intake categories (e.g., total vegetables and fruit, total vegetables, and total fruit) compared with the lowest 1 if ≥3 studies reported data for the same exposure, cancer site, and outcome. When subtypes of the same food exposure group were described separately (e.g., citrus fruit and other fruit) in the same study, the pooled risk estimate (e.g., total fruit) was calculated by a meta-analysis fixed-effect model. Prediagnosis and postdiagnosis data were analyzed separately. The random-effect model was used because of the high variability in the study design among cohorts and the low number of studies meta-analyzed (35). The I2 test, the Tau2, and the 95% prediction intervals were used to evaluate the heterogeneity across studies. Meta-analyses were performed with the metan function of the Stata software, version 14 (Stata Corp).
Results
Literature search and study characteristics
A total of 8322 articles were identified from 2 databases (PubMed and Scopus). An additional 26 articles were included from other sources (reviews and manual searching). After removing the duplicates, 6035 potentially eligible articles remained. Among these, 5998 were excluded after title and abstract screening due to exclusion criteria (reviews/meta-analysis, editorials, ecological studies, in vitro or animal studies, other outcomes, and nonvegetable exposure). Thereafter, the full text of 86 articles was evaluated in detail (excluded articles are shown in Supplemental Table 1). Finally, a total of 28 articles were included in the systematic review and meta-analysis (Figure 1). Of these, 16 studies were used for the qualitative review (36–51) and 12 for the quantitative meta-analysis (52–63).
FIGURE 1.

Flowchart of the study selection for the systematic review and meta-analysis. RR, risk ratio.
Cohort studies
A few cohort studies, mainly prospective, were identified for each outcome and classified by cancer site (Supplemental Table 2). The studies included in the systematic review and meta-analysis examining the association of total vegetable and fruit intake with cancer prognosis are summarized in Tables 1–3. The studies include aerodigestive, genital and urinary, and other cancer types. Results for vegetable and fruit subtypes are shown in Supplemental Tables 3–5. A total of 18,278 males and females aged between 16 and 84 y from European, North American, East Asian, and Australian cohorts were included in the systematic review and meta-analysis. The follow-up periods varied from 9.1 mo to 16 y. Dietary information assessment predominantly preceded cancer diagnosis. Regarding vegetable and fruit consumption, exposures were analyzed mainly by comparing the highest with the lowest categories (Supplemental Table 6).
TABLE 1.
Summary of studies included in the systematic review and meta-analysis evaluating the association between total vegetable and fruit consumption and aerodigestive cancer prognosis1
| Cancer site | Outcome n (cases) | Follow-up (years) | Gender age (years) | Dietary assessment | Exposure categorization | HR/RR (95% CI) timeframe(2,3) | Adjustments | Author, year (ref.) (country) |
|---|---|---|---|---|---|---|---|---|
| Head and neck | ACM 2202 (445) | 3.2 ± 1.2 (mean ± SD) | M/F≥16 | FFQ | V: T3 (>1 p/d) vs. T1 (<5 p/wk)F: T3 (>1 p/d) vs. T1 (<1 p/wk) | 2 RR: 0.79 (0.61, 1.03)2RR: 0.91 (0.67, 1.23) | Age, sex, site, stage, comorbidity, treatment intent, education, relation status, income, smoking, alcohol, and fried food | Lang et al., 2019 (52) (UK) |
| Nasopharyngeal | ACM 1533 (243) | 3.3 (<1,5)median (min, max) | M/F46.1 (mean) | FFQ | F: daily or more vs. fewer than monthly servings | 2 HR: 0.78 (0.53, 1.14) | Age, sex, marital status, education level, clinical stage, smoking status, alcohol intake, and BMI | Shen et al., 2012 (53) (China) |
| Head and neck | ACM 504 (166) | 2.7 (<1,5.5) median (min, max) | M/F58.8 (mean) | FFQ | V: lowest (≤4 s/wk) vs. highest (≥5 s/wk)F: lowest (≤3 s/mo) vs. highest (≥1 s/wk) | 2 HR: 0.82 (0.59, 1.15)2HR: 1.26 (0.88, 1.81) | Age, sex, race, sleep score, educational level, marital status, cancer site, tumor stage, comorbidities, treatment received, smoking status, alcohol consumption, and physical activity | Duffy et al., 2009 (36) (USA) |
| Oral cavity and oropharynx | ACM146 (74)CCSM146 (49)R 146 (47) | 3.1 (mean)3.1 (mean)3.6 (mean) | M/Fcategories: <50, 50–59, 60–69 and ≥70 | FFQ | V: T3 (≥8) vs. T1 (≤4) s/wkF: T3 (≥8) vs. T1 (≤4) s/wkV: T3 (≥8) vs. T1 (≤4) s/wkF: T3 (≥8) vs. T1 (≤4) s/wkV: T3 (≥8) vs. T1 (≤4) s/wkF:T3 (≥8) vs. T1 (≤4) s/wk | 2 RR: 0.54 (0.30, 0.98)3RR: 0.14 (0.04, 0.50)2RR: 1.26 (0.73, 2.18)3RR: 0.77 (0.36, 1.64)1RR: 0.61 (0.29, 1.31)3RR: 0.14 (0.03, 0.69)2RR: 1.04 (0.52, 2.10)3RR: 0.89 (0.34, 2.32)2RR: 0.56 (0.27, 1.15)3RR: 0.43 (0.16, 1.18)2RR: 0.75 (0.37, 1.52)3RR: 0.68 (0.29, 1.59) | Age, sex, clinical stage, and tumor site | Sandoval et al., 2009 (56) (Spain) |
| Laryngeal/ hypopharyngeal | ACM931 (755) | 8 (mean)21 (max) | M/Fcategories: <50, 50–59, 60–69 and ≥70 | DQ | V: Q4 (>328.6) vs. Q1 (<148.6) g/dF: Q4 (>241) vs. Q1 (<56) g/d | 2 HR: 0.8 (0.6, 0.9)2HR: 1.0 (0.7, 1.2) | Age, sex, center, site of primary tumor, alcohol drinking, cigarette smoking, caloric intake without alcohol, and vegetable or fruit intake | Dikshit et al., 2005 (57) (Switzerland, France, Italy, and Spain) |
| Laryngeal | ACM215 (136) | 8–10 | Males59 (median) | DQ | V: T3 (<281.1) vs. T1 (<202.1) g/d | 2 HR: 0.57 (0.35, 0.94) | Age at diagnosis, clinical stage, occurrence of new primaries, and total calorie intake | Crosignani et al., 1996 (58) (Italy) |
| Gastric | ACM568 (345) | 1.2 (median)10 (max) | M/F63 (median) | FFQ | V+F: T1 (<2.7) vs. T3 (>4.3) s/d | 2 HR: 0.98 (0.75, 1.28) | Age, sex, education, extent of diseases, and total energy intake | Ferronha et al., 2012 (37) (Portugal) |
| Gastric | CCSM877 (241) | 10 (max) | M/F40–79 | DQ | F: highest (>3) vs. lowest (<3) times/wk | 2 HR: 0.98 (0.73, 1.31) | Age, sex, and pathological type and stage of cancer | Huang et al., 2000 (44) (Japan)4 |
| Colorectal | R1667 (738) | 0.5–10 | M/F55–74 | FFQ | V: T3 (≥1.5) vs. T1 (<1.1)5 F (excluding juice): T3 (≥0.9) vs. T1 (<0.5)5V+F: T3 (≥2.8) vs. T1 (<2.0)5 | 2 HR: 0.93 (0.69, 1.25)2HR: 0.96 (0.70, 1.32)2HR: 0.87 (0.64, 1.20) | Age, sex, center, race, energy intake, year of follow-up screening, adenoma at T0, T3, or T5, adequate screening at T0, T3, or T5, processed meat intake, red meat intake, calcium intake, smoking status, education, exercise, family history of colorectal cancer, use of NSAIDs, HRT, BMI, alcohol intake | Kunzmann et al., 2016 (45) (USA) |
| Colorectal | R87 (53) | 3 (max) | M/F65 (median) | 5d DR | V: highest (>110) vs. lowest (<110) g/dF+berries: highest (>200) vs. lowest (<200) g/d | 3 RR: 1.2 (0.5, 2.9)3RR: 0.9 (0.3, 2.2) | Colorectal cancer in a first-degree relative, BMI, and type of intervention | Almendingen et al., 2004 (46) (Norway) |
| Colorectal | ACM148 (46 at 5 y) | 10 (max)5 (RR ACM) | M/F30–79 | FFQ | V: T3 vs. T1F: T3 vs. T1 | 2 RR: 1.09 (0.49, 2.45)2RR: 0.84 (0.37, 1.88) | Age, sex, tumor stage, tumor location, and energy intake | Dray et al., 2003 (47) (France) |
| Lung | ACM1052 (869) | <1 (median) | Male≤80 | FFQ | V+F: frequent (≥1 s/d) vs. occasional (<1 s/d) | 3 HR: 0.86 (0.72, 1.02) | District of residence, age at diagnosis, BMI, cancer history in first-degree relatives, education level, family income, stage at diagnosis, smoking status, smoking pack-years, and treatment | Li et al., 2017 (48) (China) |
| Lung | ACM286 (ns) Current smokers | 11 (max) | M/F50–64 | FFQ | V: T3 (160–536) vs. T1 (16–88) g/dF: (excluding juices): T3 (143–671) vs. T1 (0–51) g/d | 2 HR: 0.84 (0.59, 1.21)2HR: 0.81 (0.58, 1.15) | Sex, age, extent of disease, duration of smoking, and potato and fruit/vegetable intake | Skuladottir et al., 2006 (49) (Denmark) |
Pre- and postdiagnosis dietary vegetables and fruit were not mixed in the meta-analysis. ACM, all-cause mortality; CCSM, cancer cause-specific mortality; DQ, dietary questionnaire; DR, dietary record; F, fruit; HRT, hormone replacement therapy; M/F, males and females; ns, not specified; NSAIDs, nonsteroidal anti-inflammatory drug; p/d, portion/day; p/wk, portion/week; R, cancer recurrence; ref., reference; RR, risk ratio; s/d, serving/day; s/mo, serving/month; s/wk, serving/week; V, vegetables; V+F, vegetables and fruit.
Prediagnosis.
Postdiagnosis.
Retrospective cohort study.
Food Patterns Equivalents Database (FPED) cup equivalents/1,000 kcal/d.
TABLE 3.
Summary of studies included in the systematic review and meta-analysis evaluating the association between total vegetable and fruit consumption and other cancer prognosis1
| Cancer site | Outcome n (cases) | Follow-up (years) | Gender age (years) | Dietary assessment | Exposure categorization | HR/RR (95% CI) timeframe(2) | Adjustments | Author, year (ref.) (country) |
|---|---|---|---|---|---|---|---|---|
| NHL | ACM301 (91) | 8.2 (median) | M/F20–75 | FFQ | V: T3 (>102.1) vs. T1 (<66.1) g/1000 kcal*dF: T3 (>138.1) vs. T1 (<69.5) g/1000 kcal*dV+F: T3 (>239.7) vs. T1 (<147.8) g/1000 kcal*d | 2 HR: 0.9 (0.5, 1.5)2HR: 0.9 (0.5, 1.6)2HR: 1.1 (0.6, 2.1) | Age, sex, education, smoking status, and total energy intake | Ollberding et al., 2013 (63) (USA) |
| NHL | ACM568 (250)CCSM568 (148) | 7.7 (median)11.8 (max) | Female21–84 | FFQ | V: ≥3 s/d vs. <3 s/d (cut-off)F: ≥2 s/d vs. <2 s/d (cut-off)V+F: ≥5 s/d vs. <5 s/d (cut-off)V: ≥3 s/d vs. <3 s/d (cut-off)F: ≥2 s/d vs. <2 s/d (cut-off)V+F: ≥5 s/d vs. <5 s/d (cut-off) | 2 HR: 0.58 (0.38, 0.89)2HR: 0.91 (0.70, 1.18)2HR: 0.68 (0.49, 0.95)2HR: 0.58 (0.33, 1.03)2HR: 1.04 (0.74, 1.45)2HR: 0.58 (0.33, 1.03) | Age, education, stage, B-symptom, initial treatment, and total energy intake | Han et al., 2010 (54)(USA) |
| NHL | ACM2339 (1348)CCSM2339 (903) | 4.5 ± 4.1 (mean ± SD) | M/F45–75 (mean at diagnosis: 71.8) | FFQ | V: T3 (≥179.9) vs. T1 (<120.8) g/1000 kcal/dF: T3 (≥201.3) vs. T1 (<98.6) g/1000 kcal/dV: T3 (≥179.9) vs. T1 (<120.8) g/1000 kcal/dF: T3 (≥201.3) vs. T1 (<98.6) g/1000 kcal/d | 2 HR: 0.98 (0.85, 1.12)2HR: 1.03 (0.90, 1.19)2HR: 0.98 (0.83, 1.16)2HR: 1.04 (0.88, 1.24) | Age at cohort entry, age at diagnosis, 5-y survival, sex, BMI, education, comorbidity, NHL type, stage, treatment, smoking status, and alcohol intake | Leo et al., 2016 (55) (USA) |
| Melanoma | CCSM249 (92) | 16 (median) | M/FCategories: ≤65 and >65 | DQ | F: at least daily vs. less than daily | 2 HR: 0.66 (0.42, 1.04) | Breslow thickness, age at diagnosis, sex, ulceration, and microsatellitosis | Gould Rothberga et al., 2014 (39) (USA) |
ACM, all-cause mortality; CCSM, cancer cause-specific mortality; DQ, dietary questionnaire; F, fruit; M/F, males and females; NHL, non-Hodgkin lymphoma; ref., reference; RR, risk ratio; s/d, servings/day; V, vegetables; V+F, vegetables and fruit.
Prediagnosis.
TABLE 2.
Summary of studies included in the systematic review and meta-analysis evaluating association between total vegetable and fruit consumption and genital and urinary cancer prognosis1
| Cancer site | Outcome n (cases) | Follow-up (years) | Gender age (years) | Dietary assessment | Exposure categorization | HR/RR (95% CI) timeframe(2,3) | Adjustments | Author, year (ref.) (country) |
|---|---|---|---|---|---|---|---|---|
| Ovarian | ACM811 (547) | 5.9 ± 3.8 (mean ± SD) | Female18–79 | FFQ | V: T3 (≥5) vs. T1 (<3) s/d. F: T3 (≥4) vs. T1 (none or <2) s/d | 2 RR : 0.88 (0.68, 1.13)2RR : 0.82 (0.63, 1.07) | Age at diagnosis, FIGO stage, amount of residual disease, grade, tumor subtype, smoking status, BMI, physical activity index, marital status, and daily caloric intake | Playdon et al., 2017 (59) (Australia) |
| Ovarian | ACM636 (354)CCSM636 (305) | 17 (max) | Female50–79 | HEI | V: T3 (5) vs. T1 (2.5) points4F: T3 (5) vs. T1 (2.5) points5V: T3 (5) vs. T1 (2.5) points4F: T3 (5) vs. T1 (2.5) points5 | 2 HR: 0.70 (0.47, 1.04)2HR: 0.82 (0.55, 1.21)2HR: 0.76 (0.48, 1.20)2HR: 0.84 (0.54, 1.28) | Age at diagnosis, stage at diagnosis, race/ethnicity, diabetes, physical activity, total energy intake, waist circumference, family history of ovarian cancer, and clinical trial arms | Thomson et al., 2014 (60) (US) |
| Ovarian | ACM341 (176) | 10 (max) | Female18–74 | FFQ | V: T3 (≥2) vs. T1 (<1) s/d F: T3 (≥2) vs. T1 (<1) s/d. V+F: T3 (≥5) vs. T1 (<3) s/d | 2 HR: 0.66 (0.43, 1.01)2HR: 0.67 (0.44,1 .04)2HR: 0.61 (0.38, 0.98) | Age group, race, stage, grade, residual lesions, smoking status, BMI, oral contraceptive use, parity, and total energy intake | Dolecek et al., 2010 (61) (US) |
| Ovarian | ACM609 (394) | 7.3 (5, 8.3)mean (min, max) | Female18–79 | FFQ | V: T3 (>5.6) vs. T1 (<3.9) s/d F: T3 (>4.5) vs. T1 (<2.8) s/d. | 2 HR: 0.75 (0.57, 0.99)2HR: 0.89 (0.67, 1.18) | FIGO stage, age, grade, total energy intake and BMI | Nagle et al., 2003 (62) (Australia) |
| Prostate | ACM777 (263)CCSM777 (81) | 7.5 (median)5.7 (median) | Male66 (median) | FFQ | V: Q4 (≥203) vs. Q1 (<102) g/d F: Q4 (≥380) vs. Q1 (<152) g/d V (cut-off: 146) + F (cut-off: 247) V: Q4 (≥203) vs. Q1 (<102) g/d F: Q4 (≥380) vs. Q1 (<152) g/d V (cut-off: 146) + F (cut-off: 247) | 2 HR: 0.81 (0.56, 1.16)2HR: 0.63 (0.44, 0.90)2HR: 0.66 (0.47, 0.93)2HR: 0.82 (0.42, 1.58)2HR: 0.78 (0.38, 1.61)2HR: 0.89 (0.48, 1.63) | Area of residence at diagnosis, calendar period, age at diagnosis, years of education, Gleason score, BMI, smoking habits and total energy intake | Taborelli et al., 2017 (50) (Italy) |
| Bladder | First R:728 (241)2389 (144)3Multiple R:728 (391)2389 (221)3 | 3.7 ± 1.5 (mean ± SD) | M/F69 (mean) | FFQ | V: T3 (>2.5) vs. T1 (<1.5) p/d F: T3 (>1.5) vs. T1 (<1) p/d V+F : T3 (>4) vs. T1 (<2.5) p/dV: T3 (>2.5) vs. T1 (<1.5) p/dF: T3 (>1.5) vs. T1 (<1) p/dV+F: T3 (>4) vs. T1 (<2.5) p/d | 2 HR: 1.02 (0.74, 1.41)3HR: 0.77 (0.50, 1.18)2HR: 0.85 (0.63, 1.14)3HR: 1.07 (0.78, 1.47)2HR:1.07 (0.78, 1.47)3HR: 0.65 (0.42, 1.01)2HR: 0.97 (0.86, 1.11)3HR: 0.96 (0.74, 1.09)2HR: 1.05 (0.91, 1.20)3HR: 1.02 (0.87, 1.20)2HR: 1.02 (0.90, 1.15)3HR: 1.00 (0.85, 1.18) | Age, sex, smoking status, tumor stage, grade, size, and multiplicity [and additionally adjusted for re-resection of a bladder tumor (second transurethral resection) in the time to multiple recurrences analysis] | Jochems et al., 2018 (51) (UK) |
| Bladder | ACM239 (179)CCSM239 (101) | 8 (mean)6.4 (<1,25.1)median (min, max) | M/Fcategories: <60, 60–70 and >70 | FFQ | V: T3 (>85.5) vs. T1 (<52) s/moF: T3 (>51) vs. T1 (<27.5) s/moV: T3 (>85.5) vs. T1 (<52) s/moF: T3 (>51) vs. T1 (<27.5) s/mo | 2 HR: 0.91 (0.62, 1.36)2HR: 0.91 (0.62, 1.33)2HR: 1.06 (0.63, 1.78)2HR: 1.09 (0.66, 1.81) | Age at diagnosis, total meat intake, pack-years of smoking, tumor stage and radiation therapy | Tang et al., 2010 (38) (US) |
Pre- and postdiagnosis dietary vegetables and fruit were not mixed in the meta-analysis. ACM, all-cause mortality; CCSM, cancer cause-specific mortality; F, fruit; FIGO, International Federation of Gynecology and Obstetrics; HEI, healthy eating index; M/F, males and females; p/d, portion/day; R, cancer recurrence; ref., reference; RR, risk ratio; s/d, serving/day; s/mo, serving/month; V, vegetables; V+F, vegetables and fruit.
Prediagnosis.
Postdiagnosis.
1.1 compared with 0.6 cup eq/1000 kcal.
0.8 compared with 0.4 cup eq/1000 kcal.
Vegetable and fruit intake and prognosis in aerodigestive cancer patients
Head and neck
After meta-analyzing 5 cohort studies (52, 53, 56–58), an inverse association between total vegetable consumption before diagnosis and overall mortality (HR: 0.75; 95% CI: 0.65, 0.87) was observed in head and neck cancer patients, including the oral cavity, pharynx, and larynx (Figure 2A). However, as the prediction interval is 0.54 to 1.04, the true effect size in 95% of all the population will fall in this range. A stronger association was detected for both all-cause and site-specific cancer mortality with postdiagnosis total vegetable intake than with prediagnosis intake in oral cavity and oropharynx cancer (56). However, no association between all-cause mortality and fruit (Figure 2B) or citrus fruit assessed before diagnosis was observed (58). No studies were found on the consumption of vegetable subtypes.
FIGURE 2.
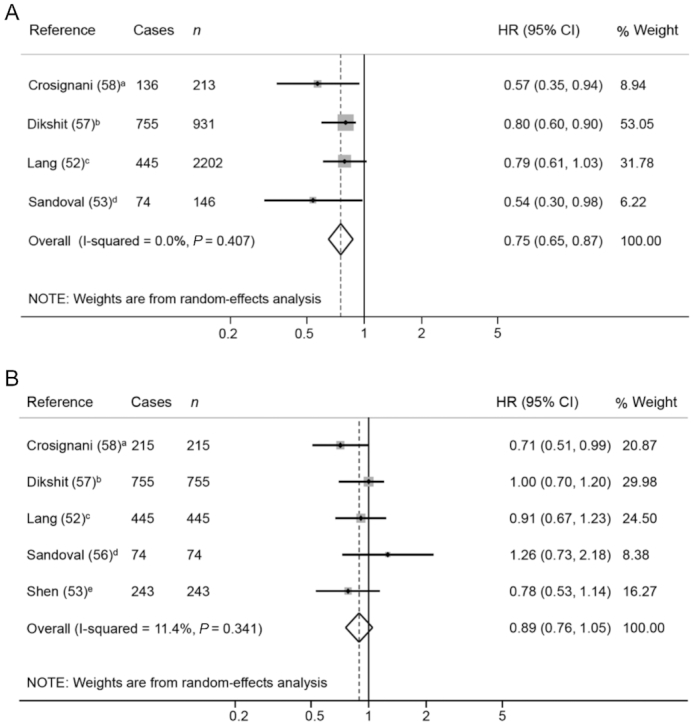
Forest plot showing pooled HRs with 95% CI for overall mortality risk in head and neck cancer patients, comparing the prediagnosis highest compared with lowest vegetable (A) and fruit (B) intake category. Quantification of the exposures: a) >281.1 g/d compared with <202.1 g/d; b) >328.6 compared with <148.6 g/d; c) <1 portions/d compared with <5 portions/wk; d) ≥8 compared with ≤4 servings/wk; e) ≥321.4 compared with 0 g/d.
Digestive tract
The high consumption of fruit and berries was not related to lower colorectal cancer recurrence (45, 46). Total vegetable intakes before and after diagnosis were not linked with prognosis in colorectal cancer survivors (45–47). Lower consumption of green leafy vegetables before diagnosis was associated with a higher risk of all-cause mortality in colon cancer patients (HR: 2.06; 95% CI: 1.10, 3.86), but not in rectal cancer patients (41). The consumption of 3 or more servings of raw vegetables per week (≥240 g/wk) before diagnosis was related to a lower risk of site-specific cancer mortality in gastric cancer patients (44). There was no association between prediagnosis green vegetable intake and overall mortality in pancreatic cancer patients (42). A Chinese study reported that the higher consumption of fermented preserved vegetables before diagnosis significantly correlated with a higher risk of all-cause mortality in esophagus cancer patients (40).
Respiratory tract
No association was found between vegetable and fruit consumption examined before diagnosis and overall mortality in lung cancer patients (48, 49). However, a high cruciferous vegetable intake before diagnosis was linked to a lower site-specific cancer mortality (HR: 0.69; 95% CI: 0.49, 0.95) in female lung cancer patients from the Shanghai Women's Health Study (43).
Vegetable and fruit intake and prognosis in genital and urinary cancer patients
Ovary
The 4 meta-analyzed studies on ovarian cancer patients (59–62) showed an inverse association between total vegetable and total fruit intake before diagnosis and overall mortality (HR: 0.78; 95% CI: 0.66, 0.91 and HR: 0.82; 95% CI: 0.70, 0.96, respectively) (Figure3A and B). Although the results are significant, the prediction interval of both meta-analyses will be expected to be outside the protective HR range in 95% of all the population. Regarding vegetable subgroups, no association between cruciferous vegetable consumption and overall mortality was detected (Supplemental Figure 1). Null results were also found for the intake of other vegetable or fruit subgroups (e.g., green leafy, and yellow and red vegetables, and citrus fruit) (59–62).
FIGURE 3.
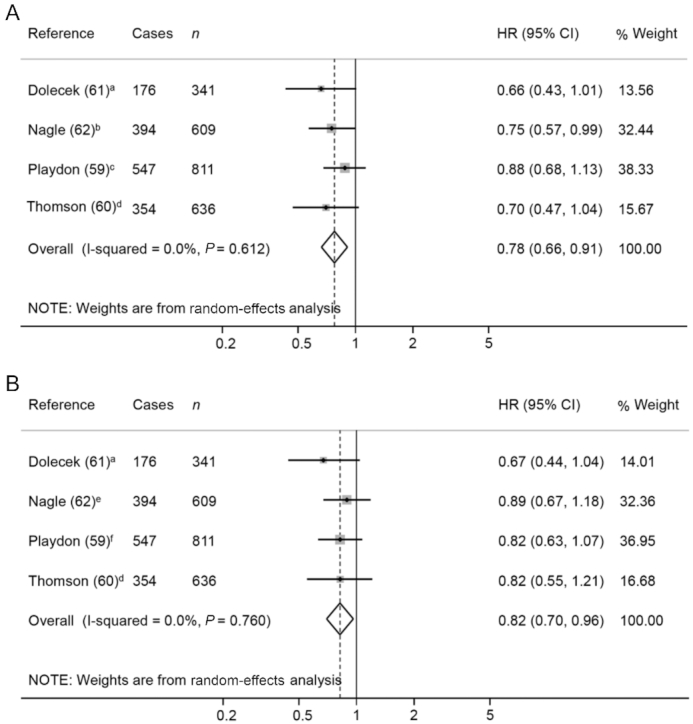
Forest plot showing pooled HRs with 95% CI for overall mortality risk in ovarian cancer patients, comparing the prediagnosis highest compared with lowest vegetable (A) and fruit (B) intake categories. Quantification of the exposures: a) 2 compared with 1 servings/d; b) ≥5.6 compared with <3.0 servings/wk; c) ≥5 compared with <3 servings/d; d) 5 compared with 2.5 points (1.1 compared with 0.6 cup eq/1000 kcal in vegetables and 0.8 compared with 0.4 cup eq/1000 kcal in fruit); e) ≥4.5 compared with 2.8 servings/wk; f) ≥4 compared with <2 servings/d.
Prostate
In prostate cancer patients, prediagnosis consumption of total fruit was inversely associated with all-cause mortality, but not with site-specific cancer mortality (50). Raw vegetable intake was also inversely associated with all-cause and cancer-specific mortality, whereas no association was detected for the consumption of either total or cooked vegetables (50).
Bladder
In 2 studies on bladder cancer patients, the pre- and postdiagnosis intake of total vegetables, fruit, or both were not related to either all-cause mortality or cancer recurrence (38, 51). No association with the consumption of cruciferous vegetables before diagnosis was found either (38).
Vegetable and fruit intake and prognosis in patients with other cancer sites
NHL
Three studies have evaluated the relation with overall mortality in patients with NHL (54, 55, 63), showing null results for the intake of vegetables (HR: 0.83; 95% CI: 0.59, 1.16) and fruit (HR: 1.00; 95% CI: 0.88, 1.13) in prediagnosis eating habits. The same exact results were previously obtained by Schwedhelm et al. (19). Han et al. (54) observed protective effects for green leafy vegetables and citrus fruit, but not for other vegetable subtypes, such as cruciferous, bean, and red and yellow vegetables.
Melanoma
The only study in melanoma patients, the Connecticut Skin Self-Examination Case-Control Study, found no association between the daily consumption of fruit or weekly consumption of green salad before diagnosis and site-specific cancer mortality (39).
Quality of studies and overall strength of evidence
The quality of all individual studies was categorized as moderate in all cases. The main cause for this classification was the concern of changes in exposure status among patients. In addition, minor reasons reducing the quality of studies were observed: bias due to confounding (40, 41, 57), bias in classification of exposures (39, 40, 42, 47, 48, 56), and bias in selection of the reported results (36, 39, 41, 42, 57, 61) (Supplemental Table 7). More details about the items considered in both the ROBINS-E and the STROBE-nut scale are provided as supplementary material (Supplemental Tables 8and9, respectively). According to the HEALM scale, the level of evidence of this systematic review was Grade C (insufficient/weak).
Discussion
Associations between vegetable and fruit intake and cancer mortality
The aim of this systematic review and meta-analysis was to examine the available evidence for the relation between vegetable and fruit consumption and cancer prognosis, excluding breast cancer (2). In summary, the current meta-analysis shows a lower mortality associated with vegetable and fruit intake in ovarian cancer patients, and with vegetable intake in head and neck cancer patients.
A 25% lower risk in all-cause mortality was observed in survivors of head and neck cancer consuming more vegetables, with the highest risk reduction for total vegetable intake (∼300 g/d) (56–58). Sandoval et al. (56) observed a more pronounced inverse risk in all-cause and oral and oropharynx cancer mortality when considering the postdiagnosis vegetable intake compared with the prediagnosis intake. This suggests that it is more useful to assess the diet after cancer diagnosis and treatment as it has more impact on prognosis. Although no significant association was found when comparing the highest and lowest categories of total vegetable intake with oral and oropharynx cancer recurrence, a 73% lower risk was observed among moderate consumers of vegetables (5–7 servings/wk reported after diagnosis, equivalent to ∼400 g/d) (56). In addition, a protective effect has been described for a whole-food diet rich in vegetables and fruit regarding overall mortality in head and neck cancer patients (64). However, in the present meta-analysis, no association was found between head and neck cancer prognosis and fruit intake, in contrast with Crosignani et al. (58), who reported a lower all-cause mortality in men consuming ≥200 g/wk compared with 80 g/wk or lower of noncitrus fruit. Similar inverse associations have been observed between the intake of nonstarchy vegetables and oral cancer risk (including mouth, pharynx, larynx, and nasopharynx sites) in healthy populations, but not with fruit consumption (65).
There are few studies on prognosis in digestive tract cancer survivors [esophagus (40), stomach (37, 44), pancreas (42), and colorectum (41, 45–47)], suggesting basically null results. However, the lowest consumption of green leafy vegetables (almost never compared with almost every day) was directly associated with a higher all-cause mortality in male colorectal cancer patients, particularly with colon cancer (41). Furthermore, results of the WCRF/AICR report were also suggestive of an inverse relation between a low vegetable and fruit intake and both incident colorectal and gastric cancer risks (65).
Vegetable and fruit consumption may be inversely related to the incidence of lung cancer (66, 67), particularly in smoker populations (65, 68). Although an uncertain relation was found between lung cancer prognosis and total vegetable and fruit intake (48, 49), Wu et al. (43) reported a 31% lower site-specific cancer mortality in female nonsmoker lung cancer patients consuming ∼120 g of cruciferous vegetables per day. Similarly, the risk of lung cancer incidence was lower among high consumers of cruciferous vegetables (68).
Our meta-analysis revealed that a higher vegetable (∼300 g/d) and fruit (∼300 g/d) intake was associated with a 22% and 18% lower overall mortality, respectively, in ovarian cancer patients. The strongest associations were observed in ovarian cancer patients consuming ≥5 portions of vegetables and fruit per day (>400 g) (61). Almost identical protective effects were found with a higher adherence to the Healthy Eating Index (60). However, the results for the relations between vegetable and fruit subgroup intakes and ovarian cancer prognosis were inconclusive (59–62). Similarly, null results were described between vegetable and fruit intake and incident ovarian cancer risk in the WCRF/AICR report (65).
In an Italian cohort of prostate cancer patients, diets rich in fruit, mainly noncitrus fruit, and in both vegetables and fruit were associated with a lower risk of all-cause mortality (50). Regarding dietary patterns, Western diets were directly associated with overall and cause-specific cancer mortality, whereas Prudent and Mediterranean diets were not significantly related to overall mortality (69, 70). No association was found between vegetable and fruit intake and the incidence of prostate cancer in earlier studies (71, 72). Despite that, since cardiovascular disease is the major cause of death in prostate cancer survivors (73), a dietary pattern rich in vegetables, fruit, and whole grains is also typically recommended for cardiovascular disease prevention (74).
Vegetable and fruit consumption was not associated with prognosis in bladder cancer (38, 51). The WCRF/AICR report shows that the risk of bladder cancer is inversely related to the intake of nonstarchy vegetables and fruit, although with limited evidence (65). Several meta-analyses have addressed this topic, also with inconsistent results (71, 75–78).
The overall results in NHL cancer survivors were null (19); however, a US-based study found an inverse association between the combined consumption of vegetables and fruit and total mortality in NHL cancer survivors (54). Likewise, uncertain results were obtained for the intake of green leafy vegetables and citrus fruit separately (54, 63). Regarding NHL incidence, previous meta-analyses suggest that a high intake of vegetables, as well as vegetables and fruit, was significantly related to a 20% lower NHL risk in healthy subjects (79, 80). Although fruit intake was not associated with NHL risk (79, 80), a diet rich in citrus fruit resulted in a 15% lower risk (80).
Although in our review we did not include breast cancer survivors, it is important to highlight that a previous meta-analysis in 2017, including 12 studies, showed null results with the intake of total fruit and vegetables combined (HR: 1.01; 95% CI: 0.72, 1.42), total vegetables (HR: 0.99; 95% CI: 0.89, 1.11), and total fruit (HR: 0.88; 95% CI: 0.74, 1.05) (21). Similar results were also reported in another meta-analysis, including 10 studies (22). However, in the WCRF/AICR report, an association between the higher consumption of foods containing fiber and increased breast cancer survival was presented (2). Moreover, an inverse association, classified as probable strong evidence, was observed between nonstarchy vegetables and breast cancer incidence in the WCRF/AICR report (65).
Food processing and cooking or its absence is another factor to be considered when assessing the effect of vegetable intake. Among studies assessing the relation between raw vegetable consumption and cancer prognosis (38, 44, 50), 2 retrospective studies observed an association with 26% and 36% lower overall mortality in patients with gastric and prostate cancer, respectively (44, 50). These results are similar to those reported for the incidence of upper gastrointestinal cancer, but not prostate cancer (81). The consumption of ≥1 serving/wk (≥70 g/wk) of fermented preserved vegetables was associated with a higher all-cause mortality in all patients, in ever smokers (smoking >100 cigarettes or equivalent use of pipes in their lifetime) and in ever alcohol drinkers (individuals that drank alcohol at least once per month) with esophagus cancer, but not in those who have never smoked or drunk (40). Likewise, the consumption of salt-preserved foods correlates with a higher risk incidence of gastric and nasopharynx cancer (65).
Comparing results by cancer site, vegetable intake protected against overall mortality in patients with cancer of the ovary and head and neck. Similar results were observed with fruit consumption and overall mortality in patients with cancer of the ovary and prostate. Raw vegetable consumption has been associated with a lower mortality in survivors of prostate and gastric cancer, whereas the intake of fermented preserved vegetables has been associated with a higher mortality in esophagus cancer survivors. No significant relations between the intake of vegetables or fruit and cancer prognosis have been observed in the rest of investigated tumor sites (breast, NHL, colorectal, lung, bladder, and melanoma). Although more studies are needed to validate these observations, cancer sites seem to respond differently to dietary intake and specific recommendations should be addressed for each case.
Limitations of the current data
The protocol of this systematic review and meta-analysis was not registered in the International Prospective Register of Systematic Reviews (PROSPERO) because data extraction was completed before intending to register it. Another limitation of the present study is that it is based on insufficient/weak evidence according to the HEALM scale, due to the noncontrolled trial design of the studies included in this meta-analysis and the vague explanation of the mechanisms of action. In spite of this, the included studies allow generalizability of the results to large populations thanks to the sample size and the long-term or lifetime periods measured. Only cohort studies, mainly prospective, were included in our systematic review and meta-analysis. The low number of studies quantified in each subgroup (maximum of 4) precluded the performance of analyses of sensitivity. In general, studies were adjusted for the main potential confounders and the follow-up length was usually adequate; although some publications only provided the maximum period, but not the mean or median (44, 46, 47, 49, 58, 60, 61). Moreover, the population sample in most of the studies was representative of the general population, and the events were registered with medical certificates or report linkage. Another potential limitation is dietary measurement error, although vegetable and fruit consumption was assessed by validated questionnaires, mainly using dietary food frequency. Consumption categories (quantiles) were based on the intake of each cohort, with considerable variability between studies, which complicates the comparison of results. Moreover, dietary data was collected in servings or in cups, but each study used different sizes, especially for servings (without including this information in the publication), and therefore it impeded the possibility of performing accurate dose-response analyses. Another drawback is that in most of the studies, data of postdiagnosis diet was not considered. Therefore, in these studies, potential dietary changes after cancer diagnosis and treatment were not accounted for. This was the main cause of risk of bias in most of the studies, obtaining the moderate qualification in the ROBINS-E tool. In order to take into account this limitation, we did not mix prediagnosis with postdiagnosis data in our meta-analyses. In addition, some studies limited the analysis to smokers or nonsmokers, or to males or females, and the results from these specific cohorts cannot be directly generalized. Another limitation was the disparity in the classification of vegetables when evaluating subgroup intake, in contrast with fruit, which are clearly divided into citrus and noncitrus. A homogeneous classification of vegetables should be established to facilitate interpretation of study results. In addition, fruit juices were included as total fruit exposure by some authors. Five studies in particular took into account fruit juice consumption, some of them limiting only natural fruit juices. On the other hand, 4 out of the total studies excluded juices and 14 did not specify the criteria. The 2010 Dietary Guidelines for Americans considered 100% fruit juices a serving of fruit (82). However, the implications of consuming fruit juice remain controversial, in terms of its nutritional value and health impacts (83–85). Nevertheless, this meta-analysis adds valuable information to previous studies. This investigation focuses on the associations between the intake of vegetables and fruit, as well as their subgroups, and cancer prognosis. To date, only recommendations of vegetable and fruit intake for breast cancer survivors have been published (2).
Future directions
Although there is a growing body of evidence on the associations between vegetable and fruit consumption and cancer incidence risk, the evidence on cancer prognosis is still limited. Much of the available data is based on prediagnosis exposure instead of postdiagnosis exposure, and it is known that cancer diagnosis can trigger significant changes of vegetables and fruit intake (86), but not in all cases (87). Therefore, further studies on postdiagnosis consumption data are needed. Furthermore, the types of fruit and vegetables included in the studies should be standardized with the exclusion of fruit juices and starchy vegetables, as their composition is different. Additionally, more studies on subgroups are needed with a predefined classification. Preparation types and processing methods, e.g., cooked compared with raw vegetables should also be analyzed in future studies. Finally, more studies using biomarkers of vegetable and fruit consumption (88) are also warranted to improve dietary assessment.
Conclusions
In the last decades, dietary recommendations have mainly focused on the primary prevention of noncommunicable diseases, for which the WHO suggests a minimum consumption of 400 g/d (5 servings/d) of vegetables and fruit (89). In addition, a systematic and dose-response meta-analysis concluded that the consumption of 550–600 g/d (7–7.5 servings/d) of vegetables and fruit was associated with a ∼14% lower risk of total incident cancer (90). To date, dietary recommendations for cancer prevention are also given to survivors, despite possible differences in the associations with cancer incidence and cancer prognosis. Both the American Cancer Society (ACS) nutritional and physical activity guidelines for cancer survivors and the European Society for Clinical Nutrition and Metabolism (ESPEN) guidelines on nutrition in cancer patients, are in parallel with the current public health guidelines for adults, which recommend following a diet high in vegetables, fruit, and whole grains (65, 73, 91, 92). Those recommendations are based on the consideration that survivors have a high risk of suffering a second primary cancer or other chronic diseases (73, 91).
Our results suggest that diets high in fruit and vegetables, especially rich in vegetables, are associated with lower cancer mortality among head and neck and ovarian cancer survivors. Thus, the consumption of ∼300 g/d of vegetables by head and neck cancer patients and ∼300 g/d of vegetables and ∼300 g/d fruit separately by ovarian cancer patients decreased overall mortality. Moreover, it is important to bear in mind that none of the studies have detected a harmful relation with the consumption of fruit and vegetables in cancer patients. According to our findings, the current general recommendation based on the consumption of 5 or more servings of vegetables or fruit per day (400 g/d) seems to be partially underestimating the needs in cancer survivors, at least for ovarian cancer survivors that could increase to ∼600 g/d (i.e., 300 g/d of vegetables and 300 g/d of fruit).
ACKNOWLEDGEMENTS
The authors’ responsibilities were as follows—RZ-R and RML-R: conceptualization; MT-S and SH-B: methodology; MT-S and SH-B: analysis; SH-B: writing the original draft; MT-S, RZ-R, and RML-R: writing, review, and editing; and all authors: read and approved the final manuscript. We thank CERCA Program / Generalitat de Catalunya for institutional support. SH-B is grateful for the predoctoral scholarship FPU (FPU14/01715) from the Ministerio de Educación. MT-S is thankful for the APIF 2018-2019 fellowship from the University of Barcelona. RZ-R would like to thank the “Miguel Servet” program (CP15/00100) from the Institute of Health Carlos III [co-funded by the European Social Fund (ESF) - ESF investing in your future].
Notes
This research was funded by the Instituto de Salud Carlos III through grants CP15/00100 and PI18/00191 (co-funded by the European Regional Development Fund, ERDF, a way to build Europe), the CYCIT from the Ministerio de Ciencia, Innovación y Universidades (grant number AGL2016-75329-R), the Instituto de Salud Carlos III, ISCIII (CIBEROBN), and Generalitat de Catalunya (GC) 2017.
Author disclosures: RML-R reports receiving lecture fees from Cerveceros de España and receiving lecture fees and travel support from Adventia. Moreover, weekly vouchers and other organic products have been provided by Ecoveritas S.A. and sponsors previously named. Nevertheless, these foundations and sponsors were not involved in the study design, the collection, analysis, and interpretation of data, the writing of the manuscript, or the decision to submit the manuscript for publication. All other authors report no conflicts of interest.
Supplemental Tables 1–9 and Supplemental Figure 1 are available from the “Supplementary data” link in the online posting of the article and from the same link in the online table of contents at https://academic.oup.com/advances/.
SH-B and MT-S contributed equally to this work.
Abbreviations used: AICR, American Institute for Cancer Research; HEALM, Hierarchies of Evidence Applied to Lifestyle Medicine, Development, and Evaluation; NHL, non-Hodgkin lymphoma; ROBINS-E, risk of bias in nonrandomized studies of exposures; RR, risk ratio; STROBE-nut, extension of Strengthening the Reporting of Observational Studies in Epidemiology; WCRF, World Cancer Research Fund.
Contributor Information
Sara Hurtado-Barroso, Department of Nutrition, Food Sciences and Gastronomy, School of Pharmacy and Food Sciences, University of Barcelona, Barcelona, Spain; Nutrition and Food Safety Research Institute at the University of Barcelona (INSA-UB), Barcelona, Spain; Spanish Biomedical Research Centre in Physiopathology of Obesity and Nutrition (CIBERobn), Carlos III Health Institute (ISCIII), Madrid, Spain.
Marta Trius-Soler, Department of Nutrition, Food Sciences and Gastronomy, School of Pharmacy and Food Sciences, University of Barcelona, Barcelona, Spain; Nutrition and Food Safety Research Institute at the University of Barcelona (INSA-UB), Barcelona, Spain.
Rosa M Lamuela-Raventós, Department of Nutrition, Food Sciences and Gastronomy, School of Pharmacy and Food Sciences, University of Barcelona, Barcelona, Spain; Nutrition and Food Safety Research Institute at the University of Barcelona (INSA-UB), Barcelona, Spain; Spanish Biomedical Research Centre in Physiopathology of Obesity and Nutrition (CIBERobn), Carlos III Health Institute (ISCIII), Madrid, Spain.
Raul Zamora-Ros, Nutrition and Food Safety Research Institute at the University of Barcelona (INSA-UB), Barcelona, Spain; Unit of Nutrition and Cancer, Cancer Epidemiology Research Programme, Catalan Institute of Oncology (ICO), Bellvitge Biomedical Research Institute (IDIBELL), Barcelona, Spain.
References
- 1. Torre LA, Bray F, Siegel RL, Ferlay J, Lortet-Tieulent J, Jemal A. Global cancer statistics, 2012. CA Cancer J Clin. 2015;65:87–108. [DOI] [PubMed] [Google Scholar]
- 2. World Cancer Research Fund/American Institute for Cancer Research Continuous Update Project Expert Report 2018. Survivors of breast and other cancers. [Internet] . Available from: https://www.wcrf.org/sites/default/files/Cancer-Survivors.pdf. [cited 05 June, 2019]. [Google Scholar]
- 3. Guzzinati S, Virdone S, De Angelis R, Panato C, Buzzoni C, Capocaccia R, Francisci S, Gigli A, Zorzi M, Tagliabue G et al. Characteristics of people living in Italy after a cancer diagnosis in 2010 and projections to 2020. BMC Cancer. 2018;18:169. [DOI] [PMC free article] [PubMed] [Google Scholar]
- 4. Allemani C, Matsuda T, Di Carlo V, Harewood R, Matz M, Nikšić M, Bonaventure A, Valkov M, Johnson CJ, Estève J et al. Global surveillance of trends in cancer survival 2000–14 (CONCORD-3): analysis of individual records for 37 513 025 patients diagnosed with one of 18 cancers from 322 population-based registries in 71 countries. Lancet. 2018;391:1023–75. [DOI] [PMC free article] [PubMed] [Google Scholar]
- 5. Cancer Research UK Cancer Stats – Cancer Worldwide Statistics for the UK. 2017[Internet]. Available from: https://www.cancerresearchuk.org/health-professional/cancer-statistics-for-the-uk [cited 5 June, 2019]. [Google Scholar]
- 6. American Cancer Society. Cancer Facts & Figures 2019. Atlanta: American Cancer Society; 2019. [Internet]. Available from: https://www.cancer.org/content/dam/cancer-org/research/cancer-facts-and-statistics/annual-cancer-facts-and-figures/2019/cancer-facts-and-figures-2019.pdf.[cited 5 June, 2019]. [Google Scholar]
- 7. Marzorati C, Riva S, Pravettoni G. Who is a cancer survivor? A systematic review of published definitions. J Cancer Educ. 2017;32:228–37. [DOI] [PubMed] [Google Scholar]
- 8. (OMS) OM de la S Cancer [Internet] [cited 27 Aug, 2019]. Available from: https://www.who.int/news-room/fact-sheets/detail/cancer. [Google Scholar]
- 9. Doll R, Peto R. The causes of cancer: quantitative estimates of avoidable risks of cancer in the United States today. J Natl Cancer Inst. 1981;66:1191–308. [PubMed] [Google Scholar]
- 10. Colditz GA, Wei EK. Preventability of cancer: the relative contributions of biologic and social and physical environmental determinants of cancer mortality. Annu Rev Public Health. 2012;33:137–56. [DOI] [PMC free article] [PubMed] [Google Scholar]
- 11. Islami F, Chen W, Yu XQ, Lortet-Tieulent J, Zheng R, Flanders WD, Xia C, Thun MJ, Gapstur SM, Ezzati M et al. Cancer deaths and cases attributable to lifestyle factors and infections in China, 2013. Ann Oncol. 2017;28:2567–74. [DOI] [PubMed] [Google Scholar]
- 12. Islami F, Goding Sauer A, Miller KD, Siegel RL, Fedewa SA, Jacobs EJ, McCullough ML, Patel AV, Ma J, Soerjomataram I et al. Proportion and number of cancer cases and deaths attributable to potentially modifiable risk factors in the United States. CA Cancer J Clin. 2018;68:31–54. [DOI] [PubMed] [Google Scholar]
- 13. World Cancer Research Fund/American Institute for Cancer Research. Diet, Nutrition, Physical Activity and Cancer: a Global Perspective. [Internet] 2018. Available from: dietandcancerreport.org. [cited 5 June, 2019]. [Google Scholar]
- 14. Shams-White MM, Brockton NT, Mitrou P, Romaguera D, Brown S, Bender A, Kahle LL, Reedy J. Operationalizing the 2018 World Cancer Research Fund/American Institute for Cancer Research (WCRF/AICR) Cancer Prevention Recommendations : A Standardized Scoring System. Nutrients. 2019;11:1572. [DOI] [PMC free article] [PubMed] [Google Scholar]
- 15. Couto E, Boffetta P, Lagiou P, Ferrari P, Buckland G, Overvad K, Dahm CC, Tjønneland A, Olsen A, Clavel-Chapelon F et al. Mediterranean dietary pattern and cancer risk in the EPIC cohort. Br J Cancer. 2011;104:1493–9. [DOI] [PMC free article] [PubMed] [Google Scholar]
- 16. Jankovic N, Geelen A, Winkels RM, Mwungura B, Fedirko V, Jenab M, Illner AK, Brenner H, Ordóñez-Mena JM, Kiefte de Jong JC et al. Adherence to the WCRF/AICR Dietary Recommendations for Cancer Prevention and Risk of Cancer in Elderly from Europe and the United States: a meta-analysis within the CHANCES Project. Cancer Epidemiol Biomarkers Prev. 2017;26:136–44. [DOI] [PMC free article] [PubMed] [Google Scholar]
- 17. Schwingshackl L, Schwedhelm C, Galbete C, Hoffmann G. Adherence to Mediterranean diet and risk of cancer: an updated systematic review and meta-analysis. Nutrients. 2017;9:1063. [DOI] [PMC free article] [PubMed] [Google Scholar]
- 18. Milajerdi A, Namazi N, Larijani B, Azadbakht L. The association of dietary quality indices and cancer mortality: a systematic review and meta-analysis of cohort studies. Nutr Cancer. 2018;70:1091–105. [DOI] [PubMed] [Google Scholar]
- 19. Schwedhelm C, Boeing H, Hoffmann G, Aleksandrova K, Schwingshackl L. Effect of diet on mortality and cancer recurrence among cancer survivors: a systematic review and meta-analysis of cohort studies. Nutr Rev. 2016;74:737–48. [DOI] [PMC free article] [PubMed] [Google Scholar]
- 20. Yalcin H, Çapar TD. Bioactive Compounds of Fruits and Vegetables. Boston, MA: Springer; 2017. p. 723–45. [Internet]. Available from: http://link.springer.com/10.1007/978-1-4939-7018-6_21. [Google Scholar]
- 21. Peng C, Luo W-P, Zhang C-X. Fruit and vegetable intake and breast cancer prognosis: a meta-analysis of prospective cohort studies. Br J Nutr. 2017;117:737–49. [DOI] [PubMed] [Google Scholar]
- 22. He J, Gu Y, Zhang S. Consumption of vegetables and fruits and breast cancer survival: a systematic review and meta-analysis. Sci Rep. 2017;7:599. [DOI] [PMC free article] [PubMed] [Google Scholar]
- 23. Amiot-Carlin M-J. [Fruit and vegetable consumption: what benefits, what risks?]. Rev Prat. 2019;69:139–42. [PubMed] [Google Scholar]
- 24. Baena Ruiz R, Salinas Hernández P. Cancer chemoprevention by dietary phytochemicals: epidemiological evidence. Maturitas. 2016;94:13–9. [DOI] [PubMed] [Google Scholar]
- 25. Farooqi AA, Wang Z, Hasnain S, Attar R, Aslam A, Mansoor Q, Ismail M. Citrus fruits and their bioactive ingredients: leading four horsemen from front. Asian Pac J Cancer Prev. 2015;16:2575–80. [DOI] [PubMed] [Google Scholar]
- 26. Barreca D, Gattuso G, Bellocco E, Calderaro A, Trombetta D, Smeriglio A, Laganà G, Daglia M, Meneghini S, Nabavi SM. Flavanones: citrus phytochemical with health-promoting properties. BioFactors. 2017;43:495–506. [DOI] [PubMed] [Google Scholar]
- 27. Zhao W, Liu L, Xu S. Intakes of citrus fruit and risk of esophageal cancer. Medicine (Baltimore). 2018;97:e0018. [DOI] [PMC free article] [PubMed] [Google Scholar]
- 28. Bae J-M, Kim EH. Dietary intakes of citrus fruit and risk of gastric cancer incidence: an adaptive meta-analysis of cohort studies. Epidemiol Health. 2016;38:e2016034. [DOI] [PMC free article] [PubMed] [Google Scholar]
- 29. Cirmi S, Navarra M, Woodside JV, Cantwell MM. Citrus fruits intake and oral cancer risk: a systematic review and meta-analysis. Pharmacol Res. 2018;133:187–94. [DOI] [PubMed] [Google Scholar]
- 30. Moher D, Liberati A, Tetzlaff J, Altman DG, PRISMA Group. Preferred Reporting Items for Systematic Reviews and Meta-Analyses: The PRISMA Statement. PLoS Med. 2009;6:e1000097. [DOI] [PMC free article] [PubMed] [Google Scholar]
- 31. Stroup DF, Berlin JA, Morton SC, Olkin I, Williamson GD, Rennie D, Moher D, Becker BJ, Sipe TA, Thacker SB. Meta-analysis of observational studies in epidemiology: a proposal for reporting. Meta-analysis Of Observational Studies in Epidemiology (MOOSE) group. JAMA. 2000;283:2008–12. [DOI] [PubMed] [Google Scholar]
- 32. Lachat C, Hawwash D, Ocké MC, Berg C, Forsum E, Hörnell A, Larsson C, Sonestedt E, Wirfält E, Åkesson A et al. Strengthening the Reporting of Observational Studies in Epidemiology—Nutritional Epidemiology (STROBE-nut): an extension of the STROBE Statement. PLOS Med. 2016;13:e1002036. [DOI] [PMC free article] [PubMed] [Google Scholar]
- 33. Bero L, Chartres N, Diong J, Fabbri A, Ghersi D, Lam J, Lau A, McDonald S, Mintzes B, Sutton P et al. The risk of bias in observational studies of exposures (ROBINS-E) tool: concerns arising from application to observational studies of exposures. Syst Rev. 2018;7:242. [DOI] [PMC free article] [PubMed] [Google Scholar]
- 34. Katz DL, Karlsen MC, Chung M, Shams-White MM, Green LW, Fielding J, Saito A, Willett W. Hierarchies of Evidence Applied to Lifestyle Medicine (HEALM ): introduction of a strength-of-evidence approach based on a methodological systematic review. BMC Med Res Method. 2019:; 19:178. [DOI] [PMC free article] [PubMed] [Google Scholar]
- 35. Riley RD, Higgins JPT, Deeks JJ. Interpretation of random effects meta-analyses. BMJ. 2011;342:964–7. [DOI] [PubMed] [Google Scholar]
- 36. Duffy SA, Ronis DL, McLean S, Fowler KE, Gruber SB, Wolf GT, Terrell JE. Pretreatment health behaviors predict survival among patients with head and neck squamous cell carcinoma. J Clin Oncol. 2009;27:1969–75. [DOI] [PMC free article] [PubMed] [Google Scholar]
- 37. Ferronha I, Castro C, Carreira H, Bento MJ, Carvalho I, Peleteiro B, Lunet N. Prediagnosis lifestyle exposures and survival of gastric cancer patients: a cohort study from Portugal. Br J Cancer. 2012;107:537–43. [DOI] [PMC free article] [PubMed] [Google Scholar]
- 38. Tang L, Zirpoli GR, Guru K, Moysich KB, Zhang Y, Ambrosone CB, McCann SE. Intake of cruciferous vegetables modifies bladder cancer survival. Cancer Epidemiol Biomarkers Prev. 2010;19:1806–11. [DOI] [PMC free article] [PubMed] [Google Scholar]
- 39. Gould Rothberg BE, Bulloch KJ, Fine JA, Barnhill RL, Berwick M. Red meat and fruit intake is prognostic among patients with localized cutaneous melanomas more than 1mm thick. Cancer Epidemiol. 2014;38:599–607. [DOI] [PMC free article] [PubMed] [Google Scholar]
- 40. Shi F, Yan F, Jin M, Chang H, Zhou Q, Zhao L, Hu Z, Song Q, Li J, He Y et al. Pre-diagnosis consumption of preserved vegetables and prognosis of invasive oesophageal squamous cell carcinoma: a prospective cohort study in one high-risk area in China. J Int Med Res. 2018;46:4306–14. [DOI] [PMC free article] [PubMed] [Google Scholar]
- 41. Tamakoshi A, Nakamura K, Ukawa S, Okada E, Hirata M, Nagai A, Matsuda K, Kamatani Y, Muto K, Kiyohara Y et al. Characteristics and prognosis of Japanese colorectal cancer patients: The BioBank Japan Project. J Epidemiol. 2017;27:S36–42. [DOI] [PMC free article] [PubMed] [Google Scholar]
- 42. Pelucchi C, Galeone C, Polesel J, Manzari M, Zucchetto A, Talamini R, Franceschi S, Negri E, La Vecchia C. Smoking and body mass index and survival in pancreatic cancer patients. Pancreas. 2014;43:47–52. [DOI] [PubMed] [Google Scholar]
- 43. Wu Q-J, Yang G, Zheng W, Li H-L, Gao J, Wang J, Gao Y-T, Shu X-O, Xiang Y-B. Pre-diagnostic cruciferous vegetables intake and lung cancer survival among Chinese women. Sci Rep. 2015;5:10306. [DOI] [PMC free article] [PubMed] [Google Scholar]
- 44. Huang X-E, Tajima K, Hamajima N, Kodera Y, Yamamura Y, Xiang J, Tominaga S, Tokudome S. Effects of dietary, drinking, and smoking habits on the prognosis of gastric cancer. Nutr Cancer. 2000;38:30–6. [DOI] [PubMed] [Google Scholar]
- 45. Kunzmann AT, Coleman HG, Huang W-Y, Cantwell MM, Kitahara CM, Berndt SI. Fruit and vegetable intakes and risk of colorectal cancer and incident and recurrent adenomas in the PLCO cancer screening trial. Int J Cancer. 2016;138:1851–61. [DOI] [PMC free article] [PubMed] [Google Scholar]
- 46. Almendingen K, Hofstad B, Vatn MH. Dietary habits and growth and recurrence of colorectal adenomas: results from a three-year endoscopic follow-up study. Nutr Cancer. 2004;49:131–8. [DOI] [PubMed] [Google Scholar]
- 47. Dray X, Boutron-Ruault M-C, Bertrais S, Sapinho D, Benhamiche-Bouvier A-M, Faivre J. Influence of dietary factors on colorectal cancer survival. Gut. 2003;52:868–73. [DOI] [PMC free article] [PubMed] [Google Scholar]
- 48. Li W, Tse LA, Au JSK, Yu KS, Wang F, Yu IT. Prognostic value of alcohol consumption and some other dietary habits for survival in a cohort of Chinese men with lung cancer. Chin J Cancer. 2017;36:21. [DOI] [PMC free article] [PubMed] [Google Scholar]
- 49. Skuladottir H, Tjoenneland A, Overvad K, Stripp C, Olsen JH. Does high intake of fruit and vegetables improve lung cancer survival?. Lung Cancer. 2006;51:267–73. [DOI] [PubMed] [Google Scholar]
- 50. Taborelli M, Polesel J, Parpinel M, Stocco C, Birri S, Serraino D, Zucchetto A. Fruit and vegetables consumption is directly associated to survival after prostate cancer. Mol Nutr Food Res. 2017;61:1600816. [DOI] [PubMed] [Google Scholar]
- 51. Jochems SHJ, van Osch FHM, Reulen RC, van Hensbergen M, Nekeman D, Pirrie S, Wesselius A, van Schooten F-J, James ND, Wallace DMA et al. Fruit and vegetable intake and the risk of recurrence in patients with non-muscle invasive bladder cancer: a prospective cohort study. Cancer Causes Control. 2018;4129:573–9. [DOI] [PMC free article] [PubMed] [Google Scholar]
- 52. Lang S, Schimansky S, Beynon R, Penfold C, Davies A, Waylen A, Thomas S, Pring M, Pawlita M, Waterboer T et al. Dietary behaviors and survival in people with head and neck cancer: results from Head and Neck 5000. Head Neck. 2019;; 41:2074–84. [DOI] [PMC free article] [PubMed] [Google Scholar]
- 53. Shen G-P, Xu F-H, He F, Ruan H-L, Cui C, Chen L-Z, Zeng Y-X, Jia W-H. Pretreatment lifestyle behaviors as survival predictors for patients with nasopharyngeal carcinoma. PLoS One. 2012;7:e36515. [DOI] [PMC free article] [PubMed] [Google Scholar]
- 54. Han X, Zheng T, Foss F, Holford TR, Ma S, Zhao P, Dai M, Kim C, Zhang Y, Bai Y et al. Vegetable and fruit intake and non-Hodgkin lymphoma survival in Connecticut women. Leuk Lymphoma. 2010;51:1047–54. [DOI] [PMC free article] [PubMed] [Google Scholar]
- 55. Leo QJN, Ollberding NJ, Wilkens LR, Kolonel LN, Henderson BE, Le Marchand L, Maskarinec G. Nutritional factors and non-Hodgkin lymphoma survival in an ethnically diverse population: the Multiethnic Cohort. Eur J Clin Nutr. 2016;; 70:41–6. [DOI] [PMC free article] [PubMed] [Google Scholar]
- 56. Sandoval M, Font R, Mañós M, Dicenta M, Quintana MJ, Bosch FX, Castellsagué X. The role of vegetable and fruit consumption and other habits on survival following the diagnosis of oral cancer: a prospective study in Spain. Int J Oral Maxillofac Surg. 2009;38:31–9. [DOI] [PubMed] [Google Scholar]
- 57. Dikshit RP, Boffetta P, Bouchardy C, Merletti F, Crosignani P, Cuchi T, Ardanaz E, Brennan P. Lifestyle habits as prognostic factors in survival of laryngeal and hypopharyngeal cancer: a multicentric European study. Int J Cancer. 2005;117:992–5. [DOI] [PubMed] [Google Scholar]
- 58. Crosignani P, Russo A, Tagliabue G, Berrino F. Tobacco and diet as determinants of survival in male laryngeal cancer patients. Int J Cancer. 1996;65:308–13. [DOI] [PubMed] [Google Scholar]
- 59. Playdon MC, Nagle CM, Ibiebele TI, Ferrucci LM, Protani MM, Carter J, Hyde SE, Neesham D, Nicklin JL, Mayne ST et al. Pre-diagnosis diet and survival after a diagnosis of ovarian cancer. Br J Cancer. 2017;116:1627–37. 10.1038/bjc.2017.120 [DOI] [PMC free article] [PubMed] [Google Scholar]
- 60. Thomson CA, Crane TE, Wertheim BC, Neuhouser ML, Li W, Snetselaar LG, Basen-Engquist KM, Zhou Y, Irwin ML. Diet quality and survival after ovarian cancer: results from the Women's Health Initiative. J Natl Cancer Inst. 2014;106(11):dju314. [DOI] [PMC free article] [PubMed] [Google Scholar]
- 61. Dolecek TA, McCarthy BJ, Joslin CE, Peterson CE, Kim S, Freels SA, Davis FG. Prediagnosis food patterns are associated with length of survival from epithelial ovarian cancer. J Am Diet Assoc. 2010;110:369–82. [DOI] [PubMed] [Google Scholar]
- 62. Nagle CM, Purdie DM, Webb PM, Green A, Harvey PW, Bain CJ. Dietary influences on survival after ovarian cancer. Int J Cancer. 2003;106:264–9. [DOI] [PubMed] [Google Scholar]
- 63. Ollberding NJ, Aschebrook-Kilfoy B, Caces DBD, Smith SM, Weisenburger DD, Chiu BC-H. Dietary intake of fruits and vegetables and overall survival in non-Hodgkin lymphoma. Leuk Lymphoma. 2013;54:2613–9. [DOI] [PubMed] [Google Scholar]
- 64. Arthur AE, Peterson KE, Rozek LS, Taylor JM, Light E, Chepeha DB, Hébert JR, Terrell JE, Wolf GT, Duffy SA et al. Pretreatment dietary patterns, weight status, and head and neck squamous cell carcinoma prognosis. Am J Clin Nutr. 2013;97:360–8. [DOI] [PMC free article] [PubMed] [Google Scholar]
- 65. AICR, WCRF. World Cancer Research Fund/American Institute for Cancer Research. Continuous Update Project Expert Report 2018. Wholegrains, vegetables and fruit and the risk of cancer [Internet] Available from: https://www.wcrf.org/sites/default/files/Wholegrains-veg-and-fruit.pdf.[cited 05 June, 2019]. [Google Scholar]
- 66. Wang Y, Li F, Wang Z, Qiu T, Shen Y, Wang M. Fruit and vegetable consumption and risk of lung cancer: a dose-response meta-analysis of prospective cohort studies. Lung Cancer. 2015;88:124–30. [DOI] [PubMed] [Google Scholar]
- 67. Wang M, Qin S, Zhang T, Song X, Zhang S. The effect of fruit and vegetable intake on the development of lung cancer: a meta-analysis of 32 publications and 20 414 cases. Eur J Clin Nutr. 2015;69:1184–92. [DOI] [PubMed] [Google Scholar]
- 68. Vieira AR, Abar L, Vingeliene S, Chan DSM, Aune D, Navarro-Rosenblatt D, Stevens C, Greenwood D, Norat T. Fruits, vegetables and lung cancer risk: a systematic review and meta-analysis. Ann Oncol. 2016;27:81–96. [DOI] [PubMed] [Google Scholar]
- 69. Yang M, Kenfield SA, Van Blarigan EL, Batista JL, Sesso HD, Ma J, Stampfer MJ, Chavarro JE. Dietary patterns after prostate cancer diagnosis in relation to disease-specific and total mortality. Cancer Prev Res (Phila). 2015;8:545. [DOI] [PMC free article] [PubMed] [Google Scholar]
- 70. Kenfield SA, DuPre N, Richman EL, Stampfer MJ, Chan JM, Giovannucci EL. Mediterranean diet and prostate cancer risk and mortality in the Health Professionals Follow-up Study. Eur Urol. 2014;65:887–94. [DOI] [PMC free article] [PubMed] [Google Scholar]
- 71. Bradbury KE, Appleby PN, Key TJ. Fruit, vegetable, and fiber intake in relation to cancer risk: findings from the European Prospective Investigation into Cancer and Nutrition (EPIC). Am J Clin Nutr. 2014;100:394S–398S. [DOI] [PubMed] [Google Scholar]
- 72. Meng H, Hu W, Chen Z, Shen Y. Fruit and vegetable intake and prostate cancer risk: a meta-analysis. Asia Pac J Clin Oncol. 2014;10:133–40. [DOI] [PubMed] [Google Scholar]
- 73. Rock CL, Doyle C, Demark-Wahnefried W, Meyerhardt J, Courneya KS, Schwartz AL, Bandera EV, Hamilton KK, Grant B, McCullough M et al. Nutrition and physical activity guidelines for cancer survivors. CA Cancer J Clin. 2012;62:242–74. [DOI] [PubMed] [Google Scholar]
- 74. Arnett DK, Blumenthal RS, Albert MA, Buroker AB, Goldberger ZD, Hahn EJ, Himmelfarb CD, Khera A, Lloyd-Jones D, McEvoy JW et al. 2019 ACC/AHA Guideline on the Primary Prevention of Cardiovascular Disease: A Report of the American College of Cardiology/American Heart Association Task Force on Clinical Practice Guidelines. Circulation. 2019;140:e596–e646. [DOI] [PMC free article] [PubMed] [Google Scholar]
- 75. Yao B, Yan Y, Ye X, Fang H, Xu H, Liu Y, Li S, Zhao Y. Intake of fruit and vegetables and risk of bladder cancer: a dose-response meta-analysis of observational studies. Cancer Causes Control. 2014;25:1645–58. [DOI] [PubMed] [Google Scholar]
- 76. Liu H, Wang X-C, Hu G-H, Guo Z-F, Lai P, Xu L, Huang T-B, Xu Y-F. Fruit and vegetable consumption and risk of bladder cancer. Eur J Cancer Prev. 2015;24:508–16. [DOI] [PubMed] [Google Scholar]
- 77. Vieira AR, Vingeliene S, Chan DSM, Aune D, Abar L, Navarro Rosenblatt D, Greenwood DC, Norat T. Fruits, vegetables, and bladder cancer risk: a systematic review and meta-analysis. Cancer Med. 2015;4:136–46. [DOI] [PMC free article] [PubMed] [Google Scholar]
- 78. Xu C, Zeng X-T, Liu T-Z, Zhang C, Yang Z-H, Li S, Chen X-Y. Fruits and vegetables intake and risk of bladder cancer. Medicine (Baltimore). 2015;94:e759. [DOI] [PMC free article] [PubMed] [Google Scholar]
- 79. Chen G-C, Lv D-B, Pang Z, Liu Q-F. Fruits and vegetables consumption and risk of non-Hodgkin's lymphoma: a meta-analysis of observational studies. Int J Cancer. 2013;133:190–200. [DOI] [PubMed] [Google Scholar]
- 80. Sergentanis TN, Psaltopoulou T, Ntanasis-Stathopoulos I, Liaskas A, Tzanninis I-G, Dimopoulos M-A. Consumption of fruits, vegetables, and risk of hematological malignancies: a systematic review and meta-analysis of prospective studies. Leuk Lymphoma. 2018;59:434–47. [DOI] [PubMed] [Google Scholar]
- 81. Link LB, Potter JD. Raw versus cooked vegetables and cancer risk. Cancer Epidemiol Biomarkers Prev. 2004;13:1422–35. [PubMed] [Google Scholar]
- 82. U.S. Department of Health and Human Services and U.S. Department of Agriculture. 2015-2020 Dietary Guidelines for Americans. 8th Edition. December 2015. Available from: http://health.gov/dietaryguidelines/2015/guidelines. [Google Scholar]
- 83. Auerbach BJ, Dibey S, Vallila-Buchman P, Kratz M, Krieger J. Review of 100% fruit juice and chronic health conditions: implications for sugar-sweetened beverage policy. Adv Nutr. 2018;6:78–85. [DOI] [PMC free article] [PubMed] [Google Scholar]
- 84. Rampersaud GC, Valim MF. 100% citrus juice: nutritional contribution, dietary benefits, and association with anthropometric measures. Crit Rev Food Sci Nutr. 2017;57:129–40. [DOI] [PubMed] [Google Scholar]
- 85. Hebden L, Leary FO, Rangan A, Lie ES, Allman-Farinelli M, Hebden L, Leary FO, Rangan A, Lie ES. Fruit consumption and adiposity status in adults: a systematic review of current evidence. Crit Rev Food Sci Nutr. 2017;57:2526–40. [DOI] [PubMed] [Google Scholar]
- 86. Shi Z, Rundle A, Genkinger JM, Cheung YK, Ergas IJ, Roh JM, Kushi LH, Kwan ML, Greenlee H. Distinct trajectories of fruits and vegetables, dietary fat, and alcohol intake following a breast cancer diagnosis: the Pathways Study. Breast Cancer Res Treat. 2019;179(1):229–40. [DOI] [PMC free article] [PubMed] [Google Scholar]
- 87. van Zutphen M, Boshuizen HC, Kok DE, van Baar H, Geijsen AJMR, Wesselink E, Winkels RM, van Halteren HK, de Wilt JHW, Kampman E et al. Colorectal cancer survivors only marginally change their overall lifestyle in the first 2 years following diagnosis. J Cancer Surviv. 2019;13(6):956–67. [DOI] [PMC free article] [PubMed] [Google Scholar]
- 88. Woodside V, Draper J, Lloyd A, McKinley MC. Use of biomarkers to assess fruit and vegetable intake. Proc Nutr Soc. 2017;76:308–15. [DOI] [PubMed] [Google Scholar]
- 89. World Health Organization (WHO)/Food and Agriculture Organization (FAO) of the United Nations Joint WHO/FAO Expert Consultation on Diet, Nutrition and the Prevention of Chronic Diseases. WHO Technical Report Series. Vol. 916 [Internet] 2003. Available from: https://apps.who.int/iris/bitstream/handle/10665/42665/WHO_TRS_916.pdf;jsessionid=387936955093F88C3F42370BEA1219D2?sequence=1. [cited 05 June, 2019]. [Google Scholar]
- 90. Aune D, Giovannucci E, Boffetta P, Fadnes LT, Keum N, Norat T, Greenwood DC, Riboli E, Vatten LJ, Tonstad S. Fruit and vegetable intake and the risk of cardiovascular disease, total cancer and all-cause mortality – a systematic review and dose-response meta-analysis of prospective studies. Int J Epidemiol. 2017;46:1029–56. [DOI] [PMC free article] [PubMed] [Google Scholar]
- 91. Arends J, Bachmann P, Baracos V, Barthelemy N, Bertz H, Bozzetti F, Fearon K, Hütterer E, Isenring E, Kaasa S et al. ESPEN guidelines on nutrition in cancer patients. Clin Nutr. 2017;36:11–48. [DOI] [PubMed] [Google Scholar]
- 92. Demark-Wahnefried W, Bandera EV, Gapstur S, Patel AV. American Cancer Society Guidelines on nutrition and physical activity for cancer prevention reducing the risk of cancer with healthy food choices and physical activity. CA Cancer J Clin. 2012;62(1):30–67. [DOI] [PubMed] [Google Scholar]