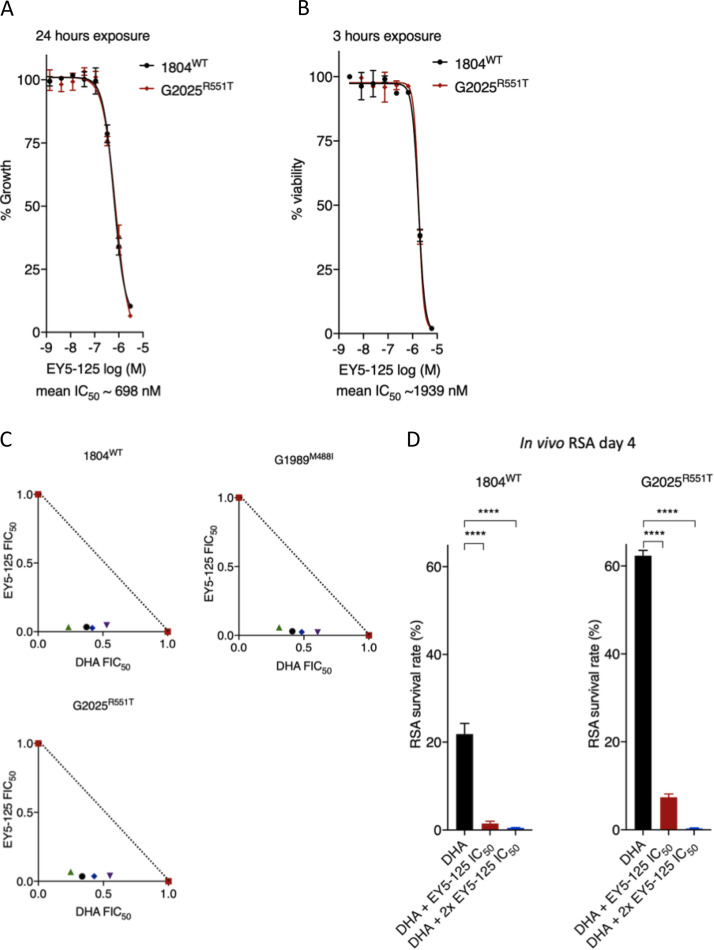
FIG 5.
Activity and DHA synergy of proteasome inhibitor in P. berghei K13 mutants. Dose-response curves and mean IC50 values for the Plasmodium-selective proteasome inhibitor EY5-125 for the wild-type 1804WT and K13 mutant G2025R551T lines in standard 24-h assays (A) or 3-h exposure assays conducted on early ring-stage parasites (B). Mean IC50 is a calculated average for the two lines independently screened in three biological repeats. (C) Isobologram plots representing the interaction between DHA and EY5-125 in the wild-type 1804WT, G1989M488I, and G2025R551T lines. Plots show mean FIC50 values (Table S4) for each drug calculated from three biological repeats. (D) Synergy of EY5-125 proteasome inhibitor with DHA in the in vivo RSA. Parasites were exposed to DMSO or DHA at 700 nM alone or in combination with EY5-125 at 3-h IC50 or 2× IC50 and then injected back into mice 24 h later as described in Materials and Methods. Parasitemias in mice infected with drug or DMSO-treated parasites were determined by flow analysis of mCherry expression on day 4 after i.v. injection and were used to calculate percent survivals relative to that of DMSO-treated parasites. Error bars are standard deviations from three biological repeats. Statistical significance was calculated using one-way ANOVA alongside the Dunnett’s multiple-comparison test. ****, P < 0.001.

