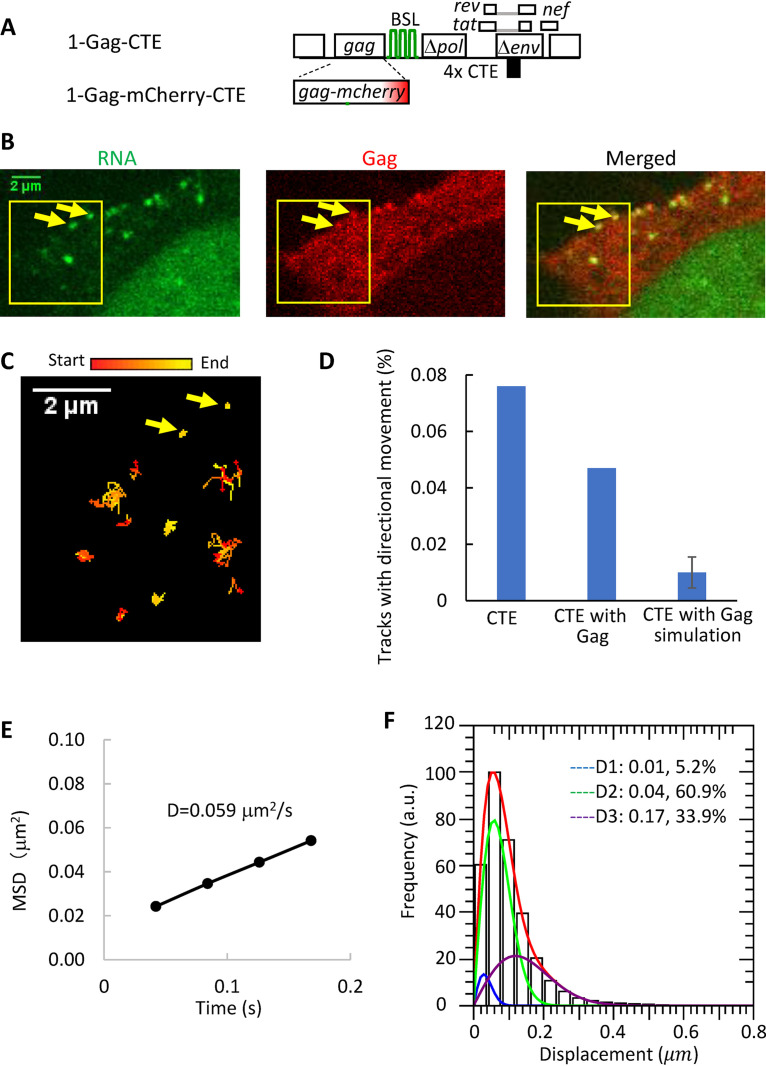
FIG 3.
The effects of Gag on the transport of cytoplasmic HIV-1 RNA exported via the NXF1 pathway. (A) General structures of the HIV-1 constructs. (B) Representative images detected in YFP (RNA), mCherry (Gag), and both (merged) channels. Arrows indicate two colocalized RNA:Gag signals at the plasma membrane. An accompanying movie, Movie S3, shows 500 frames of the images. (C) Trajectories of HIV-1 RNA movement in the first 100 frames of the selected region (yellow boxes) indicated in panel B. Arrows indicate the same two signals as in panel B. Trajectories are depicted with changing colors from start (red) to end (yellow). (D) Persistence index analysis to detect tracks with directional movement. Simulation was performed based on tracking results of 1-Gag-CTE/1-Gag-mCherry-CTE. (E) MSD analysis of 1-Gag-CTE/1-GagmCherry-CTE RNA movement in the presence of Gag. D, diffusion coefficient. (F) Distribution of the one-step jump distance of 1-Gag-CTE/1-Gag-mcherry-CTE RNAs. The solid red line represents the fitted curve, and the three dotted lines indicate distributions for each of the mobility fractions. The percentages shown are proportions of each fraction.

