

Abstract
Background
Neural tube defects (NTDs) are the second most common complex birth defect, yet, our understanding of the genetic contribution to their development remains incomplete. Two environmental factors associated with NTDs are Folate and One Carbon Metabolism (FOCM) and Glucose Homeostasis and Oxidative Stress (GHOS). Utilizing next‐generation sequencing of a large patient cohort, we identify novel candidate genes in these two networks to provide insights into NTD mechanisms.
Methods
Exome sequencing (ES) was performed in 511 patients, born with myelomeningocele, divided between European American and Mexican American ethnicities. Healthy control data from the Genome Aggregation database were ethnically matched and used as controls. Rare, high fidelity, nonsynonymous predicted damaging missense, nonsense, or canonical splice site variants in independently generated candidate gene lists for FOCM and GHOS were identified. We used a gene‐based collapsing approach to quantify mutational burden in case and controls, with the control cohort estimated using cumulative allele frequencies assuming Hardy–Weinberg equilibrium.
Results
We identified 45 of 837 genes in the FOCM network and 22 of 568 genes in the GHOS network as possible NTD risk genes with p < 0.05. No nominally significant risk genes were shared between ethnicities. Using a novel approach to mutational burden we identify 55 novel NTD risk associations.
Conclusions
We provide a means of utilizing large publicly available sequencing datasets as controls for sequencing projects examining rare disease. This approach confirmed existing risk genes for myelomeningocele and identified possible novel risk genes. Lastly, it suggests possible distinct genetic etiologies for this malformation between different ethnicities.
Keywords: exome sequencing, folate, glucose, mutation burden, Myelomeningocele
Neural tube defects (NTDs) are the second most common complex congenital birth defect and their genetic etiology remains incompletely understood. We utilize exome sequencing of 511 individuals with myelomeningocele and public database controls to identify candidate risk genes through mutational burden analysis. We present 64 candidate risk genes for NTDs, 56 of which are novel associations, and provide evidence of possible distinct molecular pathway roles for NTD risk in different ethnicities.
1. INTRODUCTION
The neural tube is the embryonic precursor of the central nervous system and forms in humans with closure during Carnegie stages 12 and 13, coinciding with the 4–5th weeks of gestation. Neural tube defects (NTDs) are congenital malformations of the central nervous system occurring secondary to incomplete closure of the neural tube in the region of the head (anencephaly), below the head (spina bifida, SB), or along its entire length (craniorachischisis; de Bakker, Driessen, Boukens, van den Hoff, & Oostra, 2017). NTDs are the second most common complex congenital malformation following congenital heart defects with an estimated worldwide birth prevalence of 18.6 per 10,000 live births (Blencowe, Kancherla, Moorthie, Darlison, & Modell, 2018; Blom, 2009). Interestingly, significant regional variation exists, and birth prevalence in the United States (US) is estimated at 5–6 per 10,000 live births (Zaganjor et al., 2016). SB accounts for ~60% of all NTDs, while myelomeningocele (MM), the most severe subtype of NTD compatible with survival, accounts for greater than 90% of open SB cases(Au, Ashley‐Koch, & Northrup, 2010; Boulet et al., 2008). In the US, Mexican Americans (MA) and European Americans (EA) have the highest incidence rates of MM at 4.17 per 10,000 and 3.22 per 10,000 live births, respectively (Boulet et al., 2008). Occurrence of MM represents a significant economic and public health burden in the US. In 2013, the estimated NTD‐related healthcare costs in the US were in excess of 1.6 billion dollars (Arth et al., 2017).
Studies to date have shown a multifactorial etiology of NTDs with both genetic and environmental contributions. A genetic component to NTD development risk has been reflected by increased familial recurrence, preponderance in monozygotic twins, and effects of ethnicity on incidence. Environmental components have been supported by variation of incidence rate across time, seasons, geography, and socioeconomic status (Blom, 2009). Two of the best associated environmental factors conferring an increased risk for NTD development are folate status and glucose metabolism, specifically maternal folate deficiency and maternal glucose excess (hyperglycemia).
Forty years ago, folate metabolism was implicated in NTDs when low folate levels were seen in mothers of infants affected with NTDs and subsequent studies showed dietary folic acid supplementation reduced recurrence of NTDs up to 72% and first occurrence by 93% (GROUP MRC VITAMIN STUDY RESEARCH, 1991). However, no effect on NTD incidence was observed until the US mandated fortification of cereal grains with folic acid, leading to a decrease in incidence of NTDs by ~35% (Williams et al., 2015). Maternal diabetes, maternal obesity, and elevated glycemic index have all been associated with increased risk for NTDs (Correa et al., 2008; Stothard, Tennant, Bell, & Rankin, 2009; Yazdy, Liu, Mitchell, & Werler, 2010). Pregestational diabetes mellitus has recently been proposed as partly responsible for the recent rise in NTD incidence observed in Canada (Liu et al., 2019).
The mechanism by which folate and glucose metabolism confer increased NTD development risk remains to be fully elucidated. Folate (vitamin B9) exists in cells as a family of enzyme cofactors that carry and activate methyl derived one‐carbon units, and is collectively known as the folate and one‐carbon metabolism network (FOCM network; Ebara, 2017). FOCM network metabolism is the primary source for one‐carbon residues important in numerous cellular activities and pathways including homocysteine remethylation, purine biosynthesis, and dTMP biosynthesis. Homocysteine remethylation is directly related to the generation of S‐adenosyl‐methionine (SAM), the universal methyl donor for nearly all one‐carbon metabolism essential to methylation of nucleic acids, proteins, and toxic metabolites (Au, Findley, & Northrup, 2017; Greene & Copp, 2014). This association also supports the growing evidence for the association of other closely related metabolic pathways involving riboflavin, B6, B12, choline, and cobalamin to NTD susceptibility (Au et al., 2017; Ebara, 2017; Nguyen et al., 2017). Furthermore, changes in DNA methylation patterns have been observed in NTD fetuses and correlated with folate levels in mothers while metabolic studies found changes in intermediate metabolites of FOCM in women with NTD‐affected pregnancies (Chang et al., 2011; Chi et al., 2014). The range of these abnormalities illustrate the broad impact of defects in the FOCM network.
Considerable epidemiological evidence implicates glucose homeostasis and oxidative stress (GHOS) as closely linked with embryopathy at the cellular level, mostly through the lens of maternal diabetes. Proposed secondary teratogenic mechanisms resulting from maternal diabetes include nutritional deficiencies, mitochondrial disturbances, enhanced cellular stress, hypoxia, increased apoptosis, decreased autophagy, altered metalloproteinases, and epigenetic changes (Ornoy, Koren, & Yanai, 2018). Increased oxidative stress leads to increased proapoptotic signaling and mitochondrial dysfunction, associated with an overall increased risk of birth defects (Gabbay‐Benziv, 2015; Xu, Li, Wang, Weng, & Yang, 2013; Yang, Albert Reece, Wang, & Gabbay‐Benziv, 2015). Previous studies have shown an association between maternal diabetes and abnormalities of yolk sac structures that are inversely related to embryonic malformations (Dong et al., 2016).
As mentioned above, genetic factors contribute to NTD development risk in addition to environmental factors. First degree relatives of NTD cases have a 30‐fold increased risk compared to the general population (3% vs. 0.1%) and second degree relatives have a 5‐fold increased risk (0.5% vs 0.1%; Au et al., 2017). Additionally, 2–16% of NTD cases are attributable to chromosome abnormalities, although these cases are considered purely genetic rather than multifactorial (Lynch, 2005). The multifactorial nature of nonsyndromic NTDs is supported by mouse models that require multiple deleterious factors in combination to result in a NTD phenotype (Zohn & Sarkar, 2008).
Candidate gene and genome wide association studies have identified genes of the FOCM and GHOS networks that associate with NTDs (Crider, Yang, Berry, & Bailey, 2012; Davidson et al., 2008). Improvements in next generation sequencing (NGS) technology make the study of rare potentially functional variants in rare disease more obtainable. Recently, an alternative approach to the study of rare disease using NGS data for disease gene discovery has proposed using a gene‐based collapsing analysis where the incidence of rare and predicted damaging variants within individual genes is compared between cases and controls (Guo, Plummer, Chan, Hirschhorn, & Lippincott, 2018). The advantage of a gene‐collapsing approach is the potential to improve power, which limits isolated statistical analysis of rare variants, by unifying variants with similar functional effect into single variables.
Two independent metabolic pathways, the FOCM and GHOS networks, represent two pathways implicated in embryonic environmental contribution to NTD risk. Genetic factors are also known to contribute to risk and damaging variants in genes playing a role in GHOS or FOCM may represent identifiable risk factors. To broadly explore the role of both of these metabolic pathways, we sequenced 514 exomes of MM patients representing the two most affected populations in the US and assessed the mutational burden with a gene collapsing approach utilizing the Genome Aggregation Database (gnomAD) as an ethnically matched control population (Lek et al., 2016).
2. MATERIALS AND METHODS
2.1. Ethical compliance
Subjects were recruited and affected individuals and/or their parents consented for enrolment in research studies in accordance with an institutional IRB at University of Texas Health Science Center (UTHealth) at Houston as described in Au et al., 2008 (Au et al., 2008).
2.2. Study design
The case population data represent exome sequencing of 511 individuals born with myelomeningocele. The case population was divided evenly between 257 EA and 254 MA subjects.
The Genome Aggregation Database was used as a control population (Lek et al., 2016). The control for MA cases were the 8,556 control Latin/Admixed American (AMR) exomes and the controls for the EA were the 21,384 control Non‐Finnish European (NFE) exomes.
2.3. Folate and one‐carbon metabolism and glucose homeostasis/oxidative stress network candidate gene lists
Two candidate gene lists were generated. Genes of folate and one‐carbon metabolism previously associated with NTD risk were reviewed in Au et al., 2017 (Au et al., 2017). These genes were used as a seed list to retrieve relevant gene ontology (GO) terms from the Ensembl Biomart (Zerbino et al., 2018). GO Terms were manually reviewed for specificity to the FOCM network using key term searches including methylation, folate, methyl, choline, cobalamin, glycine, riboflavin, purine, and pyrimidine. Selected GO terms (Table S3) were returned to Ensembl Biomart to retrieve genes annotated to these terms (Table S4), creating the FOCM Network of 837 genes used in this study. Genes of glucose homeostasis and oxidative stress were retrieved directly from the Gene Ontology consortium using the GO terms glucose homeostasis (GO:0042593) and response to oxidative stress (GO:0006979; Carbon et al., 2019). This resulted in the GHOS Network of 568 genes used in this study (Table S5). Combined, the networks contained 1,363 genes, with 42 genes overlapping between both networks.
2.4. Exome sequencing
Genomic DNA samples were used for exome capture with TargetSeq reagents (Life Technologies, Inc.) based on high density oligonucleotide hybridization of GENCODE‐annotated coding exons, NCBI CCDS, exon flanking sequences (including intron splice sites), small non‐coding RNAs (e.g., microRNAs) and a selection of miRNA binding sites. After capture, libraries were constructed with addition of barcodes (AB Library Builder, Life Technologies, Inc.). Multiplexed sequencing used the Ion Proton platform (Life Technologies, Inc.) based on proton assays for polymerase sequencing of individual DNA molecules in wells of modified semiconductor chips. Reads were aligned to the hg19 reference genome.
2.5. Data filtering and annotation
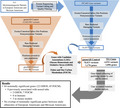
Figure 1 describes the steps for quality control filtering that were applied to both the cases and the gnomAD controls. Briefly, variant level filtering excluded variants which did not “PASS” GATK filters, map quality score <20, or inbreeding coefficient <−0.3. To ensure analysis of high fidelity variants, individual sample calls were filtered to exclude those with alternate allele depth <20%, a read depth <10, or genotype quality score <20. Variant level information including allele count (AC), allele number (AN), and allele frequencies (AF) were then recalculated for individual ethnicities after sample level exclusions. Remaining variants were annotated using the database of non‐synonymous single‐nucleotide variant functional predictions (dbNSFP) version 4.0b1a (Liu, Wu, Li, & Boerwinkle, 2016), restricting further analysis to non‐synonymous single nucleotide variants (SNVs) in exons and known canonical splice sites.
FIGURE 1.

Variant filtering and annotation workflow with summative case and control variant and gene counts. Top. General workflow and filtering parameters applied to data. Bottom. Table summarizing total qualifying variant and gene counts by ethnicity and in total for cases and controls. Variant counts represent the number of unique qualifying variant loci identified in each ethnicity and network. Gene counts represent the number of genes containing at least one qualifying variant in each network and ethnicity. AMR, American Latino; CADD, combined annotation dependent depletion; dbNSFP, database of non‐synonymous single‐nucleotide variant functional predictions; EA, European Americans; FOCM, Folate and One‐Carbon Metabolism; GATK, Genome Analysis Toolkit; GHOS, Glucose Homeostasis and Oxidative Stress; gnomAD, genome aggregation database; MA, Mexican Americans; NFE, Non‐Finnish Europeans; VCF, variant call format.
2.6. Rare variant analysis
Rare variants were defined as having an allele frequency (AF) of <1% in the respective control population (AMR, NFE). Analysis was further restricted to likely damaging variants defined as a stop gain, stop loss, or splice variants, or variants with a combined annotation dependent depletion (CADD) phred score ≥20 as annotated by dbNSFP. A CADD phred score >20 represents the top 1% of predicted damaging severity in all predicted nonsynonymous exonic variants (Rentzsch, Witten, Cooper, Shendure, & Kircher, 2019; Richards et al., 2015). Following a model similar to that presented in Guo et al, false discovery was further limited by including only variants whose positions were covered at a read depth minimum of 10 in 89.5% of both cases and control samples (Guo et al., 2018; Figure 1). For cases, the number of individuals carrying at least one qualifying variant within a gene were counted. For controls, the number of individuals with a qualifying variant in a gene was estimated based on cumulative gnomAD AF and gnomAD population size, assuming Hardy–Weinberg equilibrium. Using an R package, mutational burden analysis by gene was completed using a Fisher Exact Test, comparing the number of case individuals with and without a qualifying variant to the number of estimated control individuals with and without a qualifying variant ((2019) R.C.T. (2019)). Q‐Q plots were generated for the mutational burden analysis and evaluated for a lambda value greater than 1. As our hypothesis is that genes conferring risk for MM will have a greater mutational burden in the cases compared to the controls, results are reported only for genes with an odds ratio (OR) greater than 1. The Bonferroni correction for the number of genes tested for each network was calculated as p < 0.05/837 (5.97 × 10⁻⁵) in FOCM and p < 0.05/568 (8.80 × 10⁻⁵) in GHOS. Nominally significant genes are those with a p < 0.05.
2.7. Human embryonic expression
Embryonic NTD expression as measured by long Serial Analysis of Gene Expression has been previously reported (Krupp et al., 2012). Expression of genes of interest was provided from unpublished data.
2.8. Literature search
Boolean searches were conducted in PubMed.gov for nominally significant genes to evaluate for previous association to NTDs. Searches included the gene name and “NTD,” “Neural Tube Defect,” or “myelomeningocele.”
3. RESULTS
3.1. Data filtering
Results of data filtering are summarized in Figure 1. A greater number of variants were identified in the MA population compared to the EA population. On average, an individual in the MA population had a rare damaging variant in 8.2 genes of FOCM and 5.8 genes of GHOS while the EA population had rare damaging variants in 6.8 and 4.9 genes, respectively. Greater than 95% of Mexican Americans had rare damaging variants in 2 or more genes of GHOS, 4 or more genes of FOCM, and 6 or more genes between the two networks, while greater than 95% of European Americans had rare damaging variants in 2 or more genes of GHOS, 3 or more genes of FOCM, and 6 or more genes between the two networks (Figure 2).
FIGURE 2.

Number of qualifying variant containing genes by individual. Solid line graphs represent the number of individual cases having the number of genes containing a qualifying variant in the glucose homeostasis and oxidative stress network (GHOS) [blue], folate and one‐carbon metabolism network (FOCM) [orange], and total between the two networks (GHOS + FOCM) [grey] for both Mexican Americans and European Americans. The x‐axis is discontinuous at its upper bound for both graphs as indicated by the hashmarks. Vertical dashed lines represent the 95% population cutoff for each network. Diamond marker represent the population averages for each network.
3.2. Mutational burden
No genes reached significance in either network after applying Bonferroni correction for the number of genes tested. Table 1 contains relevant information for genes reaching nominal significance (p < 0.05) including variant quantity with number of cases harboring a qualifying variant and the estimated number of gnomAD controls carrying similar variants. Also included is the gene transcript length, GC percentage, probability of loss‐of‐function intolerance score (pLI), human embryonic Carnegie stage 12/13 neural tube expression data, and known mouse NTD phenotypes (Bult et al., 2019; Krupp et al., 2012). Variants contributing these nominally significant genes are found in Table S1.
TABLE 1.
Results for all genes reaching nominal significance for mutational burden analysis using Fisher Exact test.
| Gene | Network | Ethnicity | Case variant count | Case individual count | Control variant count | Control individual estimation | p‐Value | Odds ratio | Confidence interval (CI) | CI range | Transcript length | GC percentage | pLI score | Neural tube expression/stage | MGI neural tube phenotype |
|---|---|---|---|---|---|---|---|---|---|---|---|---|---|---|---|
| METTL5 | FOCM | MA | 5 | 9 | 22 | 67 | 3.15E‐04 | 4.65 | 2.24–9.44 | 7.2 | 1027 bp | 39.58% | 2.64E‐03 | ND | ND |
| SLC43A2 | FOCM | EA | 4 | 6 | 41 | 94 | 1.24E‐03 | 5.41 | 2.28–12.29 | 10.01 | 8413 bp | 54.66% | 3.77E‐02 | ND | ND |
| BHMT | FOCM | MA | 4 | 8 | 40 | 72 | 2.06E‐03 | 3.83 | 1.67–8.11 | 6.44 | 2500 bp | 41.67% | 1.86E‐04 | ND | ND |
| CLN3 | FOCM | EA | 6 | 6 | 41 | 107 | 2.32E‐03 | 4.75 | 2.01–10.7 | 8.69 | 1913 bp | 50.61% | 2.64E‐06 | ND | ND |
| SLC25A32 | FOCM | MA | 5 | 5 | 35 | 29 | 2.69E‐03 | 5.9 | 2.16–15.46 | 13.3 | 3228 bp | 36.96% | 2.65E‐05 | ND | YES |
| SDC1 | GHOS | EA | 4 | 5 | 14 | 76 | 2.79E‐03 | 5.56 | 2.12–13.44 | 11.33 | 3293 bp | 57.56% | 6.44E‐01 | ND | ND |
| GPX2 | GHOS | EA | 3 | 6 | 37 | 114 | 3.13E‐03 | 4.46 | 1.89–10 | 8.11 | 1298 bp | 47.98% | 1.42E‐02 | ND | ND |
| SLC7A1 | FOCM | MA | 3 | 4 | 33 | 21 | 5.30E‐03 | 6.5 | 2.03–19.35 | 17.32 | 7343 bp | 47.44% | 8.12E‐01 | ND | ND |
| WDR82 | FOCM | EA | 2 | 2 | 8 | 8 | 5.94E‐03 | 20.94 | 3.18–101.58 | 98.4 | 4292 bp | 44.88% | 8.92E‐01 | ND | ND |
| ARNT | GHOS | MA | 5 | 15 | 68 | 237 | 6.77E‐03 | 2.2 | 1.23–3.79 | 2.56 | 4928 bp | 41.21% | 9.25E‐01 | ND | YES |
| MC1R | FOCM | MA | 13 | 39 | 67 | 844 | 7.60E‐03 | 1.66 | 1.16–2.36 | 1.2 | 3099 bp | 58.16% | 2.50E‐07 | ND | ND |
| PTPRN2 | GHOS | EA | 6 | 6 | 59 | 141 | 8.33E‐03 | 3.6 | 1.53–7.99 | 6.46 | 4949 bp | 52.12% | 4.07E‐01 | ND | ND |
| ICMT | FOCM | MA | 2 | 4 | 7 | 25 | 9.09E‐03 | 5.46 | 1.73–15.48 | 13.76 | 4815 bp | 49.59% | 9.49E‐01 | Caud12>13 2x | ND |
| P4HB | GHOS | MA | 6 | 7 | 55 | 75 | 9.22E‐03 | 3.2 | 1.44–6.89 | 5.44 | 2578 bp | 55.79% | 9.90E‐01 | ND | ND |
| DUOX1 | GHOS | MA | 12 | 30 | 151 | 614 | 9.52E‐03 | 1.73 | 1.17–2.57 | 1.4 | 5679 bp | 52.90% | 2.46E‐14 | ND | ND |
| POMC | GHOS | EA | 3 | 9 | 21 | 293 | 1.04E‐02 | 2.61 | 1.28–5.18 | 3.9 | 1486 bp | 51.16% | 4.03E‐03 | ND | ND |
| SERINC1 | FOCM | MA | 3 | 6 | 42 | 59 | 1.08E‐02 | 3.48 | 1.45–8.26 | 6.81 | 3202 bp | 35.93% | 1.98E‐01 | ND | ND |
| HELLS | FOCM | EA | 3 | 7 | 46 | 196 | 1.09E‐02 | 3.03 | 1.39–6.39 | 5 | 3287 bp | 38.96% | 9.99E‐01 | Caud12<13 2x | ND |
| EDN1 | GHOS / FOCM | MA | 2 | 2 | 18 | 4 | 1.15E‐02 | 16.95 | 2.26–91.45 | 89.19 | 2100 bp | 42.83% | 6.59E‐02 | Caud12<13 2x | ND |
| SLC19A2 | FOCM | MA | 4 | 5 | 41 | 43 | 1.19E‐02 | 3.97 | 1.48–10.26 | 8.77 | 3638 bp | 38.72% | 1.51E‐02 | Caud12<13 2x | ND |
| NR1H4 | GHOS / FOCM | EA | 4 | 10 | 37 | 353 | 1.19E‐02 | 2.41 | 1.25–4.55 | 3.3 | 2452 bp | 39.74% | 7.41E‐01 | ND | ND |
| GALR2 | FOCM | EA | 3 | 6 | 24 | 153 | 1.20E‐02 | 3.32 | 1.41–7.63 | 6.22 | 1357 bp | 64.59% | 3.86E‐02 | ND | ND |
| CAP2 | FOCM | EA | 1 | 4 | 47 | 71 | 1.22E‐02 | 4.75 | 1.57–13.02 | 11.45 | 3027 bp | 42.32% | 2.78E‐01 | Caud12<13 2x | ND |
| UCP1 | GHOS | MA | 7 | 8 | 30 | 100 | 1.26E‐02 | 2.75 | 1.22–5.66 | 4.44 | 1000 bp | 39.65% | 1.99E‐08 | ND | ND |
| CSRP3 | GHOS | MA | 2 | 5 | 32 | 44 | 1.30E‐02 | 3.88 | 1.45–9.99 | 8.54 | 1464 bp | 42.88% | 1.02E‐02 | ND | ND |
| SELENOS | GHOS | MA | 1 | 10 | 25 | 146 | 1.47E‐02 | 2.36 | 1.2–4.46 | 3.27 | 1417 bp | 45.06% | NA | ND | ND |
| RPH3AL | GHOS | EA | 5 | 8 | 32 | 265 | 1.67E‐02 | 2.56 | 1.16–5.21 | 4.04 | 2754 bp | 54.25% | 1.37E‐10 | Caud12only | ND |
| PIWIL2 | FOCM | EA | 9 | 21 | 108 | 1014 | 1.73E‐02 | 1.79 | 1.13–2.82 | 1.7 | 4340 bp | 42.78% | 1.66E‐02 | Caud12>13 2x | ND |
| NSUN2 | FOCM | MA | 6 | 7 | 82 | 87 | 1.86E‐02 | 2.76 | 1.25–6.1 | 4.85 | 3372 bp | 43.29% | 9.77E‐01 | Caud12=13 2x | ND |
| GATA4 | GHOS | MA | 3 | 3 | 29 | 17 | 1.88E‐02 | 6 | 1.49–20.51 | 19.02 | 3467 bp | 48.32% | 9.43E‐01 | Caud12<13 2x | YES |
| SHMT2 | FOCM | MA | 4 | 8 | 65 | 110 | 2.05E‐02 | 2.5 | 1.11–5.1 | 3.99 | 2357 bp | 56.68% | 1.75E‐02 | Caud12<13 2x | ND |
| GSTO1 | FOCM | EA | 2 | 2 | 13 | 17 | 2.10E‐02 | 9.86 | 1.62–38.7 | 37.09 | 1057 bp | 41.43% | 1.17E‐02 | ND | ND |
| BRF2 | GHOS | MA | 5 | 8 | 48 | 111 | 2.15E‐02 | 2.47 | 1.1–5.05 | 3.96 | 2000 bp | 49.89% | 4.58E‐10 | Caud12<13 2x | ND |
| PRDX1 | GHOS | EA | 3 | 3 | 28 | 48 | 2.27E‐02 | 5.25 | 1.38–16.77 | 15.4 | 1235 bp | 47.46% | 9.49E‐07 | Caud12<13 2x | ND |
| MRAP | FOCM | EA | 2 | 2 | 9 | 18 | 2.32E−02 | 9.31 | 1.53–36.98 | 35.45 | 1000 bp | 46.36% | 6.02E‐01 | ND | ND |
| STOML2 | FOCM | MA | 2 | 5 | 29 | 52 | 2.37E−02 | 3.28 | 1.24–8.25 | 7.02 | 1431 bp | 53.10% | 7.58E‐01 | ND | ND |
| GUCY2D | FOCM | EA | 5 | 8 | 90 | 286 | 2.47E−02 | 2.37 | 1.08–4.81 | 3.73 | 3623 bp | 55.58% | 3.59E‐02 | ND | ND |
| EHMT2 | FOCM | MA | 4 | 7 | 94 | 93 | 2.52E−02 | 2.58 | 1.17–5.67 | 4.5 | 4238 bp | 57.71% | 5.97E‐02 | ND | YES |
| AMT | FOCM | MA | 4 | 11 | 45 | 180 | 2.58E−02 | 2.11 | 1.06–3.91 | 2.85 | 2202 bp | 54.51% | 3.52E‐04 | Caud12=13 2x | YES |
| ARL6IP5 | GHOS / FOCM | MA | 3 | 4 | 26 | 36 | 2.74E−02 | 3.79 | 1.22–10.68 | 9.46 | 2128 bp | 42.50% | 3.02E‐01 | Caud12only | ND |
| ASZ1 | FOCM | MA | 4 | 6 | 45 | 74 | 2.76E−02 | 2.77 | 1.16–6.42 | 5.26 | 1865 bp | 35.27% | 4.46E‐06 | ND | ND |
| AVP | FOCM | MA | 1 | 1 | 2 | 0 | 2.88E−02 | ∞ | 1.77–∞ | ∞ | 619 bp | 67.96% | 1.85E‐01 | ND | ND |
| EZH1 | FOCM | EA | 3 | 5 | 33 | 139 | 2.89E−02 | 3.03 | 1.17–7.39 | 6.22 | 4689 bp | 45.44% | 5.04E‐03 | ND | ND |
| SETDB1 | FOCM | EA | 5 | 8 | 77 | 295 | 2.89E−02 | 2.3 | 1.05–4.66 | 3.61 | 4446 bp | 44.16% | 1.00E+00 | Caud12<13 2x | ND |
| TCN1 | FOCM | EA | 3 | 3 | 31 | 54 | 3.03E−02 | 4.66 | 1.23–14.71 | 13.48 | 1567 bp | 39.60% | 1.27E‐15 | ND | ND |
| PSIP1 | GHOS | EA | 1 | 4 | 48 | 95 | 3.04E−02 | 3.54 | 1.18–9.51 | 8.33 | 3391 bp | 37.88% | 9.73E‐01 | ND | ND |
| GALR1 | FOCM | MA | 4 | 5 | 38 | 56 | 3.07E−02 | 3.05 | 1.15–7.59 | 6.44 | 2787 bp | 43.70% | 1.06E‐03 | ND | ND |
| GUCA1A | FOCM | MA | 3 | 5 | 24 | 56 | 3.07E−02 | 3.05 | 1.15–7.59 | 6.44 | 2331 bp | 51.23% | 7.91E‐03 | ND | ND |
| STXBP5L | GHOS | MA | 9 | 11 | 108 | 188 | 3.18E−02 | 2.01 | 1.02–3.73 | 2.72 | 9365 bp | 36.35% | 1.00E+00 | ND | ND |
| SLC32A1 | FOCM | MA | 4 | 5 | 42 | 57 | 3.27E−02 | 2.99 | 1.13–7.44 | 6.31 | 2574 bp | 60.86% | NA | ND | ND |
| FOLR2 | FOCM | EA | 4 | 3 | 21 | 56 | 3.31E−02 | 4.5 | 1.18–14.13 | 12.94 | 1131 bp | 48.88% | 3.53E‐06 | ND | ND |
| ADCY1 | FOCM | MA | 4 | 4 | 67 | 39 | 3.46E−02 | 3.49 | 1.13–9.73 | 8.59 | 12499 bp | 47.64% | 1.00E+00 | ND | ND |
| WDR77 | FOCM | EA | 2 | 2 | 17 | 23 | 3.52E−02 | 7.28 | 1.22–29.28 | 28.06 | 2544 bp | 44.57% | 6.14E‐01 | ND | ND |
| BHMT2 | FOCM | EA | 5 | 5 | 30 | 151 | 3.88E−02 | 2.79 | 1.08–6.78 | 5.7 | 2651 bp | 43.35% | 1.22E‐09 | Caud12only | ND |
| SLC7A9 | FOCM | EA | 4 | 5 | 51 | 151 | 3.88E−02 | 2.79 | 1.08–6.78 | 5.7 | 1785 bp | 46.62% | 1.62E‐01 | ND | ND |
| ALAD | GHOS | MA | 6 | 6 | 36 | 81 | 3.93E−02 | 2.53 | 1.06–5.82 | 4.75 | 3349 bp | 51.45% | 1.72E‐01 | ND | ND |
| FANCC | GHOS | MA | 7 | 12 | 49 | 213 | 3.95E−02 | 1.94 | 1.06–3.55 | 2.49 | 4592 bp | 41.78% | 4.52E‐08 | Caud12>13 2x | ND |
| SLC46A1 | FOCM | MA | 4 | 4 | 18 | 41 | 3.99E−02 | 3.32 | 1.08–9.18 | 8.1 | 6489 bp | 52.64% | 8.40E‐02 | ND | ND |
| UBE3A | GHOS | MA | 1 | 7 | 26 | 104 | 4.11E−02 | 2.3 | 1.05–5.02 | 3.98 | 5276 bp | 36.21% | 9.99E‐01 | ND | ND |
| ADCY10 | FOCM | EA | 5 | 6 | 119 | 207 | 4.22E−02 | 2.45 | 1.04–5.56 | 4.51 | 5469 bp | 41.76% | 2.31E‐27 | ND | ND |
| SEPSECS | FOCM | MA | 3 | 5 | 47 | 62 | 4.35E−02 | 2.75 | 1.04–6.78 | 5.74 | 5645 bp | 40.63% | 6.91E‐06 | ND | ND |
| OCA2 | FOCM | EA | 7 | 14 | 90 | 665 | 4.46E−02 | 1.79 | 1.03–3.09 | 2.05 | 3140 bp | 43.49% | 7.65E‐12 | ND | ND |
| MMACHC | FOCM | EA | 6 | 7 | 41 | 267 | 4.58E−02 | 2.21 | 1.02–4.63 | 3.61 | 2901 bp | 47.99% | 1.89E‐13 | ND | ND |
| METTL3 | FOCM | MA | 2 | 6 | 47 | 86 | 4.94E−02 | 2.38 | 1–5.45 | 4.45 | 2022 bp | 42.49% | 1.27E‐02 | ND | ND |
Gene is common gene name. Network is gene network that gene originated from in analysis. Ethnicity is case ethnicity in which gene reached significance. Variant Count is the number of unique qualifying variant loci found in the gene for the given ethnicity or its matched control. Case individual count is the exact number of case individuals harboring at least one of the identified variants for the gene in this ethnicity. Control individual estimation is the estimated number of control individuals harboring one of the qualifying variants identified as outlined in the Methods. P‐alue, Odds Ratio, Confidence Interval, and CI Range are all products of the statistical output of the R package for Fisher Exact Test. Transcript length, GC percentage, and pLI score are collected from public databases for the canonical transcript for each gene. Neural Tube Expression/Stage reflects if transcript was detected during Carnegie Stages 12 and/or 13 and the comparative contributions. MGI Mouse Phenotype reports annotation of the gene in the mouse genome informatics database with a neural tube phenotype including: open neural tube, abnormal neural tube closure, or abnormal neural tube morphology. OMIM accession numbers and GenBank versions are found in Tables S4 and S5. Abbreviations: CI, Confidence Interval; EA, European Americans; MA, Mexican Americans; MGI, Mouse Genome Informatics (Bult et al., 2019);NA, not available; ND, not detected/not described.
3.2.1. FOCM
Of the 835 genes in the FOCM network, 631 had qualifying variants passing filters. 45 of these 631 genes containing variants in the FOCM network reached nominal significance. All genes reaching nominal significance were unique to an ethnicity, 24 in MA and 21 in EA. Of these 7 in the MA and 4 in the EA population are expressed during Carnegie stages 12 or 13 (Table 1). About 48% of MA and 41% of EA cases had a variant in at least one nominally significant gene in the FOCM network (Figures 3 and 4A). Interestingly, 71% of the nominally significant FOCM genes contained non‐private variants, variants found in more than one individual (Table S1).
FIGURE 3.

The number of nominally significant genes containing a qualifying variant per individual. Graphs total the number of individual cases having qualifying variants in variable numbers of nominally significant genes of the glucose homeostasis and oxidative stress network (GHOS) [blue], folate and one‐carbon metabolism network (FOCM) [orange], and total between the two networks (GHOS + FOCM) [grey] for both Mexican Americans and European Americans. n provides the population size for each ethnicity.
FIGURE 4.

Proportion of qualifying variants and contributing individuals per gene in Folate and One‐Carbon Metabolism network (a) and Glucose Homeostasis and Oxidative Stress (b). Top Rows A and B. Graphs show the total number of qualifying variants (number following “,”) in each nominally significant gene by ethnicity. The central bar graph shows the total number of variants compared between ethnicities (blue bars). Bottom Rows A and B. Similar to top rows, showing the number of individual cases with at least one qualifying variant in the nominally significant genes by ethnicity. The central bar graph shows the total number of affected individuals compared between ethnicities (red bars). Colors are matched between top row and bottom row pairs by ethnicity but not between ethnicities or parts A or B. n provides the population size for each ethnicity.
3.2.2. GHOS
Of the 568 genes in the GHOS network, 458 had qualifying variants passing filters. About 22 of these 458 genes containing variants in the GHOS network reached nominal significance. All genes reaching nominal significance were unique to an ethnicity, 14 in MA and 8 in EA. Of these 5 in the MA and 2 in the EA population are expressed during Carnegie stages 12 or 13 (Table 1). 41% of MA and 17.5% of EA cases had a variant in at least one nominally significant gene in the GHOS network (Figures 3 and 4B). Overall, 77% of the GHOS genes reaching nominal significance had non‐private variants (Table S1).
3.3. Pathway enrichment
To identify broader categories of interest in regards to these two networks, nominally significant genes were annotated with gene ontology (GO). Within FOCM, 17 of the 93 GO terms used to create the gene list had nominally significant genes in EA cases and 27 of 93 in MA cases. Of these, only 7 in EA and 7 in MA had more than one gene with that ontology. Also, of the 33 GO terms in the original GO list for FOCM generation having nominally significant genes, 11 were found in both populations. The GO terms with most nominally significant genes involved methylation/methyltransferase activity, folic acid transport, and amino acid transport (Table S2).
4. DISCUSSION
Neural tube defects are the second most common complex congenital birth defect and represent a significant financial burden to the medical system. Interventions to date, including federally mandated fortification of cereal grains with folic acid and recommendations for increased folic acid intake prior to conception and during pregnancy, have reduced but not eliminated this disease. We present here the largest sequenced cohort of NTD patients to date and our data provides new genes of interest for evaluation. Furthermore, we propose a unique approach to the use of large publicly available sequencing databases as controls in similar projects.
Overall, we identified 64 genes reaching nominal significance in our data. These genes are of scientific interest, particularly when one considers the complex nature of NTDs with likely environmental and multigenic contributions to disease. Review of the available literature could only provide a previously documented association between these genes and NTD in 6 cases: FOLR2, BHMT, SLC25A32, SLC19A2, AMT, and SLC46A1 (OMIM: 136425, 602888, 610815, 603941, 238310, and 611672). Additionally, EHMT2, ARNT, and GATA4 (OMIM: 604599, 126110, and 600576) have been demonstrated in mouse models to confer an NTD phenotype. Thus, we present 55 new genes for consideration as possible risk genes for NTD. Of these, 16 have predicted pLI >0.5 implying relative intolerance to variation and 16 are shown to be expressed during neural tube closure in human. Lastly, four genes are found in both of these groups. SETDB1 and HELLS (OMIM: 604396 and 603946) were significant in the FOCM network of EA and NSUN2 and ICMT (OMIM: 610916 and 605851) in the FOCM network of MA. Of the nine genes previously associated with NTD, two had a pLI >0.5 and three showed expression during human neural tube closure. Only one gene was found in both of these groups, GATA4, which reached significance in the GHOS network for MA. Furthermore, seven of the nine genes were associated with the FOCM network and eight of the nine genes reached significance in the MA cohort.
In evaluation of the FOCM network, three gene ontologies were of interest in both ethnicities; methylation/methyltransferase activity, folic acid transport, and amino acid transport. The predominance of both methylation/methyltransferase activity and folic acid transport provide insight to the possible mechanism of persistence of NTDs in the setting of folic acid supplementation. Our findings in these areas of FOCM suggest that either absorption of folate or the subsequent utilization of the single carbon unit provided may play a significant role in NTD cases. Furthermore, alternate gene ontology acquisition suggested that histone methylation in particular may be of interest and nine genes reaching nominal significance have also been implicated in glucose metabolism although only two were included in the GHOS network (data not shown, see below).
Findings in the GHOS network showed a preponderance of affect in the MA population out of proportion to the findings in the FOCM network and overall incidence rate of variants between the two populations. Similarly, population studies of the diabetes epidemic in North American showed that Hispanics have the highest prevalence of diabetes. The incidence of disease in this population was the highest of all evaluated ethnicities and nearly twice that seen in non‐Hispanic whites. Furthermore, Hispanics have one of the highest rates of undiagnosed diabetes at nearly 50% (Menke, Casagrande, Geiss, & Cowie, 2015). Taken together, these findings support a role of GHOS network genes in NTD that may be amenable to greater intervention.
Three genes met nominal significance and were independently present in both candidate gene lists: ARL6IP5, NR1H4, and EDN1 (OMIM: 605709, 603826, and 131240). ARL6IP5 encodes for PRA1 family protein 3 that is involved in regulating intracellular concentrations of taurine and glutamate, and also implicated in apoptotic signaling in response to oxidative stress. NR1H4 encodes for a bile acid receptor that functions as a receptor for bile acids with downstream transcriptional regulation affecting bile acid synthesis and transport. It has four known isoforms and has been associated with Notch signaling, glucose homeostasis, and intestinal inflammation. EDN1 encodes for Endothelin‐1, part of the endothelin family that is secreted from the cell and acts as a potent vasoconstrictor.
It is interesting that no genes of interest were shared between the two populations. However, overlap in common gene ontologies of nominally significant genes between the two ethnicities does support a shared mechanism, although possibly at different points in the same pathway. A large majority of individuals had more than two rare damaging variant each in the FOCM and GHOS networks supporting a hypothesis of added effects of damaging variants in a pathway. However, less than 50% were found to carry rare damaging variants in genes at a frequency greater than that seen in the general population. These findings do suggest that there are other factors at play in the pathogenesis of NTDs. Our results do support the hypothesis that these pathways represent significant burden in NTD risk and pathology, especially when considering that over 70% of the genes presented here had variants that were found in more than one individual.
The authors recognize the limitation of the study in the use of public databases rather than simultaneously processed control samples. GnomAD provides control variant frequency for populations similar to our own and the same filtering parameters were applied to our dataset. While genotypic data was not readily available, the use of available allele frequencies and population size assuming Hardy–Weinberg equilibrium provided a reasonable estimation of qualifying variant carrying individuals, based on comparing estimation within our cases to exact counts. Furthermore, if skewing occurred it is an overestimation of control counts, furthering support of the nominally significant findings focused on here.
Overall, we have provided a unique approach in the use of publically available datasets as controls in large sequencing projects. This approach is of particular use when studying rare diseases that typically preclude a case‐control study, but must be limited to disorders readily apparent at birth to avoid inclusion in control exome sets. By matching strict data filtering parameters to those of publicly available datasets, we provide a means of harnessing this information in similar risk evaluation studies. Given the abundance of publicly available data, our outline of data filtering and analysis with independent case sets provides a reasonable approach to further evaluation of rare disease. Furthermore, the data set presented here represents the largest sequenced cohort of NTDs to date. Although the approach may exclude some positively associated genes, the results presented here identified genes previously associated with NTDs and provides new genes of interest in established pathways for further investigation.
CONFLICT OF INTEREST
The authors report no conflicts of interest.
AUTHOR CONTRIBUTIONS
Conceptualization—PH, CB, LH, HN, KSA; Data Curation—PH, CB, LH, MB, KSA; Formal Analysis—PH, CB, LH; Funding Acquisition and Project Administration—JH, ACM, HN, KSA; Investigation—PH, CB, LH, MB, JH; Methodology—PH, CB, LH, JH, HN, KSA; Resources—AA‐K, KSA, HN; Software—PH, CB, LH, KSA; Supervision—HN, KSA; Validation—PH, CB, LH, MB, KSA; Visualization—PH, CB, KSA; Writing—Original Draft Preparation—PH, CB; Writing—Review & Editing—PH, CB, LH, MB, AA‐K, JH, ACM, HN, KSA.
Supporting information
Table S1‐S5
ACKNOWLEDGMENTS
Funding for this project was provided by NIH/NICHD R01HD073434.
Paul Hillman and Craig Baker should be considered joint first author.
DATA AVAILABILITY STATEMENT
Upon publication all variants reported here are available for review at dbSNP (https://www.ncbi.nlm.nih.gov/snp/) under BioProject ID: PRJNA611755.
REFERENCES
- Arth, A. C. , Tinker, S. C. , Simeone, R. M. , Ailes, E. C. , Cragan, J. D. , & Grosse, S. D. (2017). Inpatient hospitalization costs associated with birth defects among persons of all ages — United States, 2013. MMWR. Morbidity and Mortality Weekly Report, 66(02), 41–46. 10.15585/mmwr.mm6602a1 [DOI] [PMC free article] [PubMed] [Google Scholar]
- Au, K. S. , Ashley‐Koch, A. , & Northrup, H. (2010). Epidemiologic and genetic aspects of spina bifida and other neural tube defects. Developmental Disabilities Research Reviews, 16(1), 6–15. 10.1002/ddrr.93 [DOI] [PMC free article] [PubMed] [Google Scholar]
- Au, K. S. , Findley, T. O. , & Northrup, H. (2017). Finding the genetic mechanisms of folate deficiency and neural tube defects—Leaving no stone unturned. American Journal of Medical Genetics, Part A, 173(11), 3042–3057. 10.1002/ajmg.a.38478 [DOI] [PMC free article] [PubMed] [Google Scholar]
- Au, K. S. , Tran, P. X. , Tsai, C. C. , O’Byrne, M. R. , Lin, J. , Morrison, A. C. , … Northrup, H. (2008). Characteristics of a spina bifida population including North American Caucasian and Hispanic individuals. Birth Defects Research. Part A, Clinical and Molecular Teratology, 82(10), 692–700. 10.1002/bdra.20499 [DOI] [PMC free article] [PubMed] [Google Scholar]
- Blencowe, H. , Kancherla, V. , Moorthie, S. , Darlison, M. W. , & Modell, B. (2018). Estimates of global and regional prevalence of neural tube defects for 2015: A systematic analysis. Annals of the New York Academy of Sciences, 1414(1), 31–46. 10.1111/nyas.13548 [DOI] [PubMed] [Google Scholar]
- Blom, H. J. (2009). Folic acid, methylation and neural tube closure in humans. Birth Defects Research Part A ‐ Clinical and Molecular Teratology, 85(4), 295–302. 10.1002/bdra.20581 [DOI] [PubMed] [Google Scholar]
- Boulet, S. L. , Yang, Q. , Mai, C. , Kirby, R. S. , Collins, J. S. , Robbins, J. M. , … Mulinare, J. (2008). Trends in the postfortification prevalence of spina bifida and anencephaly in the United States. Birth Defects Research Part A ‐ Clinical and Molecular Teratology, 82(7), 527–532. 10.1002/bdra.20468 [DOI] [PubMed] [Google Scholar]
- Bult, C. J. , Blake, J. A. , Smith, C. L. , Kadin, J. A. , Richardson, J. E. , Anagnostopoulos, A. , … Zhu, Y. (2019). Mouse Genome Database (MGD) 2019. Nucleic Acids Research, 47(D1), D801–D806. 10.1093/nar/gky1056 [DOI] [PMC free article] [PubMed] [Google Scholar]
- Carbon, S. , Douglass, E. , Dunn, N. , Good, B. , Harris, N. L. , Lewis, S. E. , … Westerfield, M. (2019). The gene ontology resource: 20 years and still going strong. Nucleic Acids Research, 47(D1), D330–D338. 10.1093/nar/gky1055 [DOI] [PMC free article] [PubMed] [Google Scholar]
- Chang, H. , Zhang, T. , Zhang, Z. , Bao, R. , Fu, C. , Wang, Z. , … Wu, J. (2011). Tissue‐specific distribution of aberrant DNA methylation associated with maternal low‐folate status in human neural tube defects. Journal of Nutritional Biochemistry, 22(12), 1172–1177. 10.1016/j.jnutbio.2010.10.003 [DOI] [PubMed] [Google Scholar]
- Chi, Y. I. , Pei, L. , Chen, G. , Song, X. , Zhao, A. , Chen, T. , … Jia, W. (2014). Metabonomic profiling of human placentas reveals different metabolic patterns among subtypes of neural tube defects. Journal of Proteome Research, 13(2), 934–945. 10.1021/pr4009805 [DOI] [PubMed] [Google Scholar]
- Correa, A. , Gilboa, S. M. , Besser, L. M. , Botto, L. D. , Moore, C. A. , Hobbs, C. A. , … Reece, E. A. (2008). Diabetes mellitus and birth defects. American Journal of Obstetrics and Gynecology, 199(3), 237.e1–237.e9. 10.1016/j.ajog.2008.06.028 [DOI] [PMC free article] [PubMed] [Google Scholar]
- Crider, K. S. , Yang, T. P. , Berry, R. J. , & Bailey, L. B. (2012). Folate and DNA methylation: a review of molecular mechanisms and the evidence for folate’s role. Advances in Nutrition, 3(1), 21–38. 10.3945/an.111.000992 [DOI] [PMC free article] [PubMed] [Google Scholar]
- Davidson, C. M. , Northrup, H. , King, T. M. , Fletcher, J. M. , Townsend, I. , Tyerman, G. H. , & Kit, S. A. (2008). Genes in glucose metabolism and association with spina bifida. Reproductive Sciences, 15(1), 51–58. 10.1177/1933719107309590 [DOI] [PMC free article] [PubMed] [Google Scholar]
- de Bakker, B. S. , Driessen, S. , Boukens, B. J. D. , van den Hoff, M. J. B. , & Oostra, R. J. (2017). Single‐site neural tube closure in human embryos revisited. Clinical Anatomy, 30(7), 988–999. 10.1002/ca.22977 [DOI] [PubMed] [Google Scholar]
- Dong, D. , Albert Reece, E. , Lin, X. , Wu, Y. , Ariasvillela, N. , & Yang, P. (2016). New development of the yolk sac theory in diabetic embryopathy: Molecular mechanism and link to structural birth defects. American Journal of Obstetrics and Gynecology, 214(2), 192–202. 10.1016/j.ajog.2015.09.082 [DOI] [PMC free article] [PubMed] [Google Scholar]
- Ebara, S. (2017). Nutritional role of folate. Congenital Anomalies, 57(5), 138–141. 10.1111/cga.12233 [DOI] [PubMed] [Google Scholar]
- Gabbay‐Benziv, R. (2015). Birth defects in pregestational diabetes: Defect range, glycemic threshold and pathogenesis. World Journal of Diabetes, 6(3), 481 10.4239/wjd.v6.i3.481 [DOI] [PMC free article] [PubMed] [Google Scholar]
- Greene, N. D. E. , & Copp, A. J. (2014). Neural tube defects. Annual Review of Neuroscience, 37, 221–242. 10.1146/annurev-neuro-062012-170354 [DOI] [PMC free article] [PubMed] [Google Scholar]
- GROUP MRC VITAMIN STUDY RESEARCH (1991). Prevention of neural tube defects: results of the Medical Research Council Vitamin Study. MRC Vitamin Study Research Group. Lancet (London, England), 338(8760), 131–137. [PubMed] [Google Scholar]
- Guo, M. H. , Plummer, L. , Chan, Y. M. , Hirschhorn, J. N. , & Lippincott, M. F. (2018). Burden testing of rare variants identified through exome sequencing via publicly available control data. American Journal of Human Genetics, 103(4), 522–534. 10.1016/j.ajhg.2018.08.016 [DOI] [PMC free article] [PubMed] [Google Scholar]
- Krupp, D. R. , Xu, P.‐T. , Thomas, S. , Dellinger, A. , Etchevers, H. C. , Vekemans, M. … Gregory, S. G. (2012). Transcriptome profiling of genes involved in neural tube closure during human embryonic development using long serial analysis of gene expression (long‐SAGE). Birth Defects Research Part A: Clinical and Molecular Teratology, 94(9), 683–692. 10.1002/bdra.23040 [DOI] [PMC free article] [PubMed] [Google Scholar]
- Lek, M. , Karczewski, K. J. , Minikel, E. V. , Samocha, K. E. , Banks, E. , Fennell, T. , … MacArthur, D. G. (2016). Analysis of protein‐coding genetic variation in 60,706 humans. Nature, 536(7616), 285–291. 10.1038/nature19057 [DOI] [PMC free article] [PubMed] [Google Scholar]
- Liu, S. , Evans, J. , MacFarlane, A. J. , Ananth, C. V. , Little, J. , Kramer, M. S. , & Joseph, K. S. (2019). Association of maternal risk factors with the recent rise of neural tube defects in Canada. Paediatric and Perinatal Epidemiology, 33(2), 145–153. 10.1111/ppe.12543 [DOI] [PubMed] [Google Scholar]
- Liu, X. , Wu, C. , Li, C. , & Boerwinkle, E. (2016). dbNSFP v3.0: A one‐stop database of functional predictions and annotations for human nonsynonymous and splice‐site SNVs. Human Mutation, 37(3), 235–241. 10.1002/humu.22932 [DOI] [PMC free article] [PubMed] [Google Scholar]
- Lynch, S. A. (2005). Non‐multifactorial neural tube defects. American Journal of Medical Genetics Part C: Seminars in Medical Genetics, 135 C(1), 69–76. 10.1002/ajmg.c.30055 [DOI] [PubMed] [Google Scholar]
- Menke, A. , Casagrande, S. , Geiss, L. , & Cowie, C. C. (2015). Prevalence of and trends in diabetes among adults in the United States, 1988–2012. JAMA, 314(10), 1021–1029. 10.1001/jama.2015.10029 [DOI] [PubMed] [Google Scholar]
- Nguyen, M. P. , Lupo, P. J. , Northrup, H. , Morrison, A. C. , Cirino, P. T. , & Au, K. S. (2017). Maternal gene‐micronutrient interactions related to one‐carbon metabolism and the risk of myelomeningocele among offspring. Birth Defects Research, 109(2), 99–105. 10.1002/bdra.23538 [DOI] [PMC free article] [PubMed] [Google Scholar]
- Ornoy, A. , Koren, G. , & Yanai, J. (2018). Is post exposure prevention of teratogenic damage possible: Studies on diabetes, valproic acid, alcohol and anti folates in pregnancy: Animal studies with reflection to human. Reproductive Toxicology, 80(May), 92–104. 10.1016/j.reprotox.2018.05.006 [DOI] [PubMed] [Google Scholar]
- R Core Team , (2019). R: A language and environment for statistical computing. Vienna, Austria: R Foundation for Statistical Computing; http://www.R‐project.org/. [Google Scholar]
- Rentzsch, P. , Witten, D. , Cooper, G. M. , Shendure, J. , & Kircher, M. (2019). CADD: Predicting the deleteriousness of variants throughout the human genome. Nucleic Acids Research, 47(D1), D886–D894. 10.1093/nar/gky1016 [DOI] [PMC free article] [PubMed] [Google Scholar]
- Richards, L. , Aziz, N. , Bale, S. , David Bick, M. , Soma Das, P. , & Gastier‐Foster, J. … Rehm, H. L. (2015). Standards and guidelines for the interpretation of sequence variants: A joint consensus recommendation of the American College of Medical Genetics and Genomics and the Association for Molecular Pathology Sue. Genetics in Medicine, 17(5), 405–424. 10.1038/gim.2015.30.Standards [DOI] [PMC free article] [PubMed] [Google Scholar]
- Stothard, K. J. , Tennant, P. W. G. , Bell, R. , & Rankin, J. (2009). Maternal overweight and obesity and the risk of congenital anomalies. JAMA, 301(6), 636 10.1001/jama.2009.113 [DOI] [PubMed] [Google Scholar]
- Williams, J. , Mai, C. T. , Mulinare, J. , Isenburg, J. , Flood, T. J. , Ethen, M. , … Centers for Disease Control and Prevention , (2015). Updated estimates of neural tube defects prevented by mandatory folic Acid fortification ‐ United States, 1995–2011. MMWR. Morbidity and Mortality Weekly Report, 64(1), 1–5. [PMC free article] [PubMed] [Google Scholar]
- Xu, C. , Li, X. , Wang, F. , Weng, H. , & Yang, P. (2013). Trehalose prevents neural tube defects by correcting maternal diabetes‐suppressed autophagy and neurogenesis. American Journal of Physiology‐Endocrinology and Metabolism, 305(5), E667–E678. 10.1152/ajpendo.00185.2013 [DOI] [PMC free article] [PubMed] [Google Scholar]
- Yang, P. , Albert Reece, E. , Wang, F. , & Gabbay‐Benziv, R. (2015). Decoding the oxidative stress hypothesis in diabetic embryopathy through proapoptotic kinase signaling. American Journal of Obstetrics and Gynecology, 212(5), 569–579. 10.1016/j.ajog.2014.11.036 [DOI] [PMC free article] [PubMed] [Google Scholar]
- Yazdy, M. M. , Liu, S. , Mitchell, A. A. , & Werler, M. M. (2010). Maternal dietary glycemic intake and the risk of neural tube defects. American Journal of Epidemiology, 171(4), 407–414. 10.1093/aje/kwp395 [DOI] [PMC free article] [PubMed] [Google Scholar]
- Zaganjor, I. , Sekkarie, A. , Tsang, B. L. , Williams, J. , Razzaghi, H. , Mulinare, J. , … Rosenthal, J. (2016). Describing the prevalence of neural tube defects worldwide: A systematic literature review. PLoS One, 11(4), 1–31. 10.1371/journal.pone.0151586 [DOI] [PMC free article] [PubMed] [Google Scholar]
- Zerbino, D. R. , Achuthan, P. , Akanni, W. , Amode, M. R. , Barrell, D. , Bhai, J. , … Flicek, P. (2018). Ensembl 2018. Nucleic Acids Research, 46(D1), D754–D761. 10.1093/nar/gkx1098 [DOI] [PMC free article] [PubMed] [Google Scholar]
- Zohn, I. E. , & Sarkar, A. A. (2008). Chapter 1 modeling neural tube defects in the mouse. Current Topics in Developmental Biology, 84, 1–35. 10.1016/S0070-2153(08)00601-7 [DOI] [PubMed] [Google Scholar]
Associated Data
This section collects any data citations, data availability statements, or supplementary materials included in this article.
Supplementary Materials
Table S1‐S5
Data Availability Statement
Upon publication all variants reported here are available for review at dbSNP (https://www.ncbi.nlm.nih.gov/snp/) under BioProject ID: PRJNA611755.