

Abstract
Background
Metachromatic leukodystrophy (MLD) is a rare inherited lysosomal disorder caused by mutations in ARSA. The biological processes of MLD disease caused by candidate pathogenic mutations in the ARSA gene remain unclear.
Methods
We used whole‐exome sequencing (WES) and Sanger sequencing to identify the pathogenic mutation in a Chinese family. Literature review and protein three‐dimensional structure prediction were performed to analyze the potential pathogenesis of the identified mutations. Overexpression cell models of wild‐type and mutated ARSA genes were constructed. The accumulated sulfatides and expression profiles in the cell models were detected, and a series of bioinformatics analyses were carried out to compare the biological changes caused by the candidate pathogenic mutations.
Results
We identified an ARSA c.925G>A homozygous mutation from a Chinese late‐infantile MLD patient, the first report of this mutation in East Asia. The literature and protein structure analysis indicated that three types of mutations at c.925G (c.925G>A, c.925G>T, c.925G>C) were pathogenic. The overexpression of wild‐type or mutated ARSA genes influenced the accumulation of sulfatides. The co‐expression modules in the mutated cell models were constructed by genes related to calcium signaling and vesicle transport.
Conclusion
Our results identified a pathogenic mutation, ARSA homozygosity c.925G>A, from a Chinese MLD family. The pathogenic mechanism of the ARSA mutation in MLD was identified, which may suggest new approaches to diagnosis and treatment.
We identified an ARSA c.925G>A homozygous mutation from a Chinese late‐infantile MLD patient, the first report of this mutation in east Asia. Overexpression cell models of wild‐type and mutated ARSA genes were constructed to compare the biological changes caused by candidate pathogenic mutations. The results indicate that the mutations at c.925G cause comprehensive molecular changes related to energy metabolism, ion binding, vesicle transport, and transport.

1. INTRODUCTION
Metachromatic leukodystrophy (MLD) is a rare inherited lysosomal disorder caused by recessive gene mutations in ARSA (OMIM: 607574) and PSAP (Kihara, 1982; Kihara, Fluharty, O'Brien, & Fish, 1982; van Rappard, Boelens, & Wolf, 2015; Schielen, Kemper, & Gelb, 2017). There are five allelic forms of MLD (MIM ID: 250100), including late‐infantile, juvenile, adult, partial cerebroside sulfate sulfatase deficiency, and pseudoarylsulfatase A deficiency (Kihara, 1982; Kihara et al., 1982); and two nonallelic forms, including metachromatic leukodystrophy due to saposin B deficiency (MIM ID: #249900) and multiple sulfatase deficiency or juvenile sulfatidosis (MIM ID: #272200), a disorder that combines the features of mucopolysaccharidosis with those of metachromatic leukodystrophy. Although a series of potential therapies, such as hematopoietic stem cell transplantation (Sessa et al., 2016), enzyme replacement therapy (Chen, Gill, Shaw, Ouvrier, & Troedson, 2016), and gene therapy (Meneghini et al., 2016) have been explored, currently there is no curative treatment for this disease.
The most common type of MLD disease is an autosomal recessive inherited lysosomal disorder caused by mutations in the ARSA gene, located on the chromosome 22q13.33, resulting in a deficiency of the enzyme arylsulfatase A. The low activity of arylsulfatase A results in the accumulation of sulfatides in the central and peripheral nervous systems, leading to demyelination (van Rappard et al., 2015). To date, more than 200 ARSA allele types have been reported as ARSA‐causative variants (Cesani et al., 2016).
In the current study, we report a Chinese family with a 2‐year‐old boy who could not sit or walk independently. By whole‐exome sequencing (WES) technology we identified a missense mutation in exon 5 of the ARSA gene (c.925G>A homozygous mutation) in the proband that supported the clinical diagnosis of MLD. This is the first report of this mutation in East Asia. A systematic literature review and bioinformatics analyses were carried out to predict its pathogenicity. Furthermore, transcriptome profiling of overexpression cell models of the wild‐type and mutated ARSA gene was analyzed to explore the potential molecular pathogenesis of the identified mutation.
2. METHODS
2.1. Ethical compliance
The current study was approved by the Ethics Committee (No. 201801001‐1) of the Children's Hospital Affiliated with Nanjing Medical University (Nanjing, China). Prior to the study, written informed consent for genetic tests and publication of the case details were obtained from all adult participants and the parents or the legal guardians of the children involved in the study.
2.2. Mutation analysis
Peripheral blood samples were obtained from the patient and members of his family. WES was performed on all family members and then variant calling was performed with reference to the UCSC hg19 reference genome (http://genome.ucsc.edu/) (Rhead et al., 2010). Single‐nucleotide polymorphisms (SNPs) and small insertions or deletions (indels) were annotated by ANNOVAR (2015Dec14) (Wang, Li, & Hakonarson, 2010). Short insertions or deletions (indels) altering coding sequences or splicing sites were also identified by GATK (3.3.0). Online tools including Polymorphism Phenotyping version 2 (PolyPhen‐2, http://genetics.bwh.harvard.edu/pph2/) (Adzhubei, Jordan, & Sunyaev, 2013), Sorting Intolerant from Tolerant (SIFT, http://sift.jcvi.org/; a score less than 0.05 indicates it is deleterious) (Ng & Henikoff, 2003), and MutationTaster (http://www.mutationtaster.org/) (Schwarz, Rodelsperger, Schuelke, & Seelow, 2010) were used to evaluate whether the amino acid substitutions affected protein function. Variants were identified as nonpathogenic and removed if they fit any of the following criteria: (1) variants with an allele frequency greater than 5%; (2) variants located in introns and not affecting splicing; (3) synonymous variants not affecting splicing; or (4) variants located in the 5’ or 3’ untranslated regions. Then we reviewed the functions and associated OMIM phenotypes of these genes (https://omim.org/). Locus‐specific primers used for PCR amplification and direct sequencing were designed (GenBank: NM_000487.5 and NP_000478.3) and then Sanger sequencing of the PCR products was performed to validate the potentially disease‐causing variants (completed in Oumeng V Medical Laboratory Co., Ltd.) (Yuen et al., 2015). A systematic literature review was performed to obtain published ARSA c.925 mutations in MLD (Figure S1). Amino acid conservation of the ARSA protein in different species was performed by MEGA5 and DNAMAN software. The effect of the amino acid changes in ARSA at p.E309 was predicted by the web server SWISS‐MODEL (https://www.swissmodel.expasy.org).
2.3. Overexpression cell models of the mutated ARSA gene
The human wild‐type ARSA cDNA (cloned in the pCMV6 plasmid) was purchased from OriGene (Cat. No. RC204319, OriGene, USA). The c.925G mutations (c.925G>A, c.925G>T, and c.925G>C, as shown in Figure S2) were introduced into the ARSA plasmid by Site‐Directed Mutagenesis Kit (Cat. No. E0552 s, NEB, USA). The sequences of the mutated cDNA vectors were confirmed using an ABI3500 sequencer (Applied Biosystems Inc.). The ARSA gene sequence was obtained from the NCBI database (GenBank: NM_000487.5 and NP_000478.3). HEK293 cells (CRL‐1573, ATCC) were cultured in high‐glucose DMEM (Cat. No. 11965092, Life Technologies) supplemented with 10% FBS at 37°C and 5% CO2. Cells were seeded 24 hours before transfection and were collected 24 hours after the transfection for qPCR and RNA‐seq. The transient transfection was performed by FuGENE HD transfection reagent (Cat. No. E2311; Promega) and the ratio of the efficiency of transfection was approximately 70%. The ratio of the efficiency of transfection was detected by the fluorescence of HEK293 cells transfected with pCMV6‐GFP fusion plasmid (Figure S3).
2.4. Sulfatides concentration determination
HEK293 cells were seeded 24 hours before transfection and were collected 48 hours after the transfection. Then, the cells were lysed in RIPA lysis buffer and the lysates were centrifuged at 13000 g for 5 min. The supernatant was used for protein concentration measurements and sulfatides concentration determination. The sulfatides concentration of the HEK293 cells was detected by a double antibody sandwich ELISA kit (Cat. No. A098069, Fusheng). Briefly, the cell supernatant was diluted five times and added to ELISA coated wells, and after incubation at 37°C for 30 min, the conjugate reagent was added after washing and then the plate was incubated at 37°C for another 30 min. The TMB substrate and stop buffer were added in sequence. Finally, the absorbance was measured at 450 nm by a microplate reader (Infinite F50, TECAN). The sulfatides concentration of the sample was calculated by a standard curve (set up by standard samples at concentrations of 12.5, 25, 50, 100, and 200 pg/ml), and standardization of the sulfatides amount was performed by dividing it by the amount of total protein in the lysates.
2.5. Transcriptome profiling analysis
RNA sequencing of overexpression cell models and subsequent bioinformatics analysis were completed by the Oumeng V Medical Laboratory. RNA sequencing was performed using the same protocol with poly‐A selection of mRNA following the manufacturer's instructions (Illumina TruSeq). Paired‐end 150 bp sequencing, which was performed on Illumina HiSeq 2000 instruments, generated more than 6G clean bases data for each sample. The raw reads were quality checked using FastQC. Low‐quality bases were trimmed with Trimmomatic (parameters TRAILING: 3 and SLIDINGWINDOW: 4:15). HISAT2 was used to compare clean reads to the reference genome (GRCh37). Then, sequence mapping data (SAM) were converted into bam files and sorted according to the mapped chromosomal location using SAMtools.
The software StringTie was used to calculate the gene expression and outputted the standardized TPM format expression data of all genes in each sample. Expression profiling of all samples was utilized as input data to construct co‐expression networks and obtain a co‐expression gene module using the R package of WGCNA (Langfelder & Horvath, 2008). We calculated the Pearson's correlation between modules and cell treatments to identify the relevant module. In each co‐expression module, the genes were ranked according to the four ranking methods in Centiscape2.2 (Degree, Stress, Closeness, and Radiality), and the overlaps of the first 30 genes of each ranking method were defined as the hub genes. The modules were defined as key modules when they had a correlation >0 and p value<0.05 with at least one of the four types of cells (c.925G, c.925G>A, c.925G>T, c.925G>C).
The significantly enriched biological processes and pathways of the genes in the key modules were analyzed using the Gene Functional Classification Tool (DAVID) v6.8, (Huang et al., 2007). The online tool Metascape was used to perform annotations of the hub genes from the Gene Ontology (GO) database and Kyoto Encyclopedia of Genes and Genomes (KEGG) database. The gene lists from the selected modules were used to build a protein–protein interaction (PPI) network based on BioGrid6, InWeb_IM7, and OmniPath database in the online tool Metascape. We input the correct species (H. sapiens) and chose “Express Analysis” for analysis. Moreover, if the network contains between 3 and 500 proteins, the “Molecular Complex Detection” (MCODE) algorithm was applied to identify densely connected network components.
3. RESULTS
3.1. Clinical and genetic findings
The proband, a 27‐month‐old boy, was unable to stand or walk independently. He showed decreased lower limb muscle strength, decreased muscle tension, and electrophysiological changes in multiple peripheral neurogenic lesions on electromyography. Abnormal white matter symmetry signals in bilateral cerebral hemispheres were observed on MRI images of the proband (Figure 1A). He was the second boy of a healthy, nonconsanguineous couple (Figure 1B). The results of the WES tests and quality controls for all family members are shown in Tables S1–S3. According to the American College of Medical Genetics and Genomics (ACMG) recommendations, which provides interpretative categories of sequence variants and an algorithm for interpretation (Richards et al., 2015), a missense mutation, c.925G>A in exon 5 of the ARSA gene (Figure 1C, Table S4) was identified as a candidate pathogenic locus. Genotypes of the proband showed a homozygous c.925G>A mutation, and those of the parents each showed a heterozygous c.925G>A mutation (I‐1, I‐2, Figure 1C). His healthy brother did not inherit this mutation (II‐1, Figure 1C).
FIGURE 1.
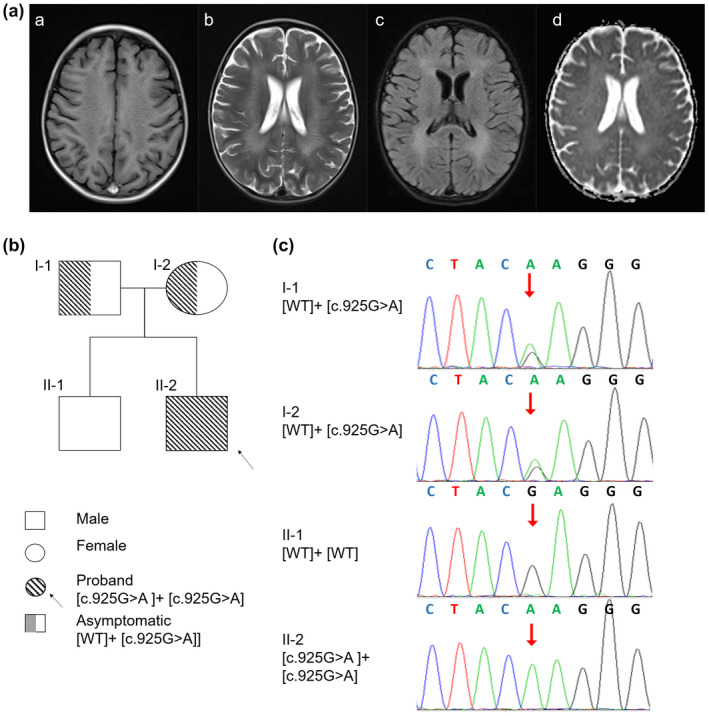
Proband, family, and mutation. (A) MRI from the proband (II‐2). Magnetic resonance imaging (MRI) shows symmetrical deep lesions located in periventricular white matter, which was low signal in T1WI (a), high signal in T2WI (b), low signal in in T2WI (c) and ep2d (d) from the proband (II‐2). (B) Pedigree of the family with MLD patients. The proband was shown in the second generation with the numbers II‐2. The parents of proband are first generation with the number I‐1 and I‐2. The healthy older brother of proband is in the second generation with the number II‐1. (C) Mutational analysis of the arylsulfatase A (ARSA) gene. Genotypes of the proband showed a homozygous c.925G>A mutation, and those of the parents showed a heterozygous c.925G>A mutation. His healthy brother did not inherit this mutation. Nucleotide numbers are derived from cDNA ARSA sequences, GenBank accession numbers: NM_000487.5 and NP_000478.3.
3.2. ARSA mutation (c.925G>A, c.925G>T, c.925G>C) function
c.925G>A (p.E309 K) is highly conserved in multiple species sequences, suggesting its structural and functional importance (Figure 2a). This mutation was predicted to affect the protein features and be disease‐causing by SIFT, PolyPhen2, and MutationTaster (Table S4). The 3D structural model analysis showed that the glutamate at position 309 took part in the formation of a disulfide bond. Hence, three missense mutations (c.925G>A, c.925G>T, c.925G>C) caused amino acid changes (p.E309 K, p.E309* and p.E309Q) and truncated the protein, altering the local charge to prevent the correct positioning of the sulfate group of the substrate (Figure 2). In previous studies, mutations in this site (c.925G>A, c.925G>T, c.925G>C) have been reported to cause late‐infancy MLD. As shown in Table 1, one of the 10 reported patients with MLD disease had adult MLD, and one was diagnosed with juvenile MLD; four patients had c.925G>A homozygous mutations (including the proband in this study) (Cesani et al., 2016; Onder, Sinici, Mujgan Sonmez, Topcu, & Ozkara, 2009), and other patients had heterozygous mutations at this site (Biffi et al., 2008; Cesani et al., 2009; Chen et al., 2018; Grossi et al., 2008; Kreysing et al., 1993).
FIGURE 2.

Multiple sequence alignment (MSA) and 3D structure of ARSA. (a) Multiple sequence alignment showing the sequence alignment of a specific amino acid, and its conservation in other ARSA orthologs (across different species). Nucleotide numbers are derived from cDNA ARSA sequences, GenBank accession numbers: NM_000487.5 and NP_000478.3. (b) Conformational changes induced by the p.E309K and p.E309Q missense mutation in the ARSA protein. (c) Conformational changes induced by the p.E309*, this mutation results in the early termination of codons and truncated proteins.
TABLE 1.
Reported summary of characteristics about the ARSA c.925G mutation Patients.
| Pt No. | Fam | MLD variant | Nat/ Ethnicity | Gender | Age | Symptoms at onset | Genotype | Enzymatic activity | References | |
|---|---|---|---|---|---|---|---|---|---|---|
| Onset | Death | |||||||||
| 1 | — | LI | Caucasian | F | 1y06m | — | Walking difficulties, dysarthria, and spasticity | [c.925 G>A] + [c.925 G>A] | 6% | Cesani et al. (2016) |
| 2 | — | A | Caucasian | M | 40y | — | Peripheral neuropathy | [c.869 G>A] + [c.925 G>C] | — | Cesani et al. (2016) |
| 3 | — | LI | Chinese | F | 4y | — | Psychomotor deterioration, motor regression, Dysarthria, Symmetrical deep WM abnormalities | [c.925 G>A] + [c.427 T>C] | — | Chen et al. (2018) |
| 4 | — | LI | Chinese | F | 0y07m | — | Motor retardation, Peripheral neuropathy, Symmetrical deep WM abnormalities | [c.925 G>A] + [c.302 G>T] | — | Chen et al. (2018) |
| 5a | Sibling | LI | European | M | 01y06m | — | Walking difficulties, Pain attacks, Peripheral neuropathy | [c.304delC] + [c.925 G>A] | 12% | Kreysing et al. (1993) |
| 6a | — | normal | European | F | — | — | Healthy | [WT] + [c.925 G>A] | — | Kreysing et al. (1993) |
| 7a | Sibling | normal | European | M | — | — | Healthy | [WT] + [c.925 G>A] | — | Kreysing et al. (1993) |
| 8 | — | J | European | — | — | — | Progressive and profound motor deficit | [c.418 C>G] + [c.925 G>A] | 0% | Biffi et al. (2008) |
| 9b | Sibling | LI | Chinese | M | 01y05m | — | Walking difficulties, Peripheral neuropathy | [c.925 G>A] + [c.925 G>A] | — | This study |
| 10b | — | normal | Chinese | M | — | — | Healthy | [WT] + [c.925 G>A] | — | This study |
| 11b | — | normal | Chinese | F | — | — | Healthy | [WT] + [c.925 G>A] | — | This study |
| 12 | — | LI | Italian | — | 02y00m | — | Spastic paraparesis Ataxia, Mental deterioration, Symmetrical deep WM abnormalities | [c.925 G>T] + [c.59 C>A] | — | Grossi et al. (2008) |
| 13 | — | LI | Turkish | M | 01y06m | 03y06m | Difficulty in walking, intentional tremor, nystagmus, spontaneous contraction at extremities and wheezing. |
[c.925 G>A] + [c.925 G>A] [c.1178 C>G] + [c.1178 C>G] |
— | Onder et al. (2009) |
| 14 | — | LI | Turkish | F | 02 y06m | 04y00m | Difficulty in walking, positive bilateral Babinski, tremor in hands and mild spasticity |
[c.925 G>A] + [c.925 G>A] [c.1178 C>G] + [c.1178 C>G] |
— | Onder et al. (2009) |
Nucleotide numbers are derived from cDNA ARSA sequences, GenBank accession numbers: NM_000487.5 and NP_000478.3. Mutations are described according to current mutation nomenclature guidelines (http://www.hgvs.org/mutnomen; den Dunnen and Antonarakis, 2000), ascribing the A of the first ATG translational initiation codon as nucleotide +1.
Abbreviations: A, adult; F, Female; Fam, familiarity; J, juvenile; LI, late infantile; M, Male; m, month; Presymp, presymptomatic; Pt, patient; Sibs, sibling; y, year. The symbol “–” indicates data not available.
DNA was isolated from fibroblasts of the patient No. 5, his mother No.6, and his brother No.7.
DNA was isolated from peripheral blood of the patient No. 9, his father No.10 and his mother No.11.
3.3. Amount of accumulated sulfatides in overexpression ARSA cell models
To further elucidate the pathogenesis of the mutations of p.E309, we built overexpression cell models of wild‐type and mutated ARSA gene. Such a cell mutation model approach has been successfully applied to several rare disease studies (Galla et al., 2013). Mock vector (Vector), wild‐type ARSA cDNA plasmid (c.925G), and missense mutated ARSA cDNA plasmid (c.925G>A, c.925G>T, c.925G>C) were transfected into HEK293 cells. RNA‐seq and consequent bioinformatics analyses were performed on the untreated and transfected cells (Figure 3a). As validated by RT‐qPCR, the expression level of ARSA exceeded 20,000‐fold of the wild‐type and the mutated ARSA overexpression cell models compared with the vector (Figure 3b). Compared with the nontransfected HEK293 cells and the cells transfected with mock vectors, the concentration of sulfatides (the substrate of arylsulfatase A) in wild‐type ARSA overexpression cells was decreased and the decreasing tendency was weakened in the c.925G>A mutated ARSA overexpression cells. The sulfatides concentration in the c.925G>C and c.925G>T mutated ARSA overexpression cells was even lower than in the wild‐type ARSA overexpression cells (Figure 3c). The differences among the groups were not statistically significant.
FIGURE 3.

Transcriptomic analysis in overexpression cell models of wild‐type and mutated ARSA gene. (a) Construction of overexpression cell models of wild‐type and mutated ARSA gene. (b) Relative mRNA expression of ARSA gene, GAPDH was used as a loading control. *p < 0.05 in independent Student's t‐test, ***p < 0.001 in independent Student's t‐test (n = 3). (c) Sulfatides concentration in wild‐type cells and ARSA gene overexpression cell models. The standardization of sulfatides amount was performed by dividing it into the amount of total protein of the lysates. No significant difference was found in independent Student's t‐test (n = 3). (d) Hot Map of Characteristic Gene Adjacency in Characteristic Gene Network. Each row and column corresponds to a characteristic gene (marked with the same color). In heatmap, red denotes high adjacency (positive correlation) and blue denotes low adjacency (negative correlation), as shown in the color legend. (e) Characteristic gene module‐trait association of each module. Each row corresponds to a module characteristic gene, and each column corresponds to a cell type (trait). Each cell contains Pearson correlation coefficients (numbers outside parentheses) and associated p values (numbers inside parentheses). According to the color legend, color coding is carried out by correlation. Red indicates positive correlation and blue indicates a negative correlation.
3.4. Co‐expression networks in the overexpression ARSA cell models
A description of the expression profiling in each cell model is shown in Table S5. After the WGCNA analysis, 28 co‐expression modules were identified. The interactions among these 28 co‐expressed modules (reflected by the connectivity of the eigengenes) are shown as a heatmap of the module eigengene adjacency (Figure 3d). Then, the module‐trait relationships with all traits were calculated by correlating the module's eigengenes to the traits of interest (Figure 3e) and were used for the selection of the modules for downstream analysis. Fourteen modules were significantly positively correlated with four ARSA overexpression models (c.925G, c.925G>A, c.925G>T, c.925G>C).
Genes in the modules related to the c.925G>A mutated cell model showed enrichment for functions related to calcium ion‐dependent vesicle fusion, intra‐Golgi vesicle‐mediated transport, ion‐binding, and ion transport. In the c.925G>C mutated cell model, the enriched pathways were associated with the mitochondrial inner membrane, vesicle‐mediated transport, and calcium binding. In the c.925G>T mutated cell model, enrichment in the carbohydrate metabolism process pathway was found (Table 2). The functions of the hub genes in the mutation related modules further supported the above results. The hub genes identified in the c.925G>A module were related to Golgi vesicle‐mediated transport (such as TRAPPC6B, COG5), cell junctions (SUN1), and ion‐binding related genes (such as ZNF583 and TRAPPC6B). The hub genes identified in the c.925G>C module were related to the mitochondrial inner membrane (LRMP and SMIM24), vesicle‐mediated transport (F5, LRMP, CALCR, AAK1, etc.), and calcium binding (F5 and CALCR). The hub genes identified in the c.925G>T module were enriched in the carbohydrate metabolism process pathway (BCL2L1 and PSMC5) (Table S6). In addition to the hub genes, the PPI analysis also showed similar results (Figure 4), which suggested more interacting protein complexes in the mutated cell models than in the wild‐type cell model.
TABLE 2.
Functional enrichment analysis.
| Sample | Enrichment cluster | Enrichment score |
|---|---|---|
| c.925 G | Protease inhibitor | 2.54 |
| Intracellular signal transduction | 1.33 | |
| c.925 G>A | Calcium ion‐dependent vesicle fusion | 1.86 |
| intra‐Golgi vesicle‐mediated transport | 1.79 | |
| Hormone | 1.55 | |
| Cell junction | 1.48 | |
| meta ion‐binding | 1.47 | |
| Ion transport | 1.31 | |
| c.925 G>C | Ankyrin repeat‐containing domain | 1.69 |
| Mitochondrion inner membrane | 1.53 | |
| vesicle‐mediated transport | 1.45 | |
| integral component of membrane | 1.39 | |
| RNA polymerase II transcription factor activity, ligand‐activated sequence‐specific DNA binding | 1.38 | |
| calcium‐binding | 1.33 | |
| phosphatidylinositol phosphorylation | 1.32 | |
| c.925 G>T | carbohydrate metabolic process | 1.51 |
Significantly enriched functional clusters (defined as Enrichment Score of >1.3) as determined by DAVID functional annotation clustering analysis.
FIGURE 4.

Protein–protein interaction networks in the overexpression cell models of wild‐type and mutated ARSA gene.
4. DISCUSSION
We reported a boy with MLD‐like traits. The genetic detection showed that the child carried an ARSA c.925G>A homozygous mutation. This mutation was first reported by the Kreysing research team, and they found that the c.304del C and c.925G>A mutation sites were pathogenic, while a heterozygous mutation of c.925G>A had no typical clinical manifestation in the parents (Kreysing et al., 1993). It has been found that c.925G>A is a complex heterozygous variant with a variety of mutation sites, leading to the occurrence of MLD disease (L. Chen et al., 2018). The homozygous mutation site c.925G>A was first found by Onder in 2 Turkish patients from different families (Onder et al., 2009). In the current study, we report the first homozygous mutation of c.925G>A in a child from East Asia.
The c.925G encodes glutamate at position 309 of the ARSA protein (p.E309), which is highly conserved among different species (Figure 2a). This indicates that amino acid changes at this position would significantly affect the structure and function of the ARSA protein. The crystal structure of human arylsulfatase A shows that the core of the enzyme is composed of two β‐pleated sheets. The major β‐pleated sheet is formed by 10 β‐strands and it is sandwiched between three α‐helices on one side and four on the other (Lukatela et al., 1998). In our study, the 3D structural model analysis showed that p.E309 K was involved in the formation of a disulfide bond.
A previous study reported the biochemical characterization of the ARSA mutation p.E309 K and confirmed the pathogenic nature of the mutation by in vitro mutagenesis of the ARSA gene and transient transfection to Chinese Hamster ovary cells (Ozkan & Ozkara, 2016). Previous studies have described other pathogenic mutations (p.K304R, p.K304 N, p.T306 M, p.Y308H, p.E309Q, p.E309*, p.G310D, p.G311S, and p.R313Q) in the disulfide bond region of ARSA (Cesani et al., 2016), which may cause MLD. The sulfatides concentration in the mutated ARSA overexpression cells also indicated that the mutated ARSA gene (c.925G>A, c.925G>T, c.925G>C) may impact sulfatide metabolism. To sum up, our results suggested that the p.E309 (p.E309 K, p.E309Q, p.E309*) mutation may lead to a change in the spatial steric hindrance and conformation of the ARSA structure, which may change the morphology of the arylsulfatase A protein and impair sulfatide metabolism.
Systematic bioinformatics analyses of expression profiling in ARSA overexpressing cells provided more clues about the complex biological processes that were impacted by the mutations. By co‐expression network analysis, we obtain gene modules influenced by mutations at c.925 of ARSA, and the subsequent hub genes analysis, PPI analysis and functional enrichment analysis indicated that these modules may mostly impact the biological function of calcium signaling and vesicle transport (Figure S4). Perturbations of calcium signaling have been reported to contribute to demyelination and lysosomal storage (Mu, Fowler, & Kelly, 2008; Patil & Maegawa, 2013), and in our study, more than one of the mutation signature modules were enriched in calcium‐related functions. This suggests potential roles of calcium signaling in MLD pathogenic cascades. Vesicle transport‐related genes were also dysregulated in the mutated cell models, showing the importance of vesicle transport in cell catabolism (Platt, Boland, & van der Spoel, 2012), and these ARSA mutations may induce lysosomal dysfunction by impacting vesicle transport.
In conclusion, we identified a late infantile metachromatic leukodystrophy patient carrying a c.925G>A homozygous mutation in the ARSA gene. Functional analysis of the mutation in the current study provides a potential pathogenic mechanism of the ARSA mutation in metachromatic leukodystrophy and suggests possible new strategies for diagnosis and treatment.
CONFLICT OF INTEREST
The authors declare that there is no conflict of interest.
AUTHOR CONTRIBUTION
LG designed and performed the analysis. BJ contributed to patient care and diagnosis. YZ performed experiments. JW designed the analysis drafted the manuscript.
Supporting information
Supplementary Material
ACKNOWLEDGMENTS
This work was supported by the CAS Key Laboratory of Mental Health, Institute of Psychology, Chinese Academy of Sciences. The authors thank the participating individuals for their cooperation and their efforts in collecting the genetic information and DNA specimens.
Guo L, Jin B, Zhang Y,Wang J. Identification of a missense ARSA mutation in metachromatic leukodystrophy and its ppeptides: Future prospects as therapeuticotential pathogenic mechanism. Mol Genet Genomic Med. 2020;8:e1478 10.1002/mgg3.1478
Funding information
This work was supported by CAS Key Laboratory of Mental Health, Institute of Psychology, Chinese Academy of Sciences.
Liyuan Guo and Bo Jin contributed equally to this work
References
- Adzhubei, I. , Jordan, D. M. , & Sunyaev, S. R. (2013). Predicting functional effect of human missense mutations using PolyPhen‐2. Current PROTOCOLS in Human Genetics, 76(Unit7), 7–20. 10.1002/0471142905.hg0720s76 [DOI] [PMC free article] [PubMed] [Google Scholar]
- Biffi, A. , Cesani, M. , Fumagalli, F. , Carro, U. D. , Baldoli, C. , Canale, S. , … Sessa, M. (2008). Metachromatic leukodystrophy - mutation analysis provides further evidence of genotype-phenotype correlation. Clinical Genetics, 74(4), 349–357. 10.1111/j.1399-0004.2008.01058.x [DOI] [PubMed] [Google Scholar]
- Cesani, M. , Capotondo, A. , Plati, T. , Sergi, L. S. , Fumagalli, F. , Roncarolo, M. G. , … Biffi, A. (2009). Characterization of new arylsulfatase A gene mutations reinforces genotype-phenotype correlation in metachromatic leukodystrophy. Human Mutation, 30(10), E936–E945. 10.1002/humu.21093 [DOI] [PubMed] [Google Scholar]
- Cesani, M. , Lorioli, L. , Grossi, S. , Amico, G. , Fumagalli, F. , Spiga, I. , … Biffi, A. (2016). Mutation update of ARSA and PSAP genes causing metachromatic leukodystrophy. Human Mutation, 37(1), 16–27. 10.1002/humu.22919 [DOI] [PubMed] [Google Scholar]
- Chen, L. , Yan, H. , Cao, B. , Wu, Y. , Gu, Q. , Xiao, J. , … Wang, J. (2018). Identification of Novel ARSA Mutations in Chinese Patients with Metachromatic Leukodystrophy. International journal of genomics, 2018, 2361068 10.1155/2018/2361068 [DOI] [PMC free article] [PubMed] [Google Scholar]
- Chen, X. , Gill, D. , Shaw, P. , Ouvrier, R. , & Troedson, C. (2016). Outcome of early juvenile onset metachromatic leukodystrophy after unrelated cord blood transplantation: a case series and review of the literature. Journal of Child Neurology, 31(3), 338–344. 10.1177/0883073815595078 [DOI] [PubMed] [Google Scholar]
- den Dunnen, J. T. , & Antonarakis, S. E. (2000). Mutation nomenclature extensions and suggestions to describe complex mutations: a discussion. Human Mutation, 15, 7–12. [DOI] [PubMed] [Google Scholar]
- Galla, D. , de Gemmis, P. , Anesi, L. , Berto, S. , Dolcetta, D. , & Hladnik, U. (2013). An Italian cohort study identifies four new pathologic mutations in the ARSA gene. Journal of Molecular Neuroscience, 50(2), 284–290. 10.1007/s12031-013-0006-8 [DOI] [PubMed] [Google Scholar]
- Grossi, S. , Regis, S. , Rosano, C. , Corsolini, F. , Uziel, G. , Sessa, M. , … Filocamo, M. (2008). Molecular analysis of ARSA and PSAP genes in twenty-one Italian patients with metachromatic leukodystrophy: identification and functional characterization of 11 novel ARSA alleles. Human Mutation, 29(11), E220–E230. 10.1002/humu.20851 [DOI] [PubMed] [Google Scholar]
- Huang, D. A. , Sherman, B. T. , Tan, Q. , Collins, J. R. , Alvord, W. G. , Roayaei, J. , … Lempicki, R. A. (2007). The DAVID Gene Functional Classification Tool: a novel biological module-centric algorithm to functionally analyze large gene lists. Genome Biology, 8(9), R183 10.1186/gb-2007-8-9-r183 [DOI] [PMC free article] [PubMed] [Google Scholar]
- Kihara, H. (1982). Genetic heterogeneity in metachromatic leukodystrophy. American Journal of Human Genetics, 34(2), 171–181. [PMC free article] [PubMed] [Google Scholar]
- Kihara, H. , Fluharty, A. L. , O'Brien, J. S. , & Fish, C. H. (1982). Metachromatic leukodystrophy caused by a partial cerebroside sulfatase. Clinical Genetics, 21(4), 253–261. 10.1111/j.1399-0004.1982.tb00759.x [DOI] [PubMed] [Google Scholar]
- Kreysing, J. , Bohne, W. , Bosenberg, C. , Marchesini, S. , Turpin, J. C. , Baumann, N. , … Gieselmann, V. (1993). High residual arylsulfatase A (ARSA) activity in a patient with late‐infantile metachromatic leukodystrophy. American Journal of Human Genetics, 53(2), 339–346. [PMC free article] [PubMed] [Google Scholar]
- Langfelder, P. , & Horvath, S. (2008). WGCNA: an R package for weighted correlation network analysis. BMC Bioinformatics, 9, 559 10.1186/1471-2105-9-559 [DOI] [PMC free article] [PubMed] [Google Scholar]
- Lukatela, G. , Krauss, N. , Theis, K. , Selmer, T. , Gieselmann, V. , von Figura, K. , & Saenger, W. (1998). Crystal structure of human arylsulfatase A: the aldehyde function and the metal ion at the active site suggest a novel mechanism for sulfate ester hydrolysis. Biochemistry, 37(11), 3654–3664. 10.1021/bi9714924 [DOI] [PubMed] [Google Scholar]
- Meneghini, V. , Lattanzi, A. , Tiradani, L. , Bravo, G. , Morena, F. , Sanvito, F. , … Gritti, A. (2016). Pervasive supply of therapeutic lysosomal enzymes in the CNS of normal and Krabbe-affected non-human primates by intracerebral lentiviral gene therapy. EMBO Molecular Medicine, 8(5), 489–510. 10.15252/emmm.201505850 [DOI] [PMC free article] [PubMed] [Google Scholar]
- Mu, T. W. , Fowler, D. M. , & Kelly, J. W. (2008). Partial restoration of mutant enzyme homeostasis in three distinct lysosomal storage disease cell lines by altering calcium homeostasis. PLoS Biology, 6(2), e26 10.1371/journal.pbio.0060026 [DOI] [PMC free article] [PubMed] [Google Scholar]
- Ng, P. C. , & Henikoff, S. (2003). SIFT: Predicting amino acid changes that affect protein function. Nucleic Acids Research, 31(13), 3812–3814. 10.1093/nar/gkg509 [DOI] [PMC free article] [PubMed] [Google Scholar]
- Onder, E. , Sinici, I. , Mujgan Sonmez, F. , Topcu, M. , & Ozkara, H. A. (2009). Identification of two novel arylsulfatase A mutations with a polymorphism as a cause of metachromatic leukodystrophy. Neurological Research, 31(1), 60–66. 10.1179/016164108X323762 [DOI] [PubMed] [Google Scholar]
- Ozkan, A. , & Ozkara, H. A. (2016). Metachromatic leukodystrophy: Biochemical characterization of two (p. 307Glu–>Lys, p.318Trp–>Cys) arylsulfatase A mutations. Intractable & Rare Diseases Research, 5(4), 280–283. 10.5582/irdr.2016.01085 [DOI] [PMC free article] [PubMed] [Google Scholar]
- Patil, S. A. , & Maegawa, G. H. (2013). Developing therapeutic approaches for metachromatic leukodystrophy. Drug Design, Development and Therapy, 7, 729–745. 10.2147/DDDT.S15467 [DOI] [PMC free article] [PubMed] [Google Scholar]
- Platt, F. M. , Boland, B. , & van der Spoel, A. C. (2012). The cell biology of disease: Lysosomal storage disorders: the cellular impact of lysosomal dysfunction. Journal of Cell Biology, 199(5), 723–734. 10.1083/jcb.201208152 [DOI] [PMC free article] [PubMed] [Google Scholar]
- Rhead, B. , Karolchik, D. , Kuhn, R. M. , Hinrichs, A. S. , Zweig, A. S. , Fujita, P. A. , … Kent, W. J. (2010). The UCSC Genome Browser database: Update 2010. Nucleic Acids Research, 38(Database issue), D613–619. 10.1093/nar/gkp939 [DOI] [PMC free article] [PubMed] [Google Scholar]
- Richards, S. , Aziz, N. , Bale, S. , Bick, D. , Das, S. , Gastier-Foster, J. , … Rehm, H. L. (2015). Standards and guidelines for the interpretation of sequence variants: a joint consensus recommendation of the American College of Medical Genetics and Genomics and the Association for Molecular Pathology. Genetics in Medicine, 17(5), 405–424. 10.1038/gim.2015.30 [DOI] [PMC free article] [PubMed] [Google Scholar]
- Schielen, P. , Kemper, E. A. , & Gelb, M. H. (2017). Newborn screening for lysosomal storage diseases: A concise review of the literature on screening methods, therapeutic possibilities and regional programs. International Journal of Neonatal Screening, 3(2), 6 10.3390/ijns3020006 [DOI] [PMC free article] [PubMed] [Google Scholar]
- Schwarz, J. M. , Rodelsperger, C. , Schuelke, M. , & Seelow, D. (2010). MutationTaster evaluates disease‐causing potential of sequence alterations. Nature Methods, 7(8), 575–576. 10.1038/nmeth0810-575 [DOI] [PubMed] [Google Scholar]
- Sessa, M. , Lorioli, L. , Fumagalli, F. , Acquati, S. , Redaelli, D. , Baldoli, C. , … Biffi, A. (2016). Lentiviral haemopoietic stem-cell gene therapy in early-onset metachromatic leukodystrophy: an ad-hoc analysis of a non-randomised, open-label, phase 1/2 trial. Lancet, 388(10043), 476–487. 10.1016/S0140-6736(16)30374-9 [DOI] [PubMed] [Google Scholar]
- van Rappard, D. F. , Boelens, J. J. , & Wolf, N. I. (2015). Metachromatic leukodystrophy: Disease spectrum and approaches for treatment. Best Practice & Research Clinical Endocrinology & Metabolism, 29(2), 261–273. 10.1016/j.beem.2014.10.001 [DOI] [PubMed] [Google Scholar]
- Wang, K. , Li, M. , & Hakonarson, H. (2010). ANNOVAR: functional annotation of genetic variants from high-throughput sequencing data. Nucleic Acids Research, 38(16), e164 10.1093/nar/gkq603 [DOI] [PMC free article] [PubMed] [Google Scholar]
- Yuen, R. K. C. , Thiruvahindrapuram, B. , Merico, D. , Walker, S. , Tammimies, K. , Hoang, N. Y. , … Scherer, S. W. (2015). Whole-genome sequencing of quartet families with autism spectrum disorder. Nature Medicine, 21(2), 185–191. 10.1038/nm.3792 [DOI] [PubMed] [Google Scholar]
Associated Data
This section collects any data citations, data availability statements, or supplementary materials included in this article.
Supplementary Materials
Supplementary Material