Figure 3.
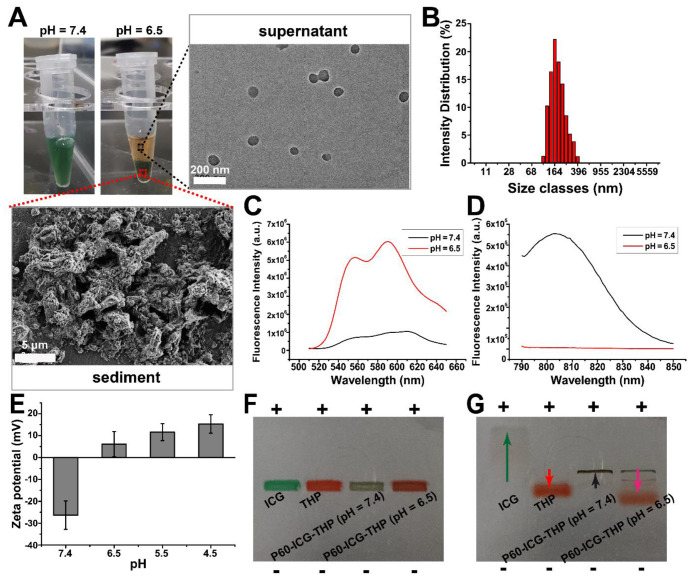
Acidic pH triggers the particle size and charge switch of P60-ICG-THP. (A) The photographs of P60-ICG-THP at different pH values. Magnified regions: TEM image of the supernatant obtained after acid treatment and SEM image of the sediment obtained after acid treatment. (B) Particle diameter of the supernatant at pH 6.5. (C) and (D) The emission intensity of THP and ICG in P60-ICG-THP at different pH values. (F) Zeta potential of P60-ICG-THP at different pH levels. (F) Before and (G) After electrophoresis, +: positive pole, -: negative pole.

