Figure 5.
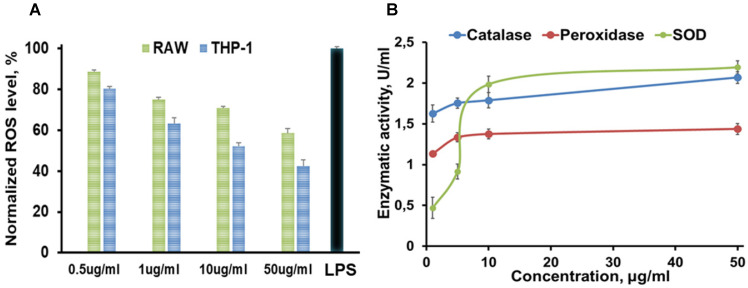
Summarized in vitro results of (A) ROS assay (green: RAW 267.4 and blue: THP-1 cells were treated with 0.5, 1, 10, 50 µg/mL A-nanoceria , and with LPS as a control), where N = 10, error bars = SD; 2.4 and 1.7-fold decrease on ROS in THP-1 and RAW cell, respectively, were detected after treatment with 50 µg/mL A-nanoceria); (B) Enzymatic-like activity of A-nanoceria tested on RAW 267.4 cells at 0.5, 5, 10, and 50 µg/mL A-nanoceria, where N = 5, error bars = SD. The green line: SOD, blue line: catalase, red line: peroxidase. Enzymatic-like activities of A-nanoceria is concentration dependent. SOD and catalase-like activities of A-nanoceria at 50 µg/mL are close.

