

Abstract
Chromatin remodeling complexes have functions in transcriptional regulation and chromosome maintenance, but it is mostly unknown how the function of these normally ubiquitous complexes is specified in the cellular context. Here, we describe that the evolutionary conserved long non‐coding RNA linc‐MYH regulates the composition of the INO80 chromatin remodeler complex in muscle stem cells and prevents interaction with WDR5 and the transcription factor YY1. Linc‐MYH acts as a selective molecular switch in trans that governs the pro‐proliferative function of the ubiquitous INO80 complex but does not affect its role in maintaining genomic stability. The molecular switch is essential for restricting generation of quiescent MuSCs and proliferation of myoblasts in homeostasis and regeneration. Since linc‐MYH is expressed in proliferating myoblasts but not in quiescent MuSCs, we reason that the extent of myoblast proliferation has decisive effects on the size of the quiescent MuSC pool.
Keywords: Chromatin remodeler, lincRNA, muscle stem cell proliferation, non‐coding RNA function, satellite cell
Subject Categories: Chromatin, Epigenetics, Genomics & Functional Genomics; RNA Biology; Regenerative Medicine
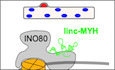
INO80 chromatin remodeler complex function is restricted by the conserved long non‐coding RNA linc‐MYH.
Introduction
Skeletal muscle has a remarkable capacity for regeneration, which critically depends on the function of adult muscle stem cells (MuSCs). MuSCs are located on myofibers under the basal lamina and thus are also named satellite cells (Mauro, 1961). MuSCs are readily identified by the expression of the paired‐box transcription factor Pax7 (Seale et al, 2000; Oustanina et al, 2004) and mostly rest in a quiescent state under homeostatic conditions. Upon injury, they become activated followed by proliferation, differentiation, and fusion to myofibers. Some activated MuSCs do not submit to differentiation during tissue renewal and regeneration but replenish the MuSC pool (Motohashi & Asakura, 2014; Almada & Wagers, 2016). Since inhibition of MuSC proliferation or ablation of MuSCs only has effects on skeletal muscles during regeneration or long‐term maintenance, it had been assumed that MuSCs rarely proliferate under baseline conditions (Murach et al, 2017; Fukada, 2018; van Velthoven & Rando, 2019). However, recent studies demonstrate that approximately 10% of MuSCs become labeled by EdU over a two‐week period, suggesting substantial proliferation of MuSCs even under homeostatic conditions (Pawlikowski et al, 2015).
The definitive amount of MuSCs is determined during postnatal development in individual skeletal muscles and remains stable after reaching adulthood, even after multiple rounds of tissue regeneration (White et al, 2010; Keefe et al, 2015). During aging, the number of MuSCs eventually declines, associated with reduced proliferative capacity of activated MuSCs (Garcia‐Prat et al, 2013). Up to now, the mechanisms determining the size of the quiescent MuSC stem cell pool during homeostasis and after injury are incompletely understood. Different concepts have been proposed, which are mostly based on the frequency of symmetric and asymmetric cell divisions, either immediately after MuSC activation or during the course of MuSC expansion (Almada & Wagers, 2016). However, it is not clear how this relates to the settlement of satellite cell numbers. Expansion of MuSCs is assumed to strongly depend on the control of external signals, derived from the forming stem cell niche, neighboring stromal cells such as fibroadipogenic progenitor cells, or from infiltrating immune cells stimulating or preventing cellular proliferation and differentiation of muscle cells (Baghdadi & Tajbakhsh, 2018; Wosczyna & Rando, 2018). Epigenetic mechanisms also directly contribute to the regulation of MuSC expansion aside from their pivotal roles in controlling chromatin condensation and MuSC quiescence (Segales et al, 2016; Robinson & Dilworth, 2018). For instance, the PRC2 component Ezh2 maintains a key phase of MuSC expansion (Woodhouse et al, 2013), the arginine methyltransferase Prmt5 regulates MuSC expansion by controlling p21 expression (Zhang et al, 2015), and HDAC4 directs MuSC proliferation by targeting p21 and Sharp1 (Marroncelli et al, 2018). Moreover, HDAC1 is recruited to muscle gene promotors by YY1 as part of the Ezh2 complex to prevent differentiation and promote proliferation (Caretti et al, 2004). The chromatin architecture is also regulated by chromatin remodeling complexes, which either move, eject, or restructure nucleosomes by exchanging histone monomers (Poli et al, 2017). Chromatin remodeling complexes do not only regulate gene expression but also fulfill different functions to maintain genome stability. The enormous functional diversity of chromatin remodeler complexes is in part accomplished by changes in their subunit composition. The core complex of chromatin remodelers, which already consists of several subunits, associates with distinct transcription factors that determine localization and activity. For examples, some activities of the INO80 chromatin remodeler depend on interactions with WDR5 (Wang et al, 2014; Zhou et al, 2016) and YY1 (Cai et al, 2007; Vella et al, 2012). Dynamic, cell stage‐dependent changes in complex composition might be critical to regulate individual modalities of chromatin remodeler complexes with different functions.
Long non‐coding (lnc‐) RNAs have recently come into focus as regulatory factors that often interact directly with proteins to control their localization and/or activity (Ulitsky & Bartel, 2013; Kopp & Mendell, 2018). Nuclear lncRNAs are frequently involved in the epigenetic control of gene expression by recruiting epigenetic regulators to specific sites in the genome or by serving as scaffolds for the assembly of larger complexes (Quinn & Chang, 2015; Carlevaro‐Fita & Johnson, 2019). Since lncRNAs are typically expressed in specific cell types at distinct stages (Cabili et al, 2011; Gloss & Dinger, 2016), they might confer cell type specificity to more broadly expressed epigenetic regulators. Here, we investigated the role of lncRNAs for the epigenetic control of MuSC activation, expansion, and muscle regeneration. We screened for lncRNAs that are exclusively expressed at different stages of MuSC proliferation and differentiation and identified the evolutionary conserved linc‐MYH, which is co‐expressed with the largest myosin cluster in mammals. We found that linc‐MYH interacts specifically with functional domains of the INO80 chromatin remodeler complex and controls its composition. Linc‐MYH prevents interaction of the INO80 complex with the transcription factor YY1 and the scaffolding protein WDR5. Upregulation of linc‐MYH during MuSC proliferation is decisive to limit proliferation of MuSCs and contains the size of the quiescent MuSC pool, thereby preventing myofiber hypertrophy during muscle homeostasis and after regeneration. We propose that Linc‐MYH acts as a selective molecular switch for INO80, allowing stage‐specific regulation of distinct INO80 activities in MuSCs.
Results
Linc‐MYH is confined to the nucleus of proliferating and differentiating MuSCs
To explore the function of lncRNAs that are located in nuclei of MuSCs and hence might be involved in the regulation of epigenetic processes, we used RNA sequencing data obtained from freshly isolated, proliferating and differentiating murine MuSCs (Wust et al, 2018). We identified a long intergenic non‐coding RNA (lincRNA) that is expressed in proliferating and differentiated, but not in freshly isolated MuSCs (Fig 1A). Using previously published data (Machado et al, 2017; van Velthoven et al, 2017), we confirmed that the expression of the lincRNA is similarly absent in quiescent MuSCs in situ. The lincRNA is located in the murine Myh3‐Myh13 gene cluster (Fig EV1A) and was previously named linc‐MYH due to its localization with the myosin heavy chain gene cluster (Sakakibara et al, 2014). The expression of linc‐MYH during myogenic differentiation of MuSCs parallels the expression of other genes in the Myh3‐Myh13 gene cluster, which is already activated before differentiation but further increases in differentiated myotubes (Fig 1A). Murine MuSCs generate two different isoforms of linc‐MYH consisting of four or five exons, apparently resulting from alternative transcriptional start sites (Fig EV1B). We also identified a putative linc‐MYH ortholog in the human Myh3‐Myh13 cluster based on genomic synteny and expression, although no conservation of the primary lncRNA sequence was recognized between mice and humans (Fig EV1C and D). The expression of linc‐MYH is strictly confined to skeletal muscle in both mice and humans (Figs 1B and C, and EV1B), which was confirmed by Genotype‐Tissue Expression (GTEx) project data (https://gtexportal.org/home/gene/CTC-297N7.7). The expression of linc‐MYH is not detected in limb buds in early embryonic stages, and there is low expression in hindlimb muscle at late fetal stages and shortly after birth. However, expression increases in skeletal muscle 3 weeks after birth and is strongly expressed in skeletal muscle 8 weeks after birth (Fig 1D).
Figure 1. linc‐MYH is located in nuclei of proliferating and differentiated myocytes and interacts with the chromatin remodeler complex INO80.

-
ARNA‐seq. of freshly isolated, proliferating, and differentiating satellite cells reveals an increased expression of linc‐MYH in proliferating and differentiating MuSCs, but no expression is found in freshly isolated MuSCs.
-
B, CExpression of linc‐MYH is confined to skeletal muscle in mouse (B) and human (C) tissues.
-
DExpression of linc‐MYH is not detected in limb buds at E10.5 (n = 3), E13.5 (n = 3), and E15.5 (n = 3). Expression of linc‐MYH in hindlimb muscle of E18.5, newborn, and 7‐day-old animals (n = 3/3/3). Expression of linc‐MYH in m. soleus (soleus), m. tibialis anterior (TA), and m. extensor digitorum longus (EDL) muscle at 3 weeks (n = 3) and 8 weeks of age (n = 5). Biological replicates were used for all PCR experiments, and data are mean ± SEM.
-
E‐HMurine linc‐Myh is localized in nuclear extracts of C2C12 cells. Xist (nuclear) and Gapdh (mainly cytoplasmic) were used as controls (n = 2 nuclear/3 cytoplasmic biological replicates.) Data are mean ± SEM. (F‐H) RNA–FISH identifies linc‐Myh in nuclei (DAPI, blue) of C2C12 myoblasts. (G) Adipor (cytoplasmic) and (H) Xist (nuclear) were used as controls.
-
I, JGO enrichment (I) analysis of proteins pulled down by in vitro transcribed RNA from nuclear extracts of C2C12 myoblasts. Linc‐MYH RNA and three control RNAs were used in duplicate. (J) Heat map of proteins pulled down in the same experiments as in I, demonstrating that INO80 chromatin remodeler complex exclusively interacts with linc‐MYH. Blue color indicates pull‐down of the respective protein, and white color indicates that the protein was not detected in the respective sample.
-
K, LRNA‐IP experiments using an anti‐INO80 antibody to isolate the INO80 complex from murine C2C12 cells (K) and human HSMM cells (L). INO80 and INO80 II in L refer to replicate INO80 precipitation experiments. Precipitated RNAs were detected by RT–PCR.
Figure EV1. The linc‐MYH gene is located in the Myh3‐Myh13 gene cluster and generates two different splice variants.

-
AThe linc‐MYH gene (RefSeq ID: 2310065F04Rik; marked by red square) is located within the Myh3‐Myh13 gene cluster at mouse chromosome 11, downstream of Myh3, and upstream of Myh2 (UCSC genome browser, GRCm38/mm10).
-
BThe linc‐MYH gene expresses two lncRNA splice variants (UCSC genes: AK010044, AK079404) that share most of the primary sequence. RNA‐seq (track: RNA‐seq from ENCODE/Caltech; C2C12 myocytes) and microarray expression data (track: Affymetrix Exon Array 1.0: normal tissues) indicate expression in skeletal muscle tissue (red bars) but not in the heart or other organs (black bars).
- C, D
-
E, Flinc‐MYH has a low coding potential. Comparison of the coding potential of different non‐coding RNAs (Tsix, Fendrr, Hotair), “micropeptide‐coding” RNAs (Myoregulin, Dworf), coding RNAs (Myog, Gapdh) RNAs and linc‐MYH sequences by the Coding Potential Calculator. (F) The CPC2 Fickett score clearly distinguishes non‐coding RNAs including AK010044.1 (linc‐MYH) and AK079404.1 (linc‐MYH) from (micropeptide)‐coding sequences.
We did not detect any conserved open reading frame in mouse or human linc‐MYH, suggesting that the linc‐MYH is a bona fide non‐coding RNA. To confirm this assumption, we tested the coding potential of linc‐MYH using established tools, including the coding potential calculator CPC (Kong et al, 2007) and its updated version CPC2 (Kang et al, 2017), which corroborated the low coding potential for both linc‐MYH variants (Fig EV1E). The CPC2 tool also revealed a low Fickett score, further confirming that linc‐MYH does not code for a peptide (Fickett, 1982) (Fig EV1F). Since we were primarily interested in nuclear lncRNAs, we determined the subcellular localization of linc‐MYH. Subcellular fractionation of C2C12 myocytes revealed that linc‐MYH is predominantly positioned in the nucleus (Fig 1E). The nuclear localization of linc‐MYH was confirmed by RNA–FISH experiments using probes targeting Xist and Adipor RNA as controls (Fig 1F–H). Linc‐MYH was detected at multiple locations in the nucleus, suggesting potential functions of linc‐MYH outside the myosin cluster, unlike Xist, which is confined to the X chromosome.
Linc‐MYH interacts with the INO80 chromatin remodeler complex
To identify putative epigenetic regulators or transcription factors that might interact with linc‐MYH, we performed RNA–protein pull‐down experiments using nuclear protein extracts from C2C12 skeletal muscle cells. Interacting proteins were isolated using immobilized, in vitro transcribed linc‐MYH RNA, and subsequently identified by mass spectrometry. Three different control RNA probes were used to distinguish between molecules that promiscuously bind to RNA and proteins that interact specifically with linc‐MYH. Analysis of mass spectrometry data by unbiased GO enrichment analysis revealed a striking enrichment of GO terms related to chromatin remodeling complexes (Fig 1I). Only the linc‐MYH RNA probe but not the different control RNA probes pulled down several components of the chromatin remodeler INO80 complex, while all RNA probes pulled down prototypical RNA‐binding proteins like hnRNPs (Fig 1J).
To validate the interaction between INO80 and linc‐MYH in cells, we performed RNA immunoprecipitation (RNA‐IP) experiments using an anti‐INO80 antibody and extracts from mouse C2C12 myotubes. In the precipitates, RT–PCR analysis detected the mouse linc‐MYH, whereas the two different control lncRNAs were not detected (Fig 1K). Similar RNA‐IP experiments using human myoblast‐derived myocytes (HSMM cells) confirmed our assumption that the putative human linc‐MYH ortholog interacts specifically with the human INO80 complex (Fig 1L).
Linc‐MYH restricts the size of the MuSC pool and prevents hypertrophy of skeletal muscle fibers
We next wanted to understand whether linc‐MYH is important for MuSC function and skeletal muscle physiology in vivo and therefore generated linc‐MYH knockout mice (Appendix Fig S1A–C). Homozygous linc‐MYH knockouts were viable and did not display any gross abnormalities. Importantly, however, we observed a substantial increase in the mass of skeletal muscles in mutant animals that correlated with increased body weight compared with wild‐type controls (Fig 2A–D). The higher skeletal muscle weight in linc‐MYH mutants was also associated with an increase in myofiber cross‐sectional area, indicative for myofiber hypertrophy (Fig 2E–J). Furthermore, we detected a strong increase in myonuclei in muscle cross sections (Fig 2K) and in isolated myofibers (Fig 2L–N), suggesting that skeletal muscle hypertrophy in linc‐MYH mutants is driven by enhanced generation of MuSCs that fuse to myofibers.
Figure 2. linc‐MYH keeps the number of MuSCs in check and limits muscle fiber growth.

-
A, BBody weight (A) of male linc‐MYH KO and ctrl mice at 10 weeks (n = 24 KO/17 WT; Student's t‐test, two‐tailed, **P < 0.01) and tibia length (B) of male linc‐MYH KO and ctrl mice of 10 weeks (n = 9 KO/13 WT; Student's t‐test, two‐tailed, not significant). Data are mean ± SEM.
-
C, DWeight of m. tibialis anterior (TA) and m. digitorum longus (EDL) of male linc‐MYH KO and ctrl mice at 10 weeks (n = 9 KO/10 WT for TA, n = 10 KO/11 WT for EDL; Student's t‐test, two‐tailed, **P < 0.01, ***P < 0.001). Data are mean ± SEM.
-
E–JSize distribution of fibers in cross sections of TA (E, F) and EDL (G, H) muscle in male linc‐MYH KO (blue) and ctrl (gray) animals at 10 weeks. A significant increase in fiber size was observed for TA and EDL muscles of linc‐MYH KO mice (n = 5 KO/4 WT for TA, n = 3 KO/3 WT for EDL muscle, two‐way ANOVA with Fisher's multiple comparisons; *P < 0.05, **P < 0.01; > 250 fibers per animal were counted). Data are mean ± SEM.
-
KNumbers of myonuclei in cross sections of TA and EDL muscle (TA: n = 6 KO/6 WT, EDL n = 3 KO/3 WT animals, Mann–Whitney test one‐tailed, **P < 0.01, *P = 0.05). Data are mean ± SEM.
-
L–ONumber of myonuclei/fiber and of Pax7pos (red) MuSCs (red arrows) on myofibers isolated from flexor digitorum brevis muscle. Nuclei were stained using DAPI (blue). Scale bar in L indicates 50 μm for L and M. (N) The number of myonuclei/isolated fiber is increased in linc‐MYH KO compared with WT myofibers (n = 4 KO/4 WT, > 26 fibers/animal; Mann–Whitney test two‐tailed, *P < 0.05). (O) Number of MuSCs on isolated fibers from linc‐MYH KO and WT mice (n = 4 KO/4 WT animals, Mann–Whitney test two‐tailed; ****P < 0.0001). Data are mean ± SEM.
-
P–SNumber of Pax7 (red)‐positive MuSCs in cross sections of tibialis anterior muscle (P‐R); the relative amount of quiescent MuSCs identified by double staining (yellow arrows) for Pax7 and CalcR (green) does not significantly differ between WT and linc‐MYH KO animals (S). Nuclei were stained with DAPI (blue). Scale bar in P indicates 25 μm for P and Q. (n = 3 KO/3 WT animals, Mann–Whitney test one‐tailed; *P = 0.05, ns: not significant). All data are mean ± SEM.
-
TThe number of MuSC‐related events in FACS experiments is significantly increased in linc‐MYH-KO animals (n = 7 KO/7 WT, Student's t‐test, two‐tailed, *P = 0.0126). Data are mean ± SEM.
-
U, VStructure of MuSCs and the heterochromatin content of MuSC nuclei is not changed in linc‐MYH KO (V) compared with WT mice (U).
Initiation of linc‐MYH expression in MuSCs occurs concomitant to the activation of the Myh3‐Myh13 gene cluster and is therefore limited to proliferating MuSCs and differentiated myotubes. Hence, we were surprised to observe a massive increase in Pax7‐positive MuSCs attached to isolated myofibers (Fig 2L, M and O) and of Pax7‐positive MuSCs on cross sections of tibialis anterior (TA) muscles (Fig 2P–R). The enlarged MuSC pool in linc‐MYH‐deficient muscles did not show a major change in the activation state under baseline conditions as indicated by the expression of the CalcR (calcitonin receptor), a marker for quiescent MuSCs (Yamaguchi et al, 2015; Fig 2P, Q and S). Since activation of MuSCs goes along with reduction in heterochromatin content in MuSCs, we also performed electron microscopy (EM) on skeletal muscle sections of linc‐MYH KO and WT mice. No reduction in heterochromatin was visible in linc‐MYH MuSC nuclei (Fig 2U and V), indicating that the increased number of MuSCs is not caused by a loss of quiescence of MuSCs in linc‐MYH animals. Nevertheless, we observed a small, but significantly increased number of Pax7+/MyoD+ nuclei in TA muscle of linc‐MYH KO compared with wild‐type controls (linc‐MYH KO: 8.28 ± 0.58% of all Pax7+ cells, WT: 5.93 ± 0.6%, n = 3/3 animals, Mann–Whitney test, one‐tailed P = 0.05), indicating an increased number of spontaneously activated MuSCs in linc‐MYH‐deficient muscle. Consistent with increased numbers of MuSCs in TA muscles, we observed higher MuSC numbers in preparations of whole body skeletal muscle of linc‐MYH‐deficient mice in experiments to isolate MuSCs by FACS (Fig 2T). In line with lower expression of linc‐MYH in soleus muscle weight of soleus muscle and cross‐sectional area of myofibers was unchanged, but we observe increased numbers of myonuclei and of MuSCs (Appendix Fig S2). In eight‐month‐old animals, we observe increased number of both myonuclei and of MuSCs as well as increased myofiber cross‐sectional area, indicating hypertrophy of the myofibers. Body weight and weight of TA muscle were not significantly increased in 8‐week‐old animals (Appendix Fig S3).
Control of MuSC proliferation by linc‐MYH depends on INO80
To corroborate the molecular interaction between linc‐MYH and INO80, we performed an RNA in situ hybridization‐proximity ligation assay (rISH‐PLA; Roussis et al, 2017). Since the available INO80 antibodies worked well for immunoprecipitation but not for immunofluorescence, we generated a new mouse strain by insertion of a V5 tag at the C‐terminus of INO80 using CRISPR‐CAS9‐targeted homology‐directed repair (Appendix Fig S1D). The resulting INO80‐V5 mice were crossed to linc‐MYH−/− mutants to generate linc‐MYH+/+/INO80‐V5 and linc‐MYH−/−/INO80‐V5 animals from which MuSCs for rISH‐PLA were isolated. We detected signals, indicating close proximity of linc‐MYH and INO80 in WT myoblasts using biotinylated linc‐MYH‐specific probes and an anti‐V5 antibody (Fig 3A–D), which is in line with the linc‐MYH/INO80 co‐IP and pull‐down results. The interaction of linc‐MYH with components of the INO80 complex suggested that linc‐MYH might exert its function for limiting MuSC numbers via INO80. To investigate this hypothesis, we generated muscle‐specific INO80 mutants using the Pax7‐Cre allele (Keller et al, 2004) in combination with a floxed Ino80 allele (Qiu et al, 2016). Germline mutants of INO80 cannot be used for this purpose, because they are embryonic lethal at early stages of development (Qiu et al, 2016). Pax7‐Crepos/INO80−/− mice were viable and did not show any apparent developmental abnormalities including regular numbers of Pax7pos MuSCs (Fig 3E–J), which allowed us to generate linc‐MYH−/−/INO80−/−/Pax7‐Crepos double‐mutant mice (Pax7‐Crepos dKO). In addition, we used the tamoxifen‐inducible Pax7‐CreERT2 allele together with linc‐MYH−/−/INO80−/− mice to avoid interferences from potentially undetected developmental defects (Murphy et al, 2011). Histological analysis of Pax7‐Crepos dKO skeletal muscles revealed a complete abrogation of the increased number of Pax7pos MuSCs observed in linc‐MYH−/− mutants (Fig 3E–J), indicating that linc‐MYH suppresses an activity of the INO80 complex that is instrumental to enlarge the MuSC pool. Identical results were obtained after inactivation of the Ino80 gene in adult mice after tamoxifen injection, essentially excluding paracrine, non‐cell autonomous functions of the linc‐MYH/INO80 complex in adult MuSCs. Furthermore, and in line with the normalization of MuSC numbers, deletion of INO80 in skeletal muscle of linc‐MYH−/−/Pax7‐Crepos mice abolished the increased TA muscle weight observed after deletion of linc‐MYH (Pax7‐Crepos/INO80−/−: 34.5 mg ± 0.7 mg, n = 12 animals; Pax7‐Cre dKO: 33.1 ± 0.8 mg, n = 9 animals). Likewise, the increased bodyweight of linc‐MYH animals was normalized by additional deletion of INO80 (Pax7‐Crepos/INO80−/−: 19.5 ± 0.3 g, n = 12 animals; Pax7‐Cre dKO: 18.5 ± 0.8 g, n = 9 animals).
Figure 3. linc‐Myh restricts proliferation of MuSCs in an INO80‐dependent manner.

-
A–DRNA in situ hybridization‐proximity ligation assay (rISH‐PLA) detects the close proximity of a specific RNA with proteins in situ modified from Roussis et al (B, C) rISH‐PLA confirms the proximity of linc‐MYH to endogenous INO80‐V5 in the nucleus of proliferating WT MuSCs (B). The specific signal is lost in linc‐MYH-deficient MuSCs (C). (n = 3 WT/3 KO biological replicates; Mann–Whitney test, *P = 0.05). Data are mean ± SEM.
-
E–IRepresentative images of TA muscle sections of 10‐week-old mice stained for PAX7 (green) and EdU incorporation (red). MuSCs without (green arrows) and with EdU‐labeling (red arrows) are indicated. (E, F) Deletion of linc‐MYH results in increased numbers of muscle stem cells and pronounced increase in the ratio of EdU‐positive MuSCs. (G‐I) The increase in both the number of MuSCs and EdU‐positive MuSCs in linc‐MYH mutant muscle is abolished by constitutive (G: Pax7‐Crepos/INO80−/−, Ino80 KO; H: linc‐MYH−/−/Pax7-Crepos/INO80−/−, dKO) and induced (I: linc‐MYH−/−/Pax7-CreERT2pos/INO80−/−, dKO CreERT) deletion of INO80 in Pax7 expressing cells.
-
J–LStatistical evaluation of the number of muscle stem cells observed in TA muscles (J). Statistical evaluation of the ratio of EdU‐incorporating MuSCs relative to all Pax7‐positive MuSCs (K). Statistical evaluation of the number of myonuclei in myofibers of TA muscles from different genotypes (L); (n = 5 WT/5 linc‐MYH KO/4 Ino80 KO/5 dKO/3 CreERT dKO animals in J/K, n = 6 WT/6 linc‐MYH KO/5 Ino80 KO/6 dKO/3 CreERT dKO animals in L **P < 0.01, ****P < 0.0001, > 31 MSCs/animal in K; ANOVA test with multiple comparisons against WT. Sidak–Holm correction was used. Data are mean ± SEM.).
To obtain further insights into the cellular processes resulting in increased number of MuSCs after inactivation of linc‐MYH, we administered EdU daily over a two‐week period to adult animals. WT animals showed incorporation of EdU into approximately 12% of MuSCs confirming previous studies (Pawlikowski et al, 2015). More importantly, we observed a great increase in EdUpos/Pax7pos MuSCs in linc‐MYH KO mice (Fig 3E–I and K), indicating that more MuSCs were generated by cell proliferation in a fixed time period; however after proliferation, these MuSCs return to a quiescent, CalcR‐positive state. In other words, the data suggest that the absence of linc‐MYH enhances proliferation of MuSC‐derived myoblasts, which eventually increases the number of quiescent MuSCs. Strikingly, inactivation of INO80 in linc‐MYH−/− MuSCs completely abrogated the increase in EdU‐labeled quiescent MuSCs (Fig 3E–I and K) and prevented both muscle hypertrophy and the increase of myonuclei numbers in fibers (Fig 3L). Taken together, the data unequivocally demonstrate the critical role of the linc‐MYH/INO80 complex in limiting the size of the quiescent MuSC pool, restricting expansion of muscle progenitor cells, as well as highlight the dependency of linc‐MYH functions on INO80. In line with increased proliferation, we noted an increased number of MyoDpos/EdUpos nuclei in TA muscle of linc‐MYH KO mice (linc‐MYH: 5.9 ± 1.42 nuclei/mm2, WT: 2.5 ± 0.70 nuclei/mm²; n = 3/3 animals, Mann–Whitney test, one‐tailed P = 0.05). The number of MyoDpos/EdUpos nuclei exceeds the total number of Pax7pos/MyoDpos nuclei in linc‐MYH and WT control mice (linc‐MYH: 2.0 ± 0.04 nuclei/mm2, WT: 0.9 ± 0.02 nuclei/mm2; n = 3/3), suggesting that the majority of MyoDpos/EdUpos nuclei are myoblasts or nuclei of myoblasts recently fused to myofibers and contribute to myofiber hypertrophy.
While the majority of MuSCs are in a quiescent state in adult muscles during steady‐state conditions, muscle injury induces activation and proliferation of MuSCs, followed by differentiation and functional replacement of damaged tissue. To analyze whether the increase in MuSCs in linc‐MYH mice improves regeneration, we damaged the TA muscle by CTX injections. Surprisingly, we did not detect any differences in the extent of muscle regeneration between WT and linc‐MYH mice based on histological assessments, neither at one nor at 2 weeks after damage (Fig EV2A, B and D–I). Interestingly, 4 weeks after CTX injection, when muscle regeneration was completed, we observed the same increase in MuSC numbers in linc‐MYH mutant TA muscles compared with WT controls (Fig EV2J–L) and the same increase in EdU‐incorporating MuSCs as before the damage (Fig EV2M). The size of myofibers again was increased in regenerated muscles of linc‐MYH mutant animals compared with controls, suggesting that inhibition of linc‐MYH stimulates MuSC proliferation and skeletal muscle growth during regeneration (Fig EV2C). Additional deletion of INO80 in Pax7‐Crepos/Ino80−/− as well as in Pax7‐Crepos/linc‐MYH−/−/Ino80−/− dKO eliminated the general myofiber hypertrophy observed 4 weeks after CTX‐induced muscle damage, and also obliterated the tremendous myofiber hypertrophy observed after loss of linc‐MYH (Fig EV2N). More importantly, additional deletion of INO80 resulted in WT levels of both MuSC and of EdUpos/PAX7pos MuSC numbers 4 weeks after CTX‐induced damage in INO80 KO and in linc‐MYH/INO80 dKO (Fig EV2O and P), abrogating the increase observed in linc‐MYH‐deficient muscle. Together, our results indicate that linc‐MYH controls proliferation of MuSCs in adult muscle. In line with absent or low expression of linc‐MYH in embryonic and juvenile stages (Fig 1D), we detected no increase in the number of myonuclei, of MuSCs, and of EdU‐incorporating MuSCs in linc‐MYH‐deficient muscle at 3 weeks of age (Fig EV3A–E), corroborating the view that linc‐MYH controls proliferation of adult MuSCs.
Figure EV2. Loss of linc‐MYH does not affect skeletal muscle regeneration.

-
A–CFiber size distribution in TA muscles of WT and linc‐MYH−/− (KO) at different time point after CTX injection. The cross‐sectional area of newly formed myofibers does not differ after one (A) or 2 weeks (B) of regeneration (two‐way ANOVA with Fisher's LSD: not significant). 4 weeks after CTX injury (C), increased numbers of myofibers with large cross‐sectional area are present in linc‐MYH−/− TA muscles (two‐way ANOVA with Fisher's LSD for column 3,000 μm²: **P < 0.003 and significant with Sidak–Holm correction; each timepoint: WT n = 4 animals, linc‐MYH KO n = 4 animals, > 297 myofibers/animal). Data are mean ± SEM.
-
D–FImmunofluorescence images of muscle cross sections stained for WGA (green) and DAPI (blue). Centralized nuclei 2 weeks after CTX injury indicate newly formed myofibers. F, The proportion of fibers with centralized nuclei is similar between WT and linc‐MYH mutant muscle (Mann–Whitney test: not significant P = 0.999; WT n = 3 animals, linc‐MYH KO n = 3 animals, 2 weeks after injury). Data are mean ± SEM.
-
G–IThe number of Pax7‐positive (green) MuSCs does not differ between WT (G) and linc‐MYH−/− muscles (H) 2 weeks after CTX injection (I, Mann–Whitney test: not significant P = 0.999; WT n = 3 animals, linc‐MYH KO n = 3 animals). Data are mean ± SEM.
-
J–MThe number of Pax7‐positive (green) MuSCs is significantly higher in linc‐MYH−/− (K) compared with WT (J) muscles 4 weeks after CTX injection (L, Mann–Whitney test: **P = 0.0016; WT n = 4 animals, linc‐MYH KO n = 4 animals). (M) Increased numbers of EdU‐incorporating (red), Pax7‐positive (green; yellow arrows) MuSCs in linc‐MYH−/− compared with WT MuSCs (Mann–Whitney test: **P = 0.0075; WT n = 4 animals, linc‐MYH KO n = 4 animals). Data are mean ± SEM.
-
NFiber size distribution in TA muscles of Ino80 KO and linc‐MYH/Ino80 dKO animals 4 weeks after CTX injury. The cross‐sectional area of newly formed myofibers does not differ after 4 weeks (two‐way ANOVA with Fisher's LSD: not significant; Ino80 KO n = 4, dKO n = 3). Data are mean ± SEM.
-
O, PThe number of satellite cells is not significantly different in Ino80 KO and linc‐MYH/INO80 dKO TA muscle (Mann–Whitney test: not significant P = 0.31; Ino80 KO n = 4 animals, dKO n = 3 animals). The percentage of MuSCs that reveal EdU incorporation is not significantly different between Ino80 KO and linc‐MYH/INO80 dKO (Mann–Whitney test: not significant P = 0.5; Ino80‐KO n = 4 animals, d KO n = 3 animals). Data are mean ± SEM.
Figure EV3. No apparent differences in MuSCs of 3‐week‐old animals.

-
AThe number of myonuclei in TA muscle is not significantly different between the WT and linc‐MYH KOs (Mann–Whitney test: not significant P = 0.7; WT n = 3 animals, linc‐MYH KO n = 3 animals). Data are mean ± SEM.
-
B–EThe number of Pax7‐positive (green arrows in D, E) MuSCs in TA muscle does not differ between 3‐week-old linc‐MYH KO (E) compared with wild‐type (D) control animals (Mann–Whitney test: not significant P = 0.99; WT n = 3 animals, linc‐MYH KO n = 3 animals). The percentage of EdU‐positive (red arrows in D, E) MuSCs in TA muscle of linc‐MYH KO (E) compared with wild‐type controls (D) is not different in 3‐week-old animals (Mann–Whitney test: not significant P = 0.99; WT n = 3 animals, linc‐MYH KO n = 3 animals). Data are mean ± SEM.
In contrast to previous shRNA knock‐down experiments, claiming a role of linc‐MYH in muscle fiber type specification (Sakakibara et al, 2014), we did not observe any changes in fiber type composition in linc‐MYH−/−, Ino80−/−/Pax7‐Crepos, or in Pax7‐Cre dKO mice (Appendix Fig S4). Moreover, the expression of the respective transcripts was not altered (Appendix Table S1). To exclude any potential effects of the linc‐MYH−/− allele on the Myh3‐Myh13 gene locus, we generated an additional linc‐MYH‐mutant mouse strain. Using a CAS9/HDR approach, we inserted a poly‐A cassette into the first exon of the linc‐MYH gene which is used by both isoforms (Appendix Fig S1E and F). Insertion of the poly‐A cassette prevented linc‐MYH expression completely (Appendix Fig S1G). Analysis of the linc‐MYH poly‐A‐insertion allele revealed an identical phenotype to the deletion allele with no alterations in fiber type composition (Appendix Fig S4) and an increased number of Pax7‐positive quiescent MuSCs (Appendix Fig S1H).
To analyze the role of the linc‐MYH/INO80 complex in the proliferation of MuSCs in vitro, we isolated MuSCs from skeletal muscle tissue of WT, linc‐MYH−/−, Pax7‐Crepos/INO80−/−, and Pax7‐Cre dKO mice. Consistent with the in vivo data, MuSCs isolated from linc‐MYH−/− skeletal muscle showed increased proliferation rates, reached confluence much faster compared to WT controls (Fig 4A–F), and displayed increased EdU incorporation. In the early phase of MuSC culture (120 h postisolation) that is characterized by a surge of proliferation of MuSCs, we noticed only a slight increase in EdU incorporation in linc‐MYH‐deficient MuSCs compared with WT MuSCs (Appendix Fig S5A–E). However, 240 h and 315 h after isolation we observed higher EdU incorporation in linc‐MYH KO MuSCs compared with WT MuSCs (Appendix Fig S5F–O). Deletion of INO80 in contrast to the in vivo situation resulted in reduced proliferation of INO80‐deficient MuSCs in vitro; however in this setting, deletion of INO80 in linc‐MYH−/− cells fully prevented increased proliferation rates and earlier confluence due to the absence of linc‐MYH (Fig 4A–F).
Figure 4. Deletion of INO80 prevents linc‐MYH‐dependent changes in MuSC proliferation and gene expression.

-
A–DIsolated linc‐MYH KO MuSCs reach confluence much faster than WT MuSCs indicating higher proliferation rates. Deletion of INO80 eliminates the difference between Pax7‐Crepos/INO80−/− (Ino80 KO) and linc‐MYH−/−/linc-MYH−/−/Pax7‐Crepos/INO80−/− (dKO). Images are representative images for cultures after 13 days in culture.
-
EDifferences in proliferation rates are abolished by additional deletion of INO80 in MuSCs. Cell confluence was monitored by a live cell imaging analysis system for 13 days (n = 7 WT/6 linc‐MYH KO/3 Ino80 KO/3 dKO‐independent preparations of MuSCs).
-
FStatistical analysis of cell confluence after 13 days of muscle stem cell proliferation (n = 7 WT/6 linc‐MYH KO/3 Ino80 KO/3 dKO‐independent preparations of MuSCs, Student's t‐test, two‐tailed; *P < 0.05, ns = not significant). Data are mean ± SEM.
-
G–IGene set enrichment analysis (GSEA, broadinstitute.org) of microarray data from proliferating MuSCs. Comparison of linc‐MYH−/− vs. WT proliferating MuSC transcriptomes shows enrichment of genes related to cell proliferation (G), enrichment of genes containing cis regulatory elements for YY1 (H) and p53 (I). Enrichments are highly significant using the most conservative familywise‐error rate method (FWER). Enrichments were lost in linc‐MYH−/− MuSCs after additional deletion of INO80 (dKOs) compared with Pax7‐Crepos/INO80−/− MuSCs.
-
J–LHeat maps of the 10 most upregulated genes of the respective gene sets depicted in G‐I in linc‐MYH−/− vs. WT MuSCs and in linc‐MYH−/−/Pax7‐Crepos/INO80−/− dKO vs. Pax7‐Crepos/INO80−/− MuSCs. The expression of upregulated genes in linc‐MYH−/− was normalized after additional deletion of INO80 (dKOs), indicating that effects of linc‐MYH completely depend on INO80 (WT n = 4, linc‐MYH−/− n = 4, Pax7‐Crepos/INO80−/− n = 4, Pax7‐Cre dKO n = 3 animals used for independent isolations of MuSCs).
Transcriptome analysis reveals enrichment of YY1 and p53 target genes in linc‐MYH−/− MuSCs
Our results so far clearly indicated that linc‐MYH exerts its effects via the INO80 chromatin remodeler complex. Hence, we reasoned that analysis of transcriptional changes in linc‐MYH−/−, Pax7‐Crepos/INO80−/−, and Pax7‐Cre dKO MuSCs might provide hints about the underlying regulatory mechanisms. Comparison of linc‐MYH−/− with WT MuSCs revealed enrichment of GO terms associated with cell proliferation as expected (Fig 4G and J). Importantly, we also detected a strong enrichment of genes containing binding sites for YY1 and p53, suggesting that some effects of linc‐MYH on INO80 might depend on YY1 and/or p53 (Fig 4H, K, I, and L). Despite increased expression of genes containing YY1‐binding sites, the expression of YY1 or other components of the INO80 complex was not altered at both mRNA and protein levels, indicating that linc‐MYH might control association of YY1 with the INO80 complex at the post‐translational level (Appendix Table S2, Appendix Fig S6). Accordingly, comparison of proliferating Pax7‐Crepos/INO80−/− and Pax7‐Cre dKO MuSCs revealed abrogated enrichment of gene sets related to proliferation and enrichment of YY1 and p53 target genes (Fig 4G–L). Additionally, shRNA‐mediated knock‐down of YY1 in proliferating MuSCs resulted in loss of the increased proliferation observed following deletion of linc‐MYH (Fig EV4), confirming a role of YY1 in linc‐MYH/INO80‐mediated function in the control of MuSC proliferation.
Figure EV4. Knock‐down of YY1 in linc‐MYH KO MuSCs.

- Knock‐down of Yy1 in proliferating MuSCs in vitro reduces Yy1 transcript abundance in linc‐MYH KO and wild‐type controls (WT scramble shRNA n = 3 biological replicates, WT Yy1 knock‐down n = 3 biological replicates, Mann–Whitney test: significant *P = 0.05; linc‐MYH KO scramble shRNA n =3 biological replicates, linc‐MYH KO yy1 shRNA n = 3 biological replicates, Mann–Whitney test: significant *P = 0.05). Data are mean ± SEM.
- Knock‐down of Yy1 in linc‐MYH KO MuSCs compared with linc‐MYH KO scramble shRNA controls results in lower confluence of proliferating MuSCs (n = 3/3 with 4 technical replicates/animal for each transfection, 95 time points, two‐way ANOVA P = 0.0001) compared with their scramble controls. Similarly, knock‐down of Yy1 in WT MuSCs compared with WT scramble shRNA results in lower confluence of proliferating MuSCs. (n = 3/3 with 4 technical replicates per animal for each transfection, 95 time points, two‐way ANOVA P = 0.0001). Knock‐down of Yy1 eliminated the increased confluence of linc‐MYH KO MuSC observed in linc‐MYH KO MuSCs compared to the respective wild‐type control MuSCs.
Furthermore, we detected a strong attenuation of gene set enrichment in Pax7‐Crepos/INO80−/− and Pax7‐Cre dKO MuSCs but not in linc‐MYH−/− MuSCs for DNA strand elongation, telomere maintenance, and chromosome maintenance (Appendix Table S3). This observation fits to the well‐documented function of INO80 in genome maintenance and repair (Min et al, 2013; Cao et al, 2015, Lee et al, 2017). In line with these results, we observed increased yH2AX deposition in nuclei of proliferating Pax7‐Crepos/INO80−/− and Pax7‐Cre dKO but not in linc‐MYH−/− and WT MuSCs (Fig 5A–G). These findings are in line with the results of the respective gene set enrichment analysis data (Fig 5H–I). We therefore concluded that linc‐MYH specifically controls the function of INO80 in the regulation of MuSC abundance and proliferation but not in DNA repair. The data also suggest that the linc‐MYH‐dependent function of INO80 might rely on YY1, which is a known interactor of the INO80 complex (Cai et al, 2007; Wu et al, 2007; Chen et al, 2011; Runge et al, 2018).
Figure 5. linc‐MYH does not regulate the function of INO80 during replication stress.

-
A–Dγ‐H2AX staining of proliferating MuSCs from WT (A), linc‐MYH-deficient (B), Pax7‐Crepos/INO80 KO (C), and linc‐MYH/INO80 dKO (D) mice. Deletion of INO80 results in increased γ‐H2AX signals, while deletion of linc‐MYH has no effects (asterisk: low γ‐H2AX signals, arrow: γ‐H2AX-foci detected in nuclei, arrowhead: pan‐nuclear γ‐H2AX signal.
-
E–GStatistical evaluation of the presence of γ‐H2AX signals in MuSCs of different genotypes (n = 3/3/3/3 animals used for independent isolations of MuSCs, two technical replicates for each animal, and at least 164 cells were counted, Mann–Whitney test, **P < 0.01. Data are mean ± SEM).
-
H, IGene set enrichment analysis of microarray data obtained for proliferating MuSCs shows enrichment of genes related to activity of ATR in response to replication stress recovery (H) and enrichment of genes involved in chromosome maintenance (I) in WT compared with Pax7‐Crepos INO80−/− MuSCs. Enrichment of these or similar gene sets was not observed when comparing WT to linc‐MYH−/− MuSCs.
-
JModel of the role of INO80 and linc‐MYH in the recognition of γ‐H2AX and DNA repair. The DNA repair function of the INO80 complex does not dependent on its interaction with linc‐MYH.
The presence of linc‐MYH changes composition of the Ino80 complex
To directly test the hypothesis that linc‐MYH regulates MuSCs abundance by ruling the composition of the INO80 complex and controlling association of INO80 with YY1 in a cell stage‐dependent manner, we performed comparative co‐IP experiments in WT and linc‐MYH−/− skeletal muscle tissues. Immunoprecipitation of INO80 followed by mass spectrometry identified 14 known interaction partners of INO80 including RUVBL1/2, ACTR5, ACTR8, UCHL5, and NFRKB, which were pulled down at comparable amounts both in WT and linc‐MYH−/− skeletal muscles. Importantly, however, we detected increased amounts of YY1, WDR5, and TFPT in linc‐MYH−/− compared with WT IP samples based on label‐free quantitative mass spectrometry (Table 1). Additional pull‐down experiments in combination with Western blot analysis confirmed these findings. YY1, WDR5, and TFTP were more abundant in INO80 pull‐down samples from linc‐MYH−/− compared with WT skeletal muscles, while interaction of RUVBL1 and RUVBL2 with the INO80 complex was not affected by the loss of linc‐MYH (Fig 6A and B). No changes in the concentration of RUVBL1/2, YY1, WDR5, or TFTP proteins were found in input samples, confirming our previous observation that mRNA expression levels of these molecules are not affected by the absence of linc‐MYH (Appendix Fig S6).
Table 1.
Identification of linc‐MYH‐dependent INO80 interaction partners
| Coefficient WT vs. linc‐MYH KO | Protein name | Protein description |
|---|---|---|
| −16.17 | TFPT (AMIDA, INO80F) | TCF3 fusion partner homolog |
| −7.49 | KLC2 | Kinesin light chain 2 |
| −7.16 | WDR5 | WD repeat‐containing protein 5 |
| −7.01 | YY1 | Transcriptional repressor protein YY1 |
| −6.91 | ACTL6a (ARP4) | Actin‐like protein 6A |
| −1.24 | NFRKB (INO80g) | Nuclear factor related to kappa‐B‐binding protein |
| −0.83 | ACTR8 (ARP8) | Actin‐related protein 8 |
| −0.56 | UCHL5 (UCH37) | Ubiquitin carboxyl‐terminal hydrolase isozyme L5 |
| −0.53 | INO80 | DNA helicase INO80 |
| −0.19 | RUVBL1 (TIP49a) | RuvB‐like 1 |
| −0.17 | RUVBL2 (TIP49b) | RuvB‐like 2 |
| −0.17 | ACTR5 (ARP5) | Actin‐related protein 5 |
| 7.00 | RAB5c | Ras‐related protein Rab‐5C |
| 7.44 | HIST2H2AC;HIST2H2AA1 | Histone H2A; type 2‐C; type 2‐A |
| 7.61 | INO80c (IES6) | INO80 complex subunit C |
Proteins interacting with INO80 in WT and linc‐MYH‐deficient TA muscle were identified by co‐immunoprecipitation in combination with label‐free quantitative mass spectrometry. Three independent Co‐IP experiments were performed using muscle tissues from WT (n = 3) and linc‐MYH KO (n = 3) animals. A coefficient for relative abundance of individual proteins in WT/linc‐MYH KO Co‐IP samples was calculated, and results were filtered for known INO80 interacting proteins based on the NCBI record of the human INO80 interactome (https://www.ncbi.nlm.nih.gov/gene/?term=INO80). The calculations revealed increased abundance of TFPT, WDR5, and YY1 and reduced abundance of INO80c in INO80 Co‐IP experiments. Other core‐components of the INO80 complex such as Ruvbl1/2, ACTR5, ACTR8, and NFRKB were unaltered.
Figure 6. linc‐MYH modulates INO80 complex composition by reducing incorporation of YY1 and WDR5.

-
A, BCo‐Immunoprecipitation of INO80 complex subunits from TA muscles of WT and linc‐MYH KO mice followed by Western Blot analysis. (B) Statistical analysis of Co‐IP/Western Blot data. The amount of RUVBL1 and RUVBL2 in the INO80 complex is not changed after deletion of linc‐MYH, while the amounts of YY1, WDR5, and TFPT pulled down by INO80 increase (n = 3 WT/3 linc‐MYH KO animals; one‐way ANOVA, multiple comparisons by Fishers LSD test, *P < 0.05). Data are mean ± SEM.
-
C–KProximity ligation assays between INO80 and YY1 (C, D), INO80 and WDR5 (F, G), and INO80 and RuvBl2 (I, J) in proliferating MuSCs. Red signals indicate close proximity of INO80‐V5 and the respective interacting protein. Nuclei were stained using DAPI (blue). Statistical evaluation of proximity ligation assays indicating increased interactions of INO80‐V5 and YY1 (E, n = 3/3 animals, three independent wells per animal, two‐tailed students t‐test, *P < 0.05) and of INO80‐V5 to WDR5 (H, n = 2 (WT)/2 (KO) animals, three independent wells per animal, two‐tailed students t‐test, **P < 0.01). No increase in proximity was detected between Ino80‐V5 and Ruvbl2 (K, n = 2 (WT)/2 (KO) animals, three independent wells per animal, two‐tailed Student's t‐test, ns: not significant). Specificity of all analyzed signals was analyzed using single primary or single secondary antibodies in PLA assays. No signals were detected for these controls. Data are mean ± SEM.
The linc‐MYH‐dependent switch in IN080 complex formation was further corroborated in proliferating MuSCs using in situ proximity ligation assays (PLAs). The PLAs revealed increased interaction of YY1 and WDR5 with INO80‐V5 in proliferating linc‐MYH−/−/INO80‐V5 compared with linc‐MYH+/+/INO80‐V5 MuSCs, while the interaction between RUVBL2 and INO80 remained unchanged (Fig 6C–K).
In an attempt to gain a better understanding of the interaction between linc‐MYH and the INO80 complex, we tested different domains of the human INO80 protein (hINO80) (Fig EV5A and B) for interaction with linc‐MYH. Pull‐down experiments in combination with Western blot analysis revealed that linc‐MYH specifically interacts with hINO80 (Fig EV5B). Overexpression of hINO80 protein domains in vitro according to the Conaway Lab (Chen et al, 2011) revealed that linc‐MYH directly interacts with the N‐terminal parts of the hINO80 protein, namely the NTD and HSA domains (Fig EV5B). Accordingly, fragments of the hINO80 protein lacking these domains do not interact with Linc‐MYH (Fig EV5B). In line with this, we identified interaction of linc‐MYH with MCRS1 (Fig EV5C), a protein described to interact with the NTD domain of hINO80 (Chen et al, 2011). In contrast to this, we detected no specific interactions of linc‐MYH with ACTR5, ACTR8, INO80C, RUVBL1, and RUVBL2, although some of these subunits were formerly pulled down in the context of the INO80 complex. Together with our previous findings, and the knowledge that TFPT and YY1 also bind, respectively, to the NTD and HSA domains (Chen et al, 2011), we propose that the interaction between Linc‐MYH and INO80 exclusively takes part in the NTD and HSA domains of the INO80 protein complex.
Figure EV5. linc‐MYH interacts with specific domains of INO80.

- INO80 protein with functional domains labeled (NTD: N‐terminal domain, HSA: helicase‐SANT-associated domain, Snf2 ATPase: Snf2 ATPase domain). Numbers indicate positions in the sequence of the hINO80 protein (NP_060023.1).
- Pull‐down experiments using in vitro transcribed linc‐MYH RNA (AK079404) or control lincRNA to pull‐down human flag‐tagged INO80 protein (hINO80) or hINO80 fragments ectopically expressed in HEK293 cells. Proteins binding to linc‐MYH RNA were identified by Western blot using an anti‐FLAG antibody. The hINO80 protein binds to linc‐MYH as expected, but the interaction is lost following deletion of the NTD (ΔNTD) domain or after deletion of the NTD and HSA (ΔNTD ΔHSA) domains. Accordingly, we detect interaction of the NTD (NTD) domain and of the HSA (HSA) domain with linc‐MYH.
- Pull‐down experiment using in vitro transcribed linc‐MYH RNA (AK079404) to test its interaction with mouse V5‐tagged MCRS1 protein (MCRS1) ectopically expressed in HEK293 cells.
- Pull‐down experiments using the different in vitro transcribed exons of linc‐MYH splice variants (AK079404, AK010044) as well as four different controls to detect interaction with native INO80 protein from nuclear extracts of C2C12 myoblasts. The experiment was performed in duplicate; interacting proteins were identified by mass spectrometry. No INO80 was detected in controls; however, INO80‐specific peptides were detected to specifically interact with exon sequences of linc‐MYH. Exons labeled in blue indicate detection of the INO80 protein, exons labeled in red indicate failure to detect the INO80 protein, and the exon labeled in gray was not tested.
- Pull‐down experiments using different in vitro transcribed exons or different parts of the last exon of linc‐MYH along with FLAG‐tagged human INO80 from HEK293 cell lysates.
To test whether the INO80 complex interacts with specific parts of the linc‐MYH sequence, we performed pull‐down experiments in combination with mass spectrometry analysis of the native mINO80 protein with different exons sequences linc‐MYH. We revealed interaction of INO80 with the last three exons of the linc‐MYH variant AK010044, two of which are in common with the AK079404. We detected an interaction of INO80 with the first exon of AK079404. However, we detected no interaction with the first two exons of AK010044 (Fig EV5D). These results were validated by performing pull‐down experiments using exon sequences of linc‐MYH in combination with the overexpressed hINO80 protein. Our results indicate that exon 4 and 5 sequences of AK010044 strongly interact with the hINO80 protein, whereas exon 1 (AK079404) as well as exons 2 and 3 (AK010044) display weaker interactions with hINO80 (Fig EV5E). No interaction with exon 1 (AK010044) was detected. Collectively, our results reveal that exons 3, 4, and 5 appear to be the sites where the interaction between linc‐MYH and INO80 is mainly taking part, although the exact structural basis of the interaction remains to be determined.
These results demonstrate that linc‐MYH specifically alters composition of the INO80 complex in MuSCs by interacting with the N‐terminal parts of INO80. Moreover, linc‐MYH directly interacts with MCRS1, a protein known to interact with the N‐terminal domain of INO80. Together these interactions hinder recruitment of other N‐terminal‐binding subunits (Chen et al, 2011), namely the pro‐proliferative YY1 transcription factor and TFPT. In contrast, linc‐MYH does not affect the stoichiometry of core INO80 complex components such RUVBL1/2 and ACTR5/8, which are essential for nucleosome sliding and of ACTR8, needed for recruitment of the INO80 complex to DNA damage sites marked by yH2AX.
Discussion
Here, we demonstrated that the evolutionary conserved long non‐coding RNA linc‐MYH plays a major role in the control of MuSC proliferation by specifically regulating composition and activity of the INO80 complex. After deletion of linc‐MYH, we observe an increase in both EdU‐incorporating Pax7‐positive MuSCs and MyoD/Pax7‐positive MuSCs. However, we do not observe a general decline of quiescent MuSCs, but rather the opposite since the absolute numbers of quiescent MuSCs are increased. The data clearly argue for a function of linc‐MYH in proliferating MuSCs, which fits well to the expression profile of the linc‐MYH gene that is not transcribed in quiescent and freshly isolated MuSCs but in proliferating muscle stem cells and in myotubes.
Linc‐MYH is embedded in the Myh3‐Myh13 cluster which becomes activated at late stages of proliferation and in differentiating myocytes. Thus, the Myh3‐Myh13 cluster seems to provide the regulatory context for linc‐MYH expression. Further regulatory cues specific for linc‐MYH might exist (Sakakibara et al, 2014), and these result in absent or low expression in embryonic and juvenile muscle and in high expression in adult muscle and differentiating adult MuSCs. From a teleological point of view, such a scenario makes a lot of sense: Cells that are committed to myogenic differentiation and therefore start to activate genes required for sarcomere formation need to turn off proliferation. Co‐expression of sarcomere genes and of an anti‐proliferative gene such as linc‐MYH make sure that both processes are synchronized, reaching a peak in differentiated non‐proliferating myotubes, which express the highest levels of Myh genes and linc‐MYH. The model might also explain, at least in part, why myogenic cells become refractive to growth factor‐dependent stimulation of cell proliferation shortly before differentiation. Apparently, not only paucity of external signals restricts proliferation but also cell autonomous mechanisms that were set in motion to limit expression of pro‐proliferative genes (Moore et al, 1991; Pawlikowski et al, 2017).
The function of linc‐MYH for regulation of MuSC proliferation strictly depends on INO80. Several lines of evidence in vivo and in vitro indicate that without presence of INO80 in MuSCs linc‐MYH‐deficient MuSCs lose their proliferative advantage and show normalized expression of genes involved in proliferation. We demonstrated that the interaction of linc‐MYH with INO80 alters the complex composition, thereby conferring cell stage and cell type‐specific functions to this ubiquitously present complex. The core INO80 complex includes over 15 subunits, which serve different functions, and several accessory factors (Chen et al, 2011; Tosi et al, 2013; Aramayo et al, 2018). By preventing recruitment of YY1, linc‐MYH targets a specific modality of the INO80 complex, related to the regulation of cell proliferation. YY1 is well known to promote proliferation of myoblasts, MuSCs, and other cells (Wang et al, 2017; Chen et al, 2019), either by direct transcriptional regulation, or via other mechanisms involving stability of proteins (Chen et al, 2019). Although it was already known that several transcriptional effects of YY1 are mediated by interaction with INO80, the regulation of this interaction has been enigmatic (Cai et al, 2007). Our experiments reveal that linc‐MYH interacts with N‐terminal parts of INO80 as well as with the MCRS1 protein also found at the N‐terminus of INO80 protein. These interactions obstruct recruitment of N‐terminal‐binding INO80 extrinsic subunits including TFPT and YY1 (Chen et al, 2011). Numerous genes containing YY1 target sites in promoter regions were upregulated in linc‐MYH‐deficient MuSCs in an INO80‐dependent manner, providing clear evidence that linc‐MYH prevents access of YY1 to the INO80 complex. YY1 targets include genes known to drive cell proliferation such as Ccnd1 (Wang et al, 2017) and Eif4g1 (Ramirez‐Valle et al, 2008; Jaiswal et al, 2018). Knock‐down of YY1 eliminates the differences in MuSC proliferation between linc‐MYH KO and control MuSCs, additionally supporting the notion that the prevention of YY1 interaction with the INO80 complex is an important feature of linc‐MYH function.
We also observed upregulation of p53 target genes after deletion of linc‐MYH, which might be due to the previously described co‐activation of p53 target genes by YY1 (Yakovleva et al, 2004). The upregulation of p53 target genes might support MuSC integrity during increased proliferation (Begus‐Nahrmann et al, 2009; Liu et al, 2018) and help myoblasts to return to quiescence (Flamini et al, 2018) as it has been described for hematopoietic stem cells (Liu et al, 2009). Linc‐MYH reduces association of the INO80 complex with WDR5, which might represent a more indirect means to limit proliferation of MuSCs. WDR5 is a known adaptor protein that might connect the INO80 chromatin remodeler to the transcriptional activator MLL. In fact, the interaction of INO80 and WDR5 has been previously described to support cell type‐specific transcriptional regulation (Cai et al, 2010; Wang et al, 2014; Zhou et al, 2016). Hence, exclusion of WDR5 from INO80 via linc‐MYH might reduce transcription of genes supporting proliferation of MuSCs. It is possible that recruitment of WDR5 to the INO80/YY1 complex specifically enhances transcriptional activity of the pro‐proliferative YY1/INO80 complex, although we did not investigate these possibilities. However, we did not detect components of the MLL complex in the INO80 pull‐down experiments. Thus, interaction of the WDR5 adapter protein with INO80 might have a different MLL‐independent function as previously described in a different context (Dias et al, 2014).
Remarkably, linc‐MYH did not affect the stoichiometry of core nucleosome‐sliding INO80 complex components such as RUVBL1/2 and ACTR5/8 (Aramayo et al, 2018; Brahma et al, 2018; Eustermann et al, 2018), nor the function of the INO80 complex in DNA repair and recovery from replication stress (Vassileva et al, 2014). Packaging of DNA into chromatin is a major obstacle to repair double‐strand breaks and allow base excisions repair. This obstacle can be resolved by modulation of nucleosome structures via chromatin remodelers providing access of signaling and repair machineries to damaged DNA (Morrison, 2017). INO80 seems particularly important in this respect. Several studies demonstrated that the chromatin remodeling and nucleosome‐sliding properties of the INO80 chromatin remodeler are crucial to deal with consequences of DNA damage and replication stress in different organs and mammalian cell types (Ayala et al, 2018; Eustermann et al, 2018). The ACTR8 subunit is essential for recruitment of the INO80 complex to DNA damage sites marked by yH2AX, thereby facilitating DNA repair (Kashiwaba et al, 2010; Vassileva et al, 2014). We found that linc‐MYH did not affect the presence of ACTR8 in the INO80 complex, allowing normal replacement of yH2AX in linc‐MYH mutant MuSCs. Accordingly, we only observed attenuated enrichment of gene sets associated with DNA strand replication and telomere maintenance in INO80 and INO80/linc‐MYH mutant MuSCs but not in linc‐MYH mutant MuSCs. The specific effect of linc‐MYH on the pro‐proliferative function of the INO80 complex without affecting DNA repair functions is important: Increased expression of pro‐proliferation genes and enhanced cell proliferation generates more replication stress, which has to be handled. Molecules acting on complexes regulating both DNA repair and cell proliferation need to avoid reduction in DNA repair activities when regulating proliferation.
The crucial role of linc‐MYH in controlling INO80 complex formation and transcriptional activity for regulation of MuSC proliferation also has important consequences for skeletal muscle physiology. We found that the increase in proliferating MuSCs in skeletal muscles of linc‐MYH mice resulted in myofiber hypertrophy as indicated by increased cross‐sectional areas. Since myofibers in linc‐MYH mutant animals contain increased myonuclei contents and show no signs of endomitosis, we reason that muscle hypertrophy is caused by the fusion of supernumerous MuSCs to myofibers (Abmayr & Pavlath, 2012). One might wonder why evolution has shaped a role for linc‐MYH to limit skeletal muscle hypertrophy, which is widely assumed to be beneficial. Yet, unnecessarily increased muscle mass boosts energy demand and is an evolutionary liability when food supply is limited. In fact, gene variants causing hypermuscularity, particularly in humans, are relatively rare. A popular example is the myostatin gene, which prevents skeletal muscle hypertrophy (Schuelke et al, 2004; Das et al, 2019). It has been argued that energy expenses in the skeletal musculature have been traded for enhanced growth of energetically costly brains, essentially postulating reciprocal evolution of brain and muscles (Bozek et al, 2014).
Increased proliferation of MuSCs might be beneficial for regeneration of skeletal muscle. Yet, we did not detect signs for enhanced skeletal muscle regeneration in linc‐MYH so far, which might in part be due to the CTX damage model, causing severe depletion of MuSCs (Hardy et al, 2016). Failure to detect an advantage of linc‐MYH‐deficient mice in the early stage of muscle regeneration might be explained by the massive stimulation of MuSC proliferation by external cues dominating the control of proliferation of MuSCs early after CTX damage, while linc‐MYH rules the control of MuSC proliferation under conditions of muscle homeostasis. This is mirrored in the MuSCs in vitro, where the early strong proliferation in response to isolation is not significantly different between WT and linc‐MYH‐deficient MuSCs, but higher proliferation is observed in linc‐MYH‐deficient MuSCs at later stages of MuSC proliferation. In vivo in later stages, we found exaggerated hypertrophy of individual myofibers after CTX‐induced muscle damage, which increased heterogeneity among muscle fibers compared with undamaged muscles from linc‐MYH mutants and regenerated muscles of control animals. We did not analyze effects of a loss of linc‐MYH in pathological conditions or during aging, which might generate a different scenario, in particular since aging goes along with a severe decline of MuSC proliferation and a reduction in MuSCs (Garcia‐Prat et al, 2013). We observed increased MuSC numbers and proliferation in 8‐month‐old mice, and it would be interesting to investigate whether the increased proliferation rate of linc‐MYH KO MuSCs prevents some consequences of skeletal muscle aging and thus might be used for therapeutic purposes.
Much to our surprise and in addition to increased proliferation, we observed a strong increase in quiescent MuSCs in linc‐MYH‐deficient muscles, although linc‐MYH is not expressed in quiescent but only in proliferating MuSCs. The increase in quiescent MuSCs is stable, depends on the presence of INO80 in MuSCs, and is re‐established even after extensive muscle damage and subsequent regeneration. The most plausible explanation for this finding is that the extent of MuSC proliferation determines the size of the quiescent MuSC population. Increased numbers of proliferating MuSCs might enhance the chance of stochastic or nonrandom asymmetric cell divisions, required for formation of the stem cell niche (Almada & Wagers, 2016; Feige et al, 2018). Such a process has to occur relatively late during MuSC expansion, at a time point when the linc‐MYH gene within the Myh3‐Myh13 cluster is activated. Nonetheless, we cannot rule out a more indirect mechanism, in which an enlarged population of late‐stage proliferating MuSCs signals back to still resting MuSCs, thereby regulating early cell decision events that determine the fate and size of the quiescent MuSC pool.
In summary, we identified a novel mechanism that limits expansion of MuSCs during postnatal skeletal muscle development and regeneration by upregulation of the evolutionary conserved long non‐coding RNA linc‐MYH. Linc‐MYH acts as a selective molecular switch by preventing association of YY1 and WDR5 with the INO80 chromatin remodeler complex. Incorporation of linc‐MYH into the INO80 complex eradicates the pro‐proliferative capacity of the complex but leaves its DNA repair functions intact. Removal of the linc‐MYH‐dependent molecular switch enhances proliferation of MuSCs, causes hypertrophy of skeletal muscle fibers, and increases the number of quiescent MuSCs. The linc‐MYH example provides a paradigm of how lncRNAs add new layers of regulation to specifically control complex cellular functions in mammalian cells.
Materials and Methods
Animal models
The genomic locus coding for both isoforms of linc‐MYH (AK010044 and AK079404) was deleted from the mouse genome by homologous recombination. A 16.7 kb genomic fragment ranging from GCGGCCGCTGTGCTTTCCACCTCACCAC to ATAGCGTCCATAGTTCTGGAGGTCC was inserted into a pKO II vector containing a diphtheria toxin selection cassette by Gap‐repair (Warming et al, 2005) using a bMQ mouse BAC clone (BMQ105‐D23; Source BioScience; #BMQ105‐D23; Adams et al, 2005). An AscI site was inserted into the AvaI digested vector using oligonucleotides, and a loxP‐flanked neomycin resistance cassette was inserted using this site. Homologous recombination events in embryonic stem (ES) cells were detected by Southern Blot by a PCR‐generated probe (CGAACAGTGCTTCTCCAAGAAGGT/TATCAGGGAGGAAGTCTTCAGGTC) using AvaI digested genomic DNA. Mice were generated from ES cells using standard procedures. The neomycin resistance cassette was removed by FLP recombination using ACTB‐FLPe mice (Rodriguez et al, 2000) to generate the linc‐MYHKO/(−/−) allele. Genotypes of mice were determined by PCR using oligonucleotides (AGCTCTGAAACTCCAGAATCTGCCT, CCGCCCTGAGCAGAATGAATGGACG, CTCGTTGTCAGTTCTGTATAGACCC). The 266‐bp fragment identifies the WT allele, and the 417‐bp fragment identifies the FLP‐deleted allele.
A second linc‐MYH loss of function model was generated by insertion of a poly‐A cassette into the third exon of 2310065F04Rik‐201/ENSMUST00000125538.7/AK010044 using CRISPR‐CAS9‐targeted homology‐directed repair. Insertion of the cassette also represses transcription of the variant 2310065F04Rik‐202/ENSMUST00000153497.1/AK079404. The guide RNA CAGCTCATTGAACAGTCGAG was inserted into pSpCas9(BB)‐2A‐Puro (PX459) V2.0 (addgene#62988), and the resulting vector was transfected into ES cells together with the oligonucleotide (ACAAATGAGCCTGGTCAGAGATTGTGAGCCCTGCCTTTGAATCACCTGGGTAGATCTGCAAGTTACTGATAATTCTGGTTACAAATAAAGCAATAGCATCACAAATTTCACAAATAAAGCATTTTTTTCAGGGTCCAAGCTCCAGGCTTTTCCAAAGTTCCTTCCACGGTTGTGATGTGCAGGAAGAACTGAAAGGCCCT) using the Lipofectamine protocol (Ran et al, 2013). ES cells were selected using puromycin (2 mg/ml, 1 day after transfection for 2 days), and recombinant clones were identified by PCR (GTCTTACATTACCTACCTAGAAGGA, GGTTACAAATAAAGCAATAGCATCA/CCTGTCAGAAACCTCAGATACCATC). PCR fragments of 237‐bp indicate the WT allele, while the 259‐bp fragment indicates presence of the poly‐A allele. Mice were generated from ES cells using standard procedures. Chimeric mice were mated to C57BL/6, and animals used for analysis were backcrossed to C57BL/6 for > 3 generations. For MuSC and muscle‐specific deletion of INO80, a floxed Ino80 allele (Qiu et al, 2016) and a Pax7‐Cre driver strain were used (Keller et al, 2004). To delete INO80 in adult MuSCs, the Pax7‐CreERT2 allele (Murphy et al, 2011) was used together with tamoxifen injections (75 mg/kg BW for 5 days at 6 weeks of age).
A V5 tag was inserted at the C‐terminus of INO80 using CRISPR‐CAS9‐targeted homology‐directed repair. The guide RNA (gCCTCTGGAGGACGGTAACCA) was inserted into pSpCas9(BB)‐2A‐Puro (PX459) V2.0 (addgene#62988), and the resulting vector was transfected into ES cells together with the oligonucleotide (CCTAAAAGCCTCCACATGACCAGCAGCCTAGCCTCAGACTCCTTGATCCGGAAACAAGGCAAAGGCACCAACCCCTCTGGAGGACGCCCCGTGGTTGGTAAGCCTATCCCTAACCCTCTCCTCGGTCTCGATTCTACGTAGTAATAACCATCGTAACCATCTCTGCCCTCTAGCTTCCTTCAACCAAACCAGGGGCTACA) using the Lipofectamine protocol as above. Recombinant clones were identified by PCR using the oligonucleotides (GTCCGACCTGCTGGCCTTGCAG/GCCATCCAAAGACCACCTATGGC). The 266‐bp PCR fragment identifies the WT allele and the 332‐bp fragment the Ino80‐V5 allele. For FACS isolation of MuSCs, the transgenic Pax7‐ZsGreen reporter (Bosnakovski et al, 2008) was mated to the respective mouse lines.
Mice were kept in IVC with ad libitum access to water and food. All animal experiments were done in accordance with national and European community guidelines and were approved by the Committee for Animal Protection of the State of Hessen (Regierungspraesidium Darmstadt).
EdU and Cardiotoxin administration in adult mice
Mice were intraperitoneally injected using 10 μl/g BW labeling solution (5 mg/ml EdU in 0.9% saline; Thermo# E10187) to identify newly synthesized DNA in vivo. Adult mice were injected daily for 14 days and 3‐week‐old animals for 5 days; skeletal muscle tissue was recovered 24 h after the last injection. Cardiotoxin injection into the TA muscle was performed as described previously (Boonsanay et al, 2016). Briefly, animals were anesthetized by intraperitoneal injection of Ketamine/Xylazine and one leg of the animal was shaved. The needle of the 0.06 mg/ml cardiotoxin‐containing syringe (Sigma#C9759‐5MG) was inserted along the center of the TA muscle from foot toward the knee and 50 μl of a 0.06 mg/ml cardiotoxin solution was injected into the TA muscle while retracting the needle. For analgesia, the animals received metamizole via the drinking water (1.6 g/l Novaminsulfon; Zentiva).
RNA‐Fluorescence in situ hybridization (RNA–FISH)
linc‐MYH FISH was done using the ViewRNA ISH cell assay kit from Panomics (#QVC0001) with probe sets detecting linc‐MYH (VX1‐99999‐01; Alexa Fluor 546, custom‐designed against AK010044), Xist (VB4‐18068, Alexa Fluor 488), and Adipor (VB4‐16777, Alexa Fluor 488). Hybridization and detection were performed according to the supplier's instructions with fixation of differentiated C2C12 (ATCC) cells in 1% formaldehyde for 10 min and one hour of trypsin incubation.
RNA–protein pull‐down
Proteins interacting with candidate RNA molecules were identified by an in vitro RNA—protein pull‐down approach in combination with MS analysis. Control lncRNAs were used in addition to linc‐MYH isoforms to detect unspecific RNA–protein interactions. Templates for RNA synthesis were obtained by PCR amplification using Phusion DNA polymerase (Thermo Scientific, F‐553L) based on a plasmid template and primers supplying a T7 promoter sequence (linc‐MYH, AK079404: Source BioScience#9830118E10, GTAATACGACTCACTATAGGGCTCTCTCTCGGCTCAGCCCTGAGTGTCTCCAGAGG, ATCACAACATCCTTGTGGGGGATTTA‐TTGC) or by linearization of plasmid templates (AK142388, Fantom#D430033I02, ApaI; MG243346, Fantom#D430033I02 plus PCR amplified 5′ sequence, ApaI; AK009488: Source BioScience#2310024A14, BamHI). Templates for individual exons or parts of exons and templates for controls were amplified using oligonucleotides described in Appendix Table S4. An additional control was prepared using a plasmid template (AK086006, Fantom#D830044D09, BamHI). RNA was synthesized from templates by the T7 RiboMAX™ Express Large Scale RNA Production System (Promega #P1320) following the manufacturer's instructions, but with transcription time extended to 2 h. 50 pmol of RNA was biotinylated using the Pierce™ RNA 3′ End Desthiobiotinylation Kit (Thermo Scientific #20163). Biotinylated RNA was recovered by mini Quick Spin RNA Columns (Roche#11814427001). Nuclear proteins of C2C12 myocytes were isolated using the NE‐PER Nuclear Protein Extraction Kit (Thermo#78833). The interaction of linc‐MYH with human INO80 was investigated using HEK293 (ATCC) cells overexpressing FLAG‐tagged full‐length INO80 or fragments of human INO80. These plasmids were a gift from Joan Conaway (addgene plasmid#: 44149, 29440, 29441, 29443, 29446; Chen et al, 2011). In addition, we used extracts of HEK293 cells expressing MCRS1 from a custom gene synthesized vector (Appendix: MCRS expression vector; BioCat). The plasmids were transfected using Lipofectamine 3000, and cells were lysed 48 h after transfection in extraction buffer (0.1 M Tris–HCl pH 8.0, 0.01 M EDTA, 10% SDS, Aqua dest, 1× cOmplete Protease Inhibitor cocktail, Roche #4693132001) by sonication. Biotinylated RNA and protein extracts were processed using the Pierce™ Magnetic RNA‐Protein Pull‐Down Kit (Thermo Scientific #20164) according to the manufacturer's instructions with some modifications (four instead of three washing steps before elution of RNA‐bound proteins). In case of C2C12 cell extracts, the eluted proteins were prepared for mass spectrometry analysis by in solution digest. In case of HEK293 cell extracts, the eluted proteins were analyzed by Western blot.
RNA immunoprecipitation (RNA‐IP)
RNA immunoprecipitation followed published protocols (Moran et al, 2012; Schweisgut et al, 2017). 50 μl Dynabeads® Protein A (Thermo Scientific 10001D) was washed twice with 300 μl RIPA Buffer (50 mM Tris–HCl pH 7.4, 1% NP‐40, 0.25% sodium‐deoxycholate, 150 mM NaCl, 1 mM EDTA) using a magnetic stand for separation of the beads. Beads were incubated with 8 μg of the respective antibody in 500 μl RIPA anti‐Ino80 antibody (anti‐INO80: Abcam#ab197043 (C2C12 cell IPs) or Abcam#ab118787 (HSMM cell IPs); IgG: Invitrogen#10400C) for 2 h at 4°C on a rotating wheel. C2C12 cells (ATCC #CRL‐1772™; DMEM 4.5 g/l Glucose, 10% FCS, 1% Pen/Strep/Glutamine) were grown to confluence, and myotube differentiation was induced for 4–5 days using differentiation medium (DMEM 4.5% Glucose; 2% horse serum, Thermo Scientific #16050130; 1% Pen/Strep/Glutamine). C2C12 cells (six 15‐cm plates for one experiment) were trypsinized, washed two times using PBS, and re‐suspended at 2 × 10⁶ cells/ml. HSMM (Lonza #CC‐2580; six 15‐cm plates for one experiment) cells were incubated in SKGM™‐2 (Lonza #CC‐3245) medium until they reached 80% confluence followed by culture in DMEM‐F12 (Thermo Fisher #11320‐033). Cell suspensions were incubated with 1% formaldehyde (Thermo #28908) for 10 min at room temperature. Thereafter, glycine was added to a final concentration of 0.125 mM, and cells were washed two times using PBS and re‐suspended in 2.4 ml RIPA buffer including cOmplete proteinase inhibitor (Roche# 04693159001) and RNasin 1:100 (Promega# N2615). Cells were lysed using a Covaris Evolution E220 (1 min, 100 W peak power, 200 cycles/burst, 2.0 duty factor), and cell debris was removed by centrifugation (5,000 g, 5 min). 100 μl of the lysate was saved for RNA isolation (input). Antibody‐bound beads were washed twice using 400 μl RIPA and incubated over night with 1 ml cell lysate on a rotating wheel at 4°C. After incubation, beads were separated from the supernatant, which was saved for subsequent analysis, and washed 4 times using 500 μl RIPA (4°C). Thereafter, beads were washed 4 times using 500 μl of high‐salt RIPA (50 mM Tris–HCl pH 7.4, 1% NP‐40, 0,25% sodium‐deoxycholate, 150 mM NaCl, 1 mM EDTA, 4 M Urea) and once using PBS. The pellet was re‐suspended in 100 μl Buffer C (Tris–HCl 50 mM pH 7,4, NaCl 150 mM, 5 mM EDTA pH 8.0, 10 mM DTT, 1% SDS), 10 μl Proteinase K (Thermo Scientific #EO0491), and 1 μl RNasin (Promega #N2511) was added. Samples were incubated at 42°C for 30 min, followed by 4‐h incubation at 65°C, and 1 ml TRIzol was used for RNA isolation. RNA was further purified using RNAeasy clean‐up kit (Qiagen #74104), and RNA was eluted in 30 ml, 8 μl of RNA was used for RT reaction, and PCR was performed using specific oligonucleotides (linc‐MYH, AK010044: CTATGTTTTGCCAGCTCCTGCTATG, AACACTATAGCCCTCAAGATGGGAGG; ctrl‐lncRNA1, AK07210: GTCTCACCATTCCTAGGCTGCCAGC, CAAGGCCACTCTGATGGAGGCACT; ctrl‐lncRNA2, AK014378: GTCCTGAGCAGTCCAGGCTGGAAGC, CGACAACTCAGTGCTCAGGAATGTC; hsa‐linc‐Myh, AK097500: CATGGTCTTGACACTTTGAGGACTA, TTGCATAAATGAGTCCGATGCACAG; hsa‐Gapdh: ACCACAGTCCATGCCATCAC, CATGCCAGTGAGCTTCCCGT).
Isolation of myofibers and immunostaining
To isolate myofibers, the flexor digitorum brevis muscle was extracted from hind limb feet and digested in 1 ml 0.1% Collagenase P Solution (Sigma‐Aldrich #11213873001) in DMEM (Sigma‐Aldrich #D5796) for two hours. Fibers were isolated by pipetting the digested muscle up and down with a Pasteur pipette until individual single fibers were visible. The single fibers were transferred to DMEM with 10 % FCS (Gibco#10270106) and 1% PSG (Thermo Fisher Scientific #10378016) in a FACS sorting tube (Fisher Scientific #352235). Immunofluorescence staining was performed as described for cryosections, but free floating fibers were collected at the bottom of the staining tube by gravity.
Immunofluorescence stainings
For immunofluorescence staining, 10 μm cryosections mounted on Superfrost Ultra Plus slides (Thermo#J3800AMNZ) were used. Tissue sections were dried at room temperature, fixed for 5 min using 4% paraformaldehyde/PBS, washed three times 10 min using 0.3% Triton X‐100/PBS, and incubated in blocking solution (0.01% Triton X‐100, 1/10 Blocking One (Nacalai#03953‐95)/PBS). When using mouse monoclonal antibodies, Mouse‐on‐Mouse Blocking Reagent (Vector labs#MKB‐2213) was added 1:25 to the blocking solution. After blocking, sections were washed 10 min using PBS and sections were incubated with primary antibodies (mouse anti‐PAX7, R&D systems#MAB1675; rabbit anti‐Laminin, Sigma#L9393 or rabbit anti‐CalcR, Bio‐Rad #AHP635, rabbit anti MyoD, Abcam #ab64159, rabbit anti‐γH2AX, Cell Signaling #2577) in solution A (Nacalai Tesque #02272‐74) at 4°C overnight. Sections were washed three times 10 min in 0.01% Triton X‐100/PBS. Subsequently, sections were incubated with secondary antibodies (goat anti‐mouse IgG‐Alexa Fluor488, Jackson#115‐545‐205; goat anti‐mouse IgG‐Alexa Fluor 594, Jackson#115‐585‐205; goat anti‐rabbit IgG‐Alexa 488, Thermo#A11070; goat anti‐rabbit IgG‐Alexa 680, Thermo#A21076) in solution B (Nacalai Tesque # 02297‐64) for 1 h and washed two times using 0.01% Triton X‐100/PBS. DAPI (Sigma‐Aldrich #10236276001) was applied 1:1,000 in 0.01% Triton X‐100/PBS for 5 min, and after a final washing step, sections were embedded in Fluoromount W (Serva #21634.01). Staining for EdU incorporation was done after the three Triton X‐100 washing steps according to the supplier's manual. The Click‐iT™ Plus EdU Alexa Fluor™ 594 Imaging Kit (Thermo Fisher #C10639) was used for all EdU experiments.
Identification of skeletal muscle fiber types was performed as described previously (Wust et al, 2018). Concentrated monoclonal antibodies against 1 MyHC (DSHB #BA‐D5), 2A MyHC (DSHB #SC‐71), 2B MyHC (DSHB #BF‐F3) (developed by S. Schiaffino, obtained from DSHB) in combination with AffiniPure goat anti‐mouse IgG, Fcγ subclass 2b—DyLightTM405 (111‐475‐207), goat anti‐mouse IgG, Fcγ subclass 1—Alexa Fluor® 488(115‐545‐205), and goat anti‐mouse IgM μ chain—Alexa Fluor® 594 (115‐585‐075; Jackson ImmunoResearch) were used. Tissues were snap‐frozen on liquid nitrogen, and 10 μm cryosections were mounted on Superfrost ultra plus slides (Thermo Scientific #J3800AMNZ). Tissue sections were dried at RT, fixed with 4% PFA/0.1% sodium‐deoxycholate/0.02% NP‐40/PBS for 5 min, washed 3 times with PBS, and blocked in 2% FCS, 0.5% NP‐40/PBS for 1 h. Sections were incubated with primary antibodies (1:100) overnight at 4°C, washed three times with PBS, and incubated with secondary antibodies (1:500), followed by washing three times with PBS and embedding in Fluoromount W (Serva #21634.01).
Transmission electron microscopy
Tissues were fixed by perfusion with 1.5% paraformaldehyde, 1.5% glutaraldehyde, and 0.15 M HEPES and were kept in fixative for at least 24 h at 4°C. Thereafter, tissue was fixed in 1% osmium tetroxide solution (Sigma #75633) and incubated in uranyl‐acetate (Agar Scientific #AGR1260A). Tissues were dehydrated in an ascending series of ethanol and embedded in Agar 100 Resin (Agar Scientific #AGR1031). Muscles we sectioned using an ultra‐microtome and analyzed using a TEM Zeiss EM 902 and Zeiss LEO 906.
Fluorescence‐activated cell sorting (FACS)‐based MuSC isolation and culture
Skeletal muscle tissue was dissected from individual mice and transferred into DMEM (Thermo#31966‐021) containing 2% penicilin–streptamycin (Sigma #P0781‐100 ml). The tissue was minced using a McIlwain Tissue Chopper (TC752), and tissue debris was removed by brief centrifugation (1 min, 1,200 g). The supernatant was digested with occasional vortexing using Dispase (BD #354‐235; 1:10 in solution) for 30 min, followed by Collagenase II digestion (Worthington # LS004185; 1:10 in solution) for 30 min. Thereafter, fetal calf serum (Sigma‐Aldrich #F7524‐500ML, 10% f.c.) was added to the suspension. The cell suspensions were filtered using 100 μm, 70 μm, and 40 μm cell EASYstrainer (Greiner#54200, 542070 and 542040), and cells were collected by centrifugation (5 min, 1,200 g). Cells were incubated in 200 μl cell sorting buffer (CSB: 1× PBS, 1 mM EDTA, 25 mM HEPES pH7.0, 1% FCS) containing anti‐CD45‐APC, anti‐CD31‐APC, and anti‐Ly‐6A/E (Sca‐1)‐APC antibodies (eBioscience #17‐0451, 17‐0311, 17‐5981, 1:100 each) for 30 min at 4°C. Cell suspensions originating from mice without ZsGreen marker gene expression were incubated for one hour with anti‐CD45‐APC, anti‐CD31‐APC, and anti‐Ly‐6A/E (Sca‐1)‐APC and additionally with anti‐CD34‐Alexa 450 (eBioscience #48‐0311‐80; 1:100) and anti‐integrin‐FITC (MBL #K0046‐4; 1:100) antibodies. Cells were washed, centrifuged (5 min, 1,200 g), and re‐suspended in 200 μl CBS containing 30 μl anti‐APC MicroBeads (Miltenyi #130‐090‐855) for 20 min at 4°C. CSB, CD31, CD45, and Sca‐1‐positive cells were depleted using the Miltenyi AutoMACS. Pax7‐ZsGreen‐labeled MuSCs were stained with DAPI (Invitrogen, #D1306), and samples with antibody labeling were stained with propidium iodide (Sigma‐Aldrich, #P4864‐10ML) to allow identification of dead cells. FACS sorting was done using a BD Aria III. Debris and clumps were excluded using forward and side scatter parameters. Dead cells were excluded using DAPI/PI, and residual APC‐positive cells were excluded. Pax7‐ZsGreen‐labeled cells were analyzed and sorted using 488 nm excitation and emission at 530/30 nm. Antibody labeled MSCs were isolated based on co‐detection of CD34‐Alexa 450 (ex. 405 nm, em 450/40 nm) and Integrin‐FITC (ex. 488 nm, em: 530/30 nm) signals. Isolated cells were cultured on Matrigel (Fisher # CB356238) covered dishes in proliferation medium (DMEM + GlutaMAX™ #31966‐021, 20% FCS, 2% PS). Cells were seeded at a density of 6,000 cells/cm². Half of the medium was exchanged every 2 days. Upon confluence, medium was exchanged to differentiation medium (DMEM 4.5% Glucose; 2% horse serum, Thermo Scientific #16050130; 1% Pen/Strep/Glutamine).
Analysis of cell confluence
Confluence of MuSCs during proliferation and differentiation was determined using an IncuCyte Zoom system (Essen BioScience). The basic analyzer tool was adjusted to segment satellite cells from background as recommended by the company's technical notes using representative phase contrast images. Conditions were set for a minimum area of 180 μm² and a maximum of 5 × 107 μm². Pictures of cells were taken at least every 3 h. MuSCs were cultured in clear bottom 96‐well plates (Greiner #655090) as described above.
Knock‐down experiments
For knock‐down of YY1 in activated MuSCs, isolated MuSCs were transfected with shRNAs against Yy1 (Sigma‐Aldrich Mission shRNA library, clone#pLKO1#TRCN0000054555) 72 h after isolation of the MuSCs. Lipofectamine 3000 (Thermo#L3000015) was used according to the manufacturers’ instructions. Cell confluence was monitored with the IncuCyte Zoom system for 95 h every 60 min as described. RNA was isolated using the miRNeasy Mini Kit (Qiagen #1038703). RT reaction and qPCR were done as described below using Yy1‐specific oligonucleotides (TTCAGAATAATCAGGAGGTGAGTTC, GCGAGTTCTCGGTCACCATGTGGTC).
RNA isolation and cell fractionation
RNA was isolated from PBS‐perfused tissues or cultured cells using the TRIZOL method according to the manufacturer's instructions. To separate nuclear and cytoplasmic RNA, C2C12 cells were grown to confluence on a 10‐cm cell culture dish, washed twice with ice‐cold PBS, and recovered in 1 ml PBS using a cell scraper. Cells were centrifuged at 1,000 g for 10 min, and the cell pellet was re‐suspended in 200 μl of cell lysis buffer (10 mM Tris pH 8.0, 140 mM NaCl, 1.5 mM MgCl2, 0.5% NP‐40). Re‐suspended cells were kept on ice for 5 min, flicked from time to time, and centrifuged at 1,000 g for 3 min. The supernatant was recovered as cytoplasmic fraction. RNA was isolated from the cytoplasmic fraction after addition of 700 μl of TRIzol. The remaining pellet was re‐suspended twice in cell lysis buffer followed by centrifugation for 3 min at 1,000 g and once using a wash buffer (cell lysis buffer with additional 1% Tween‐40 and 0.5% deoxycholic acid). The remaining pellet, representing the nuclear fraction, was re‐suspended in 700 μl TRIzol, and RNA was isolated. In addition, a human tissue RNA collection (Clontech human total RNA master panel II cat#636643) was used for RT–PCR experiments.
Transcriptome analysis and RT–PCR
Quality of isolated RNAs was confirmed using the Agilent 2100 Bioanalyzer in combination with Agilent RNA 6000 Pico or Nano KIT. RNA isolated from in vitro cultured MuSCs was analyzed using the mouse Clariom™ D Pico Assay Kit. RNA isolated from mouse tissues was analyzed using the mouse Clariom D Assay Kit strictly following the manufacturer's protocols. Data were analyzed using the Affymetrix Expression Console 1.4 with sst‐RMA and DNASTAR Arraystar15. Gene set enrichment analysis (Subramanian et al, 2005) was performed using default parameters with permutation type gene sets. The maximum gene set size was adjusted from 50 to 1,000. For (q)RT–PCR, RNA was reverse transcribed using Superscript II (Thermo# 18064‐022) and gene‐specific oligonucleotides were used to the detect the transcripts (mmu‐linc‐MYH: GTGCAGCCAGAACAAGACAGACAGT, GTGGTAATTGTAGGTGGTGAGCAGA (GAGCTGGCAAAACATAGTCCCTTCT for qRT–PCR), hsa‐linc‐MYH: CATGGTCTTGACACTTTGAGGACTA, TTGCATAAATGAGTCCGATGCACAG, hsa‐/mmu‐GAPDH, ACCACAGTCCATGCCATCAC, CATGCCAGTGAGCTTCCCGT). For quantitative RT–PCR, the KAPA SYBR FAST kit (Kappa Biosystems #KK4618) was used together with the Applied Biosystems StepOnePlus real‐time PCR system.
Immunoprecipitation of the INO80 complex
For immunoprecipitation, protein extracts were prepared from TA muscle of WT and linc‐MYH KO mice or from INO80‐V5 and linc‐MYH KO/INO80‐V5 animals. Isolated TA muscle was frozen in liquid nitrogen until further use. Tissue was disrupted by the Covaris cryoPREP™ Extraction System (cryoPREP™ CP02) using the Tissuetube™ (#TT05) and three times maximum power disruption. The sample was transferred into an Eppendorf tube with 10 μl/mg tissue RIPA buffer (50 mM Tris–HCl pH 7.4, 1% NP‐40, 0.25% sodium‐deoxycholate, 150 mM NaCl, 1 × Protease Inhibitor Cocktail III (Merck#539134)) and was homogenized using a Ultrasonic Homogenizer (Bandelin Sonopuls with MS72 probe) using cycle 5, 30 % power for 30 s. The lysate was incubated at 4°C on a rotating wheel for 30 min, followed by a 20,000 rcf centrifugation at 4°C for 20 min. The supernatant was stored as protein lysate at −80°C until further use. 60 μl/sample G‐Sepharose‐beads (Millipore#P3296) was washed twice using 1 ml RIPA buffer, incubated in 1 ml 3% BSA (Sigma#A7284)/RIPA at 4°C on a rotating wheel for 1 h, washed twice using 1 ml of RIPA, and re‐suspended in 60 μl of RIPA. 1 ml of protein lysate (2 mg/ml) was incubated with 30 μl bead suspension to scavenge proteins binding non‐specifically to the beads at 4°C on a rotating wheel for 1 h. The supernatant was recovered and 10 μg of anti‐INO80 (Proteintech #18810‐1‐AP), or 4 μg of anti‐V5 antibody (Abcam #ab27671) was added, respectively. 30 μl of blocked beads was added to the IP‐mixture followed by incubation at 4°C on a rotating wheel overnight. Beads were washed three times using 1 ml RIPA at 4°C on a rotating wheel for 10 min each time, and co‐precipitated proteins were identified by mass spectrometry. For Western blot analysis, beads were re‐suspended in Laemmli buffer at 95°C for 5 min and equal amounts of sample were used for analysis.
Western blot analysis
Muscle tissue of 6‐ to 25‐week‐old mice was lysed in RIPA buffer (50 mM Tris–HCl pH7.4, 150 mM NaCl, 1% NP‐40, 0.25% Na‐Deoxycholate, 1× cOmplete Protease Inhibitor cocktail, Roche #4693132001) by sonication. HEK 293 cells were lysed as described for the RNA–protein pull‐down. 10–40 mg of protein extracts was separated using a 9% Bis‐Tris SDS–PAGE for muscle tissue protein extracts and precast protein gels (Thermo #NBP0321BOX) for cellular protein extracts. Proteins were blotted onto nitrocellulose membranes. The following antibodies were used after blocking membranes with 3% BSA in TBS‐T: Anti‐RuvBl1 (1:1,000; Proteintech #10210‐2‐AP), anti‐RuvBl2 (1:1,000; Bethyl #A302‐536A), anti‐TFPT (1:500; Proteintech#10097‐2‐AP), anti‐WDR5 (1:1,000; Bethyl #A302‐430A), anti‐YY1 (1:1,000; Cell signaling #46395), RalA (1:5,000; Becton Dickinson #R23520), anti‐V5 (1:5,000; Invitrogen #R960‐25), and anti‐FLAG (1:1,000, Sigma‐Aldrich #F1804). Secondary antibodies were anti‐mouse‐HRP (1:5,000, Thermo #31450) and anti‐rabbit‐HRP (1:5,000, Thermo #31460).
In situ proximity ligation assay
The in situ proximity ligation assay (PLA) was performed on fixed primary proliferating MuSCs using the DuoLink PLA fluorescence technology (Sigma‐Aldrich#DUO92101), following the manufacturer′s protocol. About 2,000 isolated muscle satellite cells were seeded per well of a 96‐well plate and grown to a confluence of about 80%. Cells were fixed using 4% PFA for 7 min at room temperature. Myoblasts were then permeabilized with 0.3% Triton X‐100 in PBS three times for 5 min at room temperature. After two washing steps with PBS, cells were incubated with blocking solution in a humid chamber for 60 min at 37°C followed by incubation with primary antibodies for 1 h at room temperature. The assay was always performed with pairs of antibodies produced in mouse or rabbit, diluted 1:5,000 in antibody diluent. An anti‐V5 tag antibody (Thermo Scientific; 37–7,500) recognizing the endogenous V5‐tagged INO80 was used in combination with anti‐YY1 (Cell Signaling#46395), anti‐WDR5 (Bethyl#A302‐429A), and anti‐Ruvbl2 (Bethyl#A302‐536A) antibodies, respectively. PLA probe incubation, ligation, and signal amplification were performed according to the manufacturer's protocol. After two washing steps with PBS, DAPI was diluted 1:5,000 in PBS and added to the cells for 5 min at room temperature.
RNA in situ hybridization‐proximity ligation assay (rISH‐PLA)
Interaction between linc‐MYH and INO80 was confirmed using the rISH‐PLA assay (Roussis et al, 2017). Five biotinylated 2′‐O‐Methyl RNA oligonucleotides against linc‐MYH were designed using the Stellaris design tool (https://www.biosearchtech.com/support/education/stellaris-rna-fish: [Btn]GCCATTTGGTATACAGTCTGC[mA][mC][mG][mU], [Btn]CTCGTTGTCAGTTCTGTATAGACCC[mA][mC][mG][mU], [Btn]CATTAGCTGTGGCTACATTA[mA][mG][mU][mC], [Btn]AGATTAGGGATGCTGCCTTG[mA][mC][mG][mU], [Btn]TGTCACTGGGGACTCAATAC[mA][mC][mG][mU]), anti‐biotin antibody (Abcam #ab53494) and an anti‐V5 tag antibody (Thermo Scientific; 37‐7500) was used in the assay. The assay was performed as described using freshly isolated MuSCs grown on Greiner CELLSTAR® 96‐well plates (Greiner #M0562‐32EA) until the cells reached proliferating stage (72 h). The growth medium was removed, and the cells were fixed using 4% paraformaldehyde for seven minutes.
Mass spectrometry
For immunoaffinity precipitations, equal sample volumes were separated by polyacrylamide electrophoresis (NuPAGE 4–12% Bis‐Tris gel, Thermo Fisher Scientific) prior to in‐gel digestion (Shevchenko et al, 2006). Gel lanes were cut into seven blocks and diced finely. Gel‐embedded proteins were subsequently reduced (10 mM dithiothreitol) and alkylated (55 mM iodoacetamide), followed by overnight digestion using trypsin (Serva). Peptides were gradually eluted from the gel by increasing concentrations of acetonitrile.
lncRNA‐pull‐downs were digested off‐bead as follows: The pellet of magnetic beads was re‐suspended in 6 M urea/2 M thiourea and proteins sequentially reduced (10 mM dithiothreitol) and alkylated (55 mM iodoacetamide) shaking at room temperature for 30 min, each. After a 3‐h peptidolysis using 0.5 μg of Lys‐C (Promega) with shaking at room temperature, samples were diluted four‐fold with 100 mM triethylammonium bicarbonate. After addition of 0.5 μg trypsin (Serva), samples were incubated overnight while shaking, followed by magnetic removal of the beads.
Peptides from both sample types were finally desalted, concentrated, and stored on stop and go extraction (STAGE) tips (Rappsilber et al, 2003). Samples were subsequently analyzed by liquid chromatography/tandem mass spectrometry (LC‐MS2) using in‐house packed reverse‐phase column emitters (70 μm ID, 15 cm length, ReproSil‐Pur 120 C18‐AQ, 1.9 μm, Dr. Maisch GmbH) and a buffer system including 5% acetonitrile, 0.1% formic acid, and 80% acetonitrile, 0.1% formic acid. Peptide/spectrum matching, protein group assembly, false discovery rate control (1% on the peptide and protein group level, both), and label‐free quantitation were performed using the MaxQuant suite of algorithms (Cox & Mann, 2008; Cox et al, 2014) (IP: v. 1.6.1.0; lncRNA: v. 1.6.3.4) against the murine UniProt database (canonical and isoforms; IP: downloaded on 2018/02/09, 83082 entries; lncRNA downloaded on 2019/08/19, 86161 entries).
Analysis of IP data was done using a limma‐based (Ritchie et al, 2015) in‐house R pipeline (https://github.com/bhagwataditya/autonomics), including differential expression analysis and over‐representation against gene ontology categories analysis using a Fisher exact test against the detectome. Only GO terms related to cellular components located in the nucleus were considered. Gene sets > 500 were excluded from the analysis to exclude general categories. RNA–protein pull‐down data were analyzed by gene set enrichment analysis using the GESA tool (Subramanian et al, 2005). The summarized detectome of all RNA‐protein pull‐down samples was used to generate the reference *.chip‐file. Enrichment analysis was applied to LFQ intensities of detected proteins. The Molecular Signatures Database (MSigDB) GO.all.v7.0.symbols.gmt gene sets were employed, with default settings except permutation type set to gene_set and using classic enrichment statistics. Results were filtered for gene sets with FDR P < 0.05 and for gene sets related to nuclear functions.
Quantification and statistical analysis
ImageJ was used for quantification of fiber cross‐sectional areas using the wand tool with manual correction of misalignments. Investigators were blinded for different samples. Data containing replicate values were tested for Gaussian distribution of values using GraphPad PRISM 6. All data are presented as mean ± SEM. When normality of the data was confirmed, Student's t‐test was used as indicated in the legends. When normal distribution of data was not demonstrated, non‐parametric statistical tests were used.
Author contributions
CS and TBo conceived and performed experiments. AH, SH, IK, MV, and JG performed experiments. AA optimized the sample preparation and cell sorting protocols. CS, TBr, and TBo wrote the manuscript. TBr and TBo secured funding.
Conflict of interest
The authors declare that they have no conflict of interest.
Supporting information
Appendix
Expanded View Figure PDF
Review Process File
Acknowledgements
We would like to thank Sylvia Thomas, Kerstin Richter, Susanne Kreutzer, Sonja Krueger, Alica Klaus, and Silvia Jeratsch for technical assistance. We thank Shuichi Watanabe for support with immunofluorescence protocols, Ulrich Gärtner, and Gerhard Kripp for electron microscopy. The comments of Shuichi Watanabe and Johnny Kim on the manuscript are greatly appreciated. This work was supported by the Max‐Planck‐Society, the LOEWE network ‘‘Medical RNomics’’, the DFG RTG 2355, TRR267, and TRR81. Open access funding enabled and organized by Projekt DEAL.
The EMBO Journal (2020) 39: e105098
Contributor Information
Thomas Braun, Email: thomas.braun@mpi-bn.mpg.de.
Thomas Boettger, Email: thomas.boettger@mpi-bn.mpg.de.
Data availability
Microarray data are available at Arrayexpress (E‐MTAB‐8592; https://www.ebi.ac.uk/arrayexpress/experiments/E-MTAB-8592/).
References
- Abmayr SM, Pavlath GK (2012) Myoblast fusion: lessons from flies and mice. Development 139: 641–656 [DOI] [PMC free article] [PubMed] [Google Scholar]
- Adams DJ, Quail MA, Cox T, van der Weyden L, Gorick BD, Su Q, Chan WI, Davies R, Bonfield JK, Law F et al (2005) A genome‐wide, end‐sequenced 129Sv BAC library resource for targeting vector construction. Genomics 86: 753–758 [DOI] [PubMed] [Google Scholar]
- Almada AE, Wagers AJ (2016) Molecular circuitry of stem cell fate in skeletal muscle regeneration, ageing and disease. Nat Rev Mol Cell Biol 17: 267–279 [DOI] [PMC free article] [PubMed] [Google Scholar]
- Aramayo RJ, Willhoft O, Ayala R, Bythell‐Douglas R, Wigley DB, Zhang X (2018) Cryo‐EM structures of the human INO80 chromatin‐remodeling complex. Nat Struct Mol Biol 25: 37–44 [DOI] [PMC free article] [PubMed] [Google Scholar]
- Ayala R, Willhoft O, Aramayo RJ, Wilkinson M, McCormack EA, Ocloo L, Wigley DB, Zhang X (2018) Structure and regulation of the human INO80‐nucleosome complex. Nature 556: 391–395 [DOI] [PMC free article] [PubMed] [Google Scholar]
- Baghdadi MB, Tajbakhsh S (2018) Regulation and phylogeny of skeletal muscle regeneration. Dev Biol 433: 200–209 [DOI] [PubMed] [Google Scholar]
- Begus‐Nahrmann Y, Lechel A, Obenauf AC, Nalapareddy K, Peit E, Hoffmann E, Schlaudraff F, Liss B, Schirmacher P, Kestler H et al (2009) p53 deletion impairs clearance of chromosomal‐instable stem cells in aging telomere‐dysfunctional mice. Nat Genet 41: 1138–1143 [DOI] [PubMed] [Google Scholar]
- Boonsanay V, Zhang T, Georgieva A, Kostin S, Qi H, Yuan X, Zhou Y, Braun T (2016) Regulation of skeletal muscle stem cell quiescence by Suv4‐20h1‐dependent facultative heterochromatin formation. Cell Stem Cell 18: 229–242 [DOI] [PubMed] [Google Scholar]
- Bosnakovski D, Xu Z, Li W, Thet S, Cleaver O, Perlingeiro RC, Kyba M (2008) Prospective isolation of skeletal muscle stem cells with a Pax7 reporter. Stem Cells 26: 3194–3204 [DOI] [PMC free article] [PubMed] [Google Scholar]
- Bozek K, Wei Y, Yan Z, Liu X, Xiong J, Sugimoto M, Tomita M, Paabo S, Pieszek R, Sherwood CC et al (2014) Exceptional evolutionary divergence of human muscle and brain metabolomes parallels human cognitive and physical uniqueness. PLoS Biol 12: e1001871 [DOI] [PMC free article] [PubMed] [Google Scholar]
- Brahma S, Ngubo M, Paul S, Udugama M, Bartholomew B (2018) The Arp8 and Arp4 module acts as a DNA sensor controlling INO80 chromatin remodeling. Nat Commun 9: 3309 [DOI] [PMC free article] [PubMed] [Google Scholar]
- Cabili MN, Trapnell C, Goff L, Koziol M, Tazon‐Vega B, Regev A, Rinn JL (2011) Integrative annotation of human large intergenic noncoding RNAs reveals global properties and specific subclasses. Genes Dev 25: 1915–1927 [DOI] [PMC free article] [PubMed] [Google Scholar]
- Cai Y, Jin J, Yao T, Gottschalk AJ, Swanson SK, Wu S, Shi Y, Washburn MP, Florens L, Conaway RC et al (2007) YY1 functions with INO80 to activate transcription. Nat Struct Mol Biol 14: 872–874 [DOI] [PubMed] [Google Scholar]
- Cai Y, Jin J, Swanson SK, Cole MD, Choi SH, Florens L, Washburn MP, Conaway JW, Conaway RC (2010) Subunit composition and substrate specificity of a MOF‐containing histone acetyltransferase distinct from the male‐specific lethal (MSL) complex. J Biol Chem 285: 4268–4272 [DOI] [PMC free article] [PubMed] [Google Scholar]
- Cao L, Ding J, Dong L, Zhao J, Su J, Wang L, Sui Y, Zhao T, Wang F, Jin J et al (2015) Negative regulation of p21Waf1/Cip1 by human INO80 chromatin remodeling complex is implicated in cell cycle phase G2/M arrest and abnormal chromosome stability. PLoS ONE 10: e0137411 [DOI] [PMC free article] [PubMed] [Google Scholar]
- Caretti G, Di Padova M, Micales B, Lyons GE, Sartorelli V (2004) The Polycomb Ezh2 methyltransferase regulates muscle gene expression and skeletal muscle differentiation. Genes Dev 18: 2627–2638 [DOI] [PMC free article] [PubMed] [Google Scholar]
- Carlevaro‐Fita J, Johnson R (2019) Global positioning system: understanding long noncoding RNAs through subcellular localization. Mol Cell 73: 869–883 [DOI] [PubMed] [Google Scholar]
- Chen L, Cai Y, Jin J, Florens L, Swanson SK, Washburn MP, Conaway JW, Conaway RC (2011) Subunit organization of the human INO80 chromatin remodeling complex: an evolutionarily conserved core complex catalyzes ATP‐dependent nucleosome remodeling. J Biol Chem 286: 11283–11289 [DOI] [PMC free article] [PubMed] [Google Scholar]
- Chen F, Zhou J, Li Y, Zhao Y, Yuan J, Cao Y, Wang L, Zhang Z, Zhang B, Wang CC et al (2019) YY1 regulates skeletal muscle regeneration through controlling metabolic reprogramming of satellite cells. EMBO J 38: e99727 [DOI] [PMC free article] [PubMed] [Google Scholar]
- Cox J, Mann M (2008) MaxQuant enables high peptide identification rates, individualized p.p.b.‐range mass accuracies and proteome‐wide protein quantification. Nat Biotechnol 26: 1367–1372 [DOI] [PubMed] [Google Scholar]
- Cox J, Hein MY, Luber CA, Paron I, Nagaraj N, Mann M (2014) Accurate proteome‐wide label‐free quantification by delayed normalization and maximal peptide ratio extraction, termed MaxLFQ. Mol Cell Proteomics 13: 2513–2526 [DOI] [PMC free article] [PubMed] [Google Scholar]
- Das DK, Graham ZA, Cardozo CP (2019) Myokines in skeletal muscle physiology and metabolism: recent advances and future perspectives. Acta Physiol (Oxf) 228: e13367 [DOI] [PubMed] [Google Scholar]
- Dias J, Van Nguyen N, Georgiev P, Gaub A, Brettschneider J, Cusack S, Kadlec J, Akhtar A (2014) Structural analysis of the KANSL1/WDR5/KANSL2 complex reveals that WDR5 is required for efficient assembly and chromatin targeting of the NSL complex. Genes Dev 28: 929–942 [DOI] [PMC free article] [PubMed] [Google Scholar]
- Eustermann S, Schall K, Kostrewa D, Lakomek K, Strauss M, Moldt M, Hopfner KP (2018) Structural basis for ATP‐dependent chromatin remodelling by the INO80 complex. Nature 556: 386–390 [DOI] [PMC free article] [PubMed] [Google Scholar]
- Feige P, Brun CE, Ritso M, Rudnicki MA (2018) Orienting muscle stem cells for regeneration in homeostasis, aging, and disease. Cell Stem Cell 23: 653–664 [DOI] [PMC free article] [PubMed] [Google Scholar]
- Fickett JW (1982) Recognition of protein coding regions in DNA sequences. Nucleic Acids Res 10: 5303–5318 [DOI] [PMC free article] [PubMed] [Google Scholar]
- Flamini V, Ghadiali RS, Antczak P, Rothwell A, Turnbull JE, Pisconti A (2018) The satellite cell niche regulates the balance between myoblast differentiation and self‐renewal via p53. Stem Cell Reports 10: 970–983 [DOI] [PMC free article] [PubMed] [Google Scholar]
- Fukada SI (2018) The roles of muscle stem cells in muscle injury, atrophy and hypertrophy. J Biochem 163: 353–358 [DOI] [PubMed] [Google Scholar]
- Garcia‐Prat L, Sousa‐Victor P, Munoz‐Canoves P (2013) Functional dysregulation of stem cells during aging: a focus on skeletal muscle stem cells. FEBS J 280: 4051–4062 [DOI] [PubMed] [Google Scholar]
- Gloss BS, Dinger ME (2016) The specificity of long noncoding RNA expression. Biochim Biophys Acta 1859: 16–22 [DOI] [PubMed] [Google Scholar]
- Hardy D, Besnard A, Latil M, Jouvion G, Briand D, Thepenier C, Pascal Q, Guguin A, Gayraud‐Morel B, Cavaillon JM et al (2016) Comparative study of injury models for studying muscle regeneration in mice. PLoS ONE 11: e0147198 [DOI] [PMC free article] [PubMed] [Google Scholar]
- Jaiswal PK, Koul S, Shanmugam PST, Koul HK (2018) Eukaryotic translation initiation factor 4 gamma 1 (eIF4G1) is upregulated during Prostate cancer progression and modulates cell growth and metastasis. Sci Rep 8: 7459 [DOI] [PMC free article] [PubMed] [Google Scholar]
- Kang YJ, Yang DC, Kong L, Hou M, Meng YQ, Wei L, Gao G (2017) CPC2: a fast and accurate coding potential calculator based on sequence intrinsic features. Nucleic Acids Res 45: W12–W16 [DOI] [PMC free article] [PubMed] [Google Scholar]
- Kashiwaba S, Kitahashi K, Watanabe T, Onoda F, Ohtsu M, Murakami Y (2010) The mammalian INO80 complex is recruited to DNA damage sites in an ARP8 dependent manner. Biochem Biophys Res Commun 402: 619–625 [DOI] [PubMed] [Google Scholar]
- Keefe AC, Lawson JA, Flygare SD, Fox ZD, Colasanto MP, Mathew SJ, Yandell M, Kardon G (2015) Muscle stem cells contribute to myofibres in sedentary adult mice. Nat Commun 6: 7087 [DOI] [PMC free article] [PubMed] [Google Scholar]
- Keller C, Hansen MS, Coffin CM, Capecchi MR (2004) Pax3: Fkhr interferes with embryonic Pax3 and Pax7 function: implications for alveolar rhabdomyosarcoma cell of origin. Genes Dev 18: 2608–2613 [DOI] [PMC free article] [PubMed] [Google Scholar]
- Kong L, Zhang Y, Ye ZQ, Liu XQ, Zhao SQ, Wei L, Gao G (2007) CPC: assess the protein‐coding potential of transcripts using sequence features and support vector machine. Nucleic Acids Res 35: W345–W349 [DOI] [PMC free article] [PubMed] [Google Scholar]
- Kopp F, Mendell JT (2018) Functional classification and experimental dissection of long noncoding RNAs. Cell 172: 393–407 [DOI] [PMC free article] [PubMed] [Google Scholar]
- Lee SA, Lee HS, Hur SK, Kang SW, Oh GT, Lee D, Kwon J (2017) INO80 haploinsufficiency inhibits colon cancer tumorigenesis via replication stress‐induced apoptosis. Oncotarget 8: 115041–115053 [DOI] [PMC free article] [PubMed] [Google Scholar]
- Liu Y, Elf SE, Miyata Y, Sashida G, Liu Y, Huang G, Di Giandomenico S, Lee JM, Deblasio A, Menendez S et al (2009) p53 regulates hematopoietic stem cell quiescence. Cell Stem Cell 4: 37–48 [DOI] [PMC free article] [PubMed] [Google Scholar]
- Liu L, Charville GW, Cheung TH, Yoo B, Santos PJ, Schroeder M, Rando TA (2018) Impaired notch signaling leads to a decrease in p53 activity and mitotic catastrophe in aged muscle stem cells. Cell Stem Cell 23: 544–556.e4 [DOI] [PMC free article] [PubMed] [Google Scholar]
- Machado L, Esteves de Lima J, Fabre O, Proux C, Legendre R, Szegedi A, Varet H, Ingerslev LR, Barres R, Relaix F et al (2017) In situ fixation redefines quiescence and early activation of skeletal muscle stem cells. Cell Rep 21: 1982–1993 [DOI] [PubMed] [Google Scholar]
- Marroncelli N, Bianchi M, Bertin M, Consalvi S, Saccone V, De Bardi M, Puri PL, Palacios D, Adamo S, Moresi V (2018) HDAC4 regulates satellite cell proliferation and differentiation by targeting P21 and Sharp1 genes. Sci Rep 8: 3448 [DOI] [PMC free article] [PubMed] [Google Scholar]
- Mauro A (1961) Satellite cell of skeletal muscle fibers. J Biophys Biochem Cytol 9: 493–495 [DOI] [PMC free article] [PubMed] [Google Scholar]
- Min JN, Tian Y, Xiao Y, Wu L, Li L, Chang S (2013) The mINO80 chromatin remodeling complex is required for efficient telomere replication and maintenance of genome stability. Cell Res 23: 1396–1413 [DOI] [PMC free article] [PubMed] [Google Scholar]
- Moore JW, Dionne C, Jaye M, Swain JL (1991) The mRNAs encoding acidic FGF, basic FGF and FGF receptor are coordinately downregulated during myogenic differentiation. Development 111: 741–748 [DOI] [PubMed] [Google Scholar]
- Moran VA, Niland CN, Khalil AM (2012) Co‐Immunoprecipitation of long noncoding RNAs In Methods Mol Biol, Engel N. (ed.) pp 219–228. Cham: Springer Nature; [DOI] [PubMed] [Google Scholar]
- Morrison AJ (2017) Genome maintenance functions of the INO80 chromatin remodeller. Philos Trans R Soc Lond B Biol Sci 372: 20160289 [DOI] [PMC free article] [PubMed] [Google Scholar]
- Motohashi N, Asakura A (2014) Muscle satellite cell heterogeneity and self‐renewal. Front Cell Dev Biol 2: 1 [DOI] [PMC free article] [PubMed] [Google Scholar]
- Murach KA, White SH, Wen Y, Ho A, Dupont‐Versteegden EE, McCarthy JJ, Peterson CA (2017) Differential requirement for satellite cells during overload‐induced muscle hypertrophy in growing versus mature mice. Skelet Muscle 7: 14 [DOI] [PMC free article] [PubMed] [Google Scholar]
- Murphy MM, Lawson JA, Mathew SJ, Hutcheson DA, Kardon G (2011) Satellite cells, connective tissue fibroblasts and their interactions are crucial for muscle regeneration. Development 138: 3625–3637 [DOI] [PMC free article] [PubMed] [Google Scholar]
- Oustanina S, Hause G, Braun T (2004) Pax7 directs postnatal renewal and propagation of myogenic satellite cells but not their specification. EMBO J 23: 3430–3439 [DOI] [PMC free article] [PubMed] [Google Scholar]
- Pawlikowski B, Pulliam C, Betta ND, Kardon G, Olwin BB (2015) Pervasive satellite cell contribution to uninjured adult muscle fibers. Skelet Muscle 5: 42 [DOI] [PMC free article] [PubMed] [Google Scholar]
- Pawlikowski B, Vogler TO, Gadek K, Olwin BB (2017) Regulation of skeletal muscle stem cells by fibroblast growth factors. Dev Dyn 246: 359–367 [DOI] [PubMed] [Google Scholar]
- Poli J, Gasser SM, Papamichos‐Chronakis M (2017) The INO80 remodeller in transcription, replication and repair. Philos Trans R Soc Lond B Biol Sci 372: 20160290 [DOI] [PMC free article] [PubMed] [Google Scholar]
- Qiu Z, Elsayed Z, Peterkin V, Alkatib S, Bennett D, Landry JW (2016) Ino80 is essential for proximal‐distal axis asymmetry in part by regulating Bmp4 expression. BMC Biol 14: 18 [DOI] [PMC free article] [PubMed] [Google Scholar]
- Quinn JJ, Chang HY (2015) Unique features of long non‐coding RNA biogenesis and function. Nat Rev Genet 17: 47–62 [DOI] [PubMed] [Google Scholar]
- Ramirez‐Valle F, Braunstein S, Zavadil J, Formenti SC, Schneider RJ (2008) eIF4GI links nutrient sensing by mTOR to cell proliferation and inhibition of autophagy. J Cell Biol 181: 293–307 [DOI] [PMC free article] [PubMed] [Google Scholar]
- Ran FA, Hsu PD, Wright J, Agarwala V, Scott DA, Zhang F (2013) Genome engineering using the CRISPR‐Cas9 system. Nat Protoc 8: 2281–2308 [DOI] [PMC free article] [PubMed] [Google Scholar]
- Rappsilber J, Ishihama Y, Mann M (2003) Stop and go extraction tips for matrix‐assisted laser desorption/ionization, nanoelectrospray, and LC/MS sample pretreatment in proteomics. Anal Chem 75: 663–670 [DOI] [PubMed] [Google Scholar]
- Ritchie ME, Phipson B, Wu D, Hu Y, Law CW, Shi W, Smyth GK (2015) limma powers differential expression analyses for RNA‐sequencing and microarray studies. Nucleic Acids Res 43: e47 [DOI] [PMC free article] [PubMed] [Google Scholar]
- Robinson DCL, Dilworth FJ (2018) Epigenetic regulation of adult myogenesis. Curr Top Dev Biol 126: 235–284 [DOI] [PubMed] [Google Scholar]
- Rodriguez CI, Buchholz F, Galloway J, Sequerra R, Kasper J, Ayala R, Stewart AF, Dymecki SM (2000) High‐efficiency deleter mice show that FLPe is an alternative to Cre‐loxP. Nat Genet 25: 139–140 [DOI] [PubMed] [Google Scholar]
- Roussis IM, Myers FA, Scarlett GP (2017) RNA whole‐mount in situ hybridization proximity ligation assay (rISH‐PLA), an assay for detecting RNA‐protein complexes in intact cells. Curr Protoc Cell Biol 74: 17.20.1–17.20.10 [DOI] [PubMed] [Google Scholar]
- Runge JS, Raab JR, Magnuson T (2018) Identification of two distinct classes of the human INO80 complex genome‐wide. G3: Genes ‐ Genomes ‐ Genetics 8: 1095–1102 [DOI] [PMC free article] [PubMed] [Google Scholar]
- Sakakibara I, Santolini M, Ferry A, Hakim V, Maire P (2014) Six homeoproteins and a Iinc‐RNA at the fast MYH locus lock fast myofiber terminal phenotype. PLoS Genet 10: e1004386 [DOI] [PMC free article] [PubMed] [Google Scholar]
- Schuelke M, Wagner KR, Stolz LE, Hubner C, Riebel T, Komen W, Braun T, Tobin JF, Lee SJ (2004) Myostatin mutation associated with gross muscle hypertrophy in a child. N Engl J Med 350: 2682–2688 [DOI] [PubMed] [Google Scholar]
- Schweisgut J, Schutt C, Wust S, Wietelmann A, Ghesquiere B, Carmeliet P, Drose S, Korach KS, Braun T, Boettger T (2017) Sex‐specific, reciprocal regulation of ERalpha and miR‐22 controls muscle lipid metabolism in male mice. EMBO J 36: 1199–1214 [DOI] [PMC free article] [PubMed] [Google Scholar]
- Seale P, Sabourin LA, Girgis‐Gabardo A, Mansouri A, Gruss P, Rudnicki MA (2000) Pax7 is required for the specification of myogenic satellite cells. Cell 102: 777–786 [DOI] [PubMed] [Google Scholar]
- Segales J, Perdiguero E, Munoz‐Canoves P (2016) Regulation of muscle stem cell functions: a focus on the p38 MAPK signaling pathway. Front Cell Dev Biol 4: 91 [DOI] [PMC free article] [PubMed] [Google Scholar]
- Shevchenko A, Tomas H, Havlis J, Olsen JV, Mann M (2006) In‐gel digestion for mass spectrometric characterization of proteins and proteomes. Nat Protoc 1: 2856–2860 [DOI] [PubMed] [Google Scholar]
- Subramanian A, Tamayo P, Mootha VK, Mukherjee S, Ebert BL, Gillette MA, Paulovich A, Pomeroy SL, Golub TR, Lander ES et al (2005) Gene set enrichment analysis: a knowledge‐based approach for interpreting genome‐wide expression profiles. Proc Natl Acad Sci USA 102: 15545–15550 [DOI] [PMC free article] [PubMed] [Google Scholar]
- Tosi A, Haas C, Herzog F, Gilmozzi A, Berninghausen O, Ungewickell C, Gerhold CB, Lakomek K, Aebersold R, Beckmann R et al (2013) Structure and subunit topology of the INO80 chromatin remodeler and its nucleosome complex. Cell 154: 1207–1219 [DOI] [PubMed] [Google Scholar]
- Ulitsky I, Bartel DP (2013) lincRNAs: genomics, evolution, and mechanisms. Cell 154: 26–46 [DOI] [PMC free article] [PubMed] [Google Scholar]
- Vassileva I, Yanakieva I, Peycheva M, Gospodinov A, Anachkova B (2014) The mammalian INO80 chromatin remodeling complex is required for replication stress recovery. Nucleic Acids Res 42: 9074–9086 [DOI] [PMC free article] [PubMed] [Google Scholar]
- Vella P, Barozzi I, Cuomo A, Bonaldi T, Pasini D (2012) Yin Yang 1 extends the Myc‐related transcription factors network in embryonic stem cells. Nucleic Acids Res 40: 3403–3418 [DOI] [PMC free article] [PubMed] [Google Scholar]
- van Velthoven CTJ, de Morree A, Egner IM, Brett JO, Rando TA (2017) Transcriptional profiling of quiescent muscle stem cells in vivo . Cell Rep 21: 1994–2004 [DOI] [PMC free article] [PubMed] [Google Scholar]
- van Velthoven CTJ, Rando TA (2019) Stem cell quiescence: dynamism, restraint, and cellular idling. Cell Stem Cell 24: 213–225 [DOI] [PMC free article] [PubMed] [Google Scholar]
- Wang L, Du Y, Ward JM, Shimbo T, Lackford B, Zheng X, Miao YL, Zhou B, Han L, Fargo DC et al (2014) INO80 facilitates pluripotency gene activation in embryonic stem cell self‐renewal, reprogramming, and blastocyst development. Cell Stem Cell 14: 575–591 [DOI] [PMC free article] [PubMed] [Google Scholar]
- Wang M, Liu C, Su Y, Zhang K, Zhang Y, Chen M, Ge M, Gu L, Lu T, Li N et al (2017) miRNA‐34c inhibits myoblasts proliferation by targeting YY1. Cell Cycle 16: 1661–1672 [DOI] [PMC free article] [PubMed] [Google Scholar]
- Warming S, Costantino N, Court DL, Jenkins NA, Copeland NG (2005) Simple and highly efficient BAC recombineering using galK selection. Nucleic Acids Res 33: e36 [DOI] [PMC free article] [PubMed] [Google Scholar]
- White RB, Bierinx AS, Gnocchi VF, Zammit PS (2010) Dynamics of muscle fibre growth during postnatal mouse development. BMC Dev Biol 10: 21 [DOI] [PMC free article] [PubMed] [Google Scholar]
- Woodhouse S, Pugazhendhi D, Brien P, Pell JM (2013) Ezh2 maintains a key phase of muscle satellite cell expansion but does not regulate terminal differentiation. J Cell Sci 126: 565–579 [DOI] [PubMed] [Google Scholar]
- Wosczyna MN, Rando TA (2018) A muscle stem cell support group: coordinated cellular responses in muscle regeneration. Dev Cell 46: 135–143 [DOI] [PMC free article] [PubMed] [Google Scholar]
- Wu S, Shi Y, Mulligan P, Gay F, Landry J, Liu H, Lu J, Qi HH, Wang W, Nickoloff JA et al (2007) A YY1‐INO80 complex regulates genomic stability through homologous recombination‐based repair. Nat Struct Mol Biol 14: 1165–1172 [DOI] [PMC free article] [PubMed] [Google Scholar]
- Wust S, Drose S, Heidler J, Wittig I, Klockner I, Franko A, Bonke E, Gunther S, Gartner U, Boettger T et al (2018) Metabolic maturation during muscle stem cell differentiation is achieved by miR‐1/133a‐mediated inhibition of the Dlk1‐Dio3 mega gene cluster. Cell Metab 27: 1026–1039.e6 [DOI] [PubMed] [Google Scholar]
- Yakovleva T, Kolesnikova L, Vukojevic V, Gileva I, Tan‐No K, Austen M, Luscher B, Ekstrom TJ, Terenius L, Bakalkin G (2004) YY1 binding to a subset of p53 DNA‐target sites regulates p53‐dependent transcription. Biochem Biophys Res Commun 318: 615–624 [DOI] [PubMed] [Google Scholar]
- Yamaguchi M, Watanabe Y, Ohtani T, Uezumi A, Mikami N, Nakamura M, Sato T, Ikawa M, Hoshino M, Tsuchida K et al (2015) Calcitonin receptor signaling inhibits muscle stem cells from escaping the quiescent state and the niche. Cell Rep 13: 302–314 [DOI] [PubMed] [Google Scholar]
- Zhang T, Gunther S, Looso M, Kunne C, Kruger M, Kim J, Zhou Y, Braun T (2015) Prmt5 is a regulator of muscle stem cell expansion in adult mice. Nat Commun 6: 7140 [DOI] [PMC free article] [PubMed] [Google Scholar]
- Zhou C, Zou J, Zou S, Li X (2016) INO80 is required for osteogenic differentiation of human mesenchymal stem cells. Sci Rep 6: 35924 [DOI] [PMC free article] [PubMed] [Google Scholar]
Associated Data
This section collects any data citations, data availability statements, or supplementary materials included in this article.
Supplementary Materials
Appendix
Expanded View Figure PDF
Review Process File
Data Availability Statement
Microarray data are available at Arrayexpress (E‐MTAB‐8592; https://www.ebi.ac.uk/arrayexpress/experiments/E-MTAB-8592/).