

Abstract
Rationale: Chronic hypersensitivity pneumonitis (CHP) is caused by an immune response to antigen inhalation and is characterized by variable histopathological and clinical features. A subset of subjects with CHP have usual interstitial pneumonia and appear to be clinically similar to subjects with idiopathic pulmonary fibrosis (IPF).
Objectives: To determine the common and unique molecular features of CHP and IPF.
Methods: Transcriptome analysis of lung samples from CHP (n = 82), IPF (n = 103), and unaffected controls (n = 103) was conducted. Differential gene expression was determined adjusting for sex, race, age, and smoking history and using false discovery rate to control for multiple comparisons.
Measurements and Main Results: When compared with controls, we identified 413 upregulated and 317 downregulated genes in CHP and 861 upregulated and 322 downregulated genes in IPF. Concordantly upregulated or downregulated genes in CHP and IPF were related to collagen catabolic processes and epithelial development, whereas genes specific to CHP (differentially expressed in CHP when compared with control and not differentially expressed in IPF) were related to chemokine-mediated signaling and immune responsiveness. Using weighted gene coexpression network analysis, we found that among subjects with CHP, genes involved in adaptive immunity or epithelial cell development were associated with improved or reduced lung function, respectively, and that MUC5B expression was associated with epithelial cell development. MUC5B expression was also associated with lung fibrosis and honeycombing.
Conclusions: Gene expression analysis of CHP and IPF identified signatures common to CHP and IPF, as well as genes uniquely expressed in CHP. Select modules of gene expression are characterized by distinct clinical and pathological features of CHP.
Keywords: hypersensitivity pneumonitis, idiopathic pulmonary fibrosis, gene expression profiling, transcriptome
At a Glance Commentary
Scientific Knowledge on the Subject
Chronic hypersensitivity pneumonitis (CHP) is caused by an immune response to antigen inhalation and is characterized by variable histopathological and clinical features. A subset of subjects with CHP have usual interstitial pneumonia and appear to be clinically similar to subjects with idiopathic pulmonary fibrosis (IPF). However, the molecular relationship between CHP and IPF is not well understood, and little is known about the relationship between gene expression profile and clinical, pathological, and radiological features.
What This Study Adds to the Field
We report the first large transcriptional analysis in CHP and IPF using nonaffected controls and including clinical, pathological, and radiological features of disease. This transcriptional analysis revealed that genes related to collagen catabolism and epithelial development were upregulated in both CHP and IPF, whereas genes related to cytokine or immune response were specifically upregulated to CHP. We also identified that genes involved in adaptive immunity and epithelial development were associated with improved and reduced lung function, respectively, and higher expression of MUC5B mRNA was related to lower %DlCO and presence of fibrosis and honeycombing in patients with CHP.
Hypersensitivity pneumonitis (HP) is a diffuse interstitial lung disease that results from repeated inhalation of and sensitization to various antigens (1) and appears to be driven by cell-mediated immunity. HP is classified clinically as acute, subacute, and chronic. The histopathologic patterns in chronic HP (CHP) include organizing pneumonia, cellular nonspecific interstitial pneumonia (NSIP), fibrotic NSIP, and usual interstitial pneumonia (UIP). Specific histological features of CHP include centrilobular fibrosis, bridging fibrosis, organizing pneumonia, bronchiolitis, granulomas, and giant cells (2). The prognosis of CHP is related to its histopathological patterns. Subjects with CHP with cellular NSIP or granulomatous bronchiolitis appear to have a better transplant-free survival than subjects with UIP, fibrotic NSIP, or bronchiolocentric fibrosis pattern (2, 3). Cases of CHP with UIP-like pattern tend to have the worst prognosis and a course similar to that observed in idiopathic pulmonary fibrosis (IPF) (4). Similarities between IPF and CHP can result in clinically indistinguishable disease. For example, 16% of patients with HP were incidentally found to have HP at transplant (5), and patients clinically diagnosed with IPF are frequently found to have CHP on reevaluation (6). Although antifibrotic agents may provide benefit in some cases of CHP (7, 8), identification and avoidance of the inciting antigen(s) is a critical intervention in CHP (9); therefore, the distinction between IPF and CHP has clinical relevance.
The development of CHP is believed to be dependent on the intensity and duration of exposure to specific antigens and on the susceptibility of the host. One-fifth of individuals who are exposed to bird droppings develop bird fancier’s lung, and up to 40% of fanciers are sensitized to pigeon droppings (10). These results suggest that genetic or immunological triggers interact with specific exposures to cause HP in a susceptible host. In fact, the MUC5B promoter variant rs35705950, the strongest risk factor for the development of IPF (11), has recently been reported to be associated with the risk of CHP. This genetic variant was also associated with moderate to severe high-resolution computed tomography (HRCT) evidence of lung fibrosis in CHP (12).
However, the molecular relationship between CHP and IPF is not well understood. Better understanding of the pathobiology of CHP could more easily distinguish CHP from IPF and might identify those individuals who would benefit from exposure avoidance and immunosuppression. Selman and colleagues investigated gene expression signatures of subjects with IPF and HP and found that subjects with HP had upregulation of genes associated with inflammation, T-cell activation, and immune responses, whereas the IPF signatures were characterized by the expression of tissue remodeling, epithelial, and myofibroblast genes (13). Horimasu and colleagues also investigated gene expression of nine subjects with CHP, and pathways related to inflammatory responses or autoimmune diseases were differentially expressed compared with controls (14). To understand the common and unique molecular features of CHP and IPF, we conducted RNA sequencing using lung tissue from study subjects with CHP, study subjects with IPF, and unaffected controls. We also explored the relationship between distinct transcriptional signatures of CHP and clinical, radiological, and histopathological features of the disease. Some of the results of these studies have been previously reported in the form of an abstract (15) and a preprint (http://dx.doi.org/10.2139/ssrn.3514777).
Methods
Study Design, Participants, and Sample Collection
We conducted a retrospective cohort study that includes participants with CHP enrolled at the University of California, San Francisco (UCSF), National Jewish Health, and the Lung Tissue Research Consortium (LTRC). Baseline clinical information was collected at the time of tissue sampling, and information about treatment with corticosteroid or immunosuppressant (IS) was collected when they had their biopsy or lung transplant. Azathioprine, methotrexate, mycophenolate, tumor necrosis factor antagonist, cyclophosphamide, and azathioprine were listed as IS, and use of corticosteroid is noted separately from IS in this study. The diagnosis of CHP and IPF was made by each institution or consortia according to accepted guidelines or by multidisciplinary consensus using ATS criteria (16, 17). Ninety-four subjects with CHP were enrolled, and 12 subjects were excluded because of low RNA integrity (RIN) scores. One hundred three subjects with IPF and 103 unaffected control subjects were frequency matched by age, sex, and race so that distribution of these covariates is similar across study groups from our lung tissue repository that includes 309 IPF and 247 control samples from LTRC, UCSF, Vanderbilt University, and Pittsburgh University. Subjects were selected from samples with RIN score above 5. “Explanted control” lung samples were provided from healthy subjects who were potential donors but did not match regional criteria for transplant. “Biopsy control” lung samples were provided from histologically normal lesions in resected lung cancer specimens. Antigen exposure questionnaires for each institution are available from the authors, and subject-level clinical data are provided in Table E1 in the online supplement. This study conformed to the Declaration of Helsinki and was approved by the Colorado Multiple Institution Board 15-1147.
Radiological and Histopathological Scoring
Chest computed tomography scans obtained before biopsy or transplant were collected, then reviewed and scored in a blinded fashion by an expert chest radiologist (T.J.B.) using a structured radiology form. The form included scoring for ground-glass opacity, consolidation, reticulation, traction bronchiectasis, honeycombing, subpleural sparing, lymphadenopathy, mosaic perfusion, air-trapping, emphysema, cysts, and nodules, scored as absent (0) or present (1). Predominance of lung involvement was also scored as central/peripheral, upper/middle/lower, and right/left/both-sides.
All available samples were stained with hematoxylin and eosin, then reviewed and scored semiquantitatively in a blinded fashion by an experienced lung pathologist (C.D.C.) using a structured pathology form. The form included scoring for airway-centered chronic inflammation/fibrosis, nonnecrotizing granuloma, multinucleated giant cells, peribronchiolar metaplasia, organizing pneumonia, fibrosis, microscopic honeycombing, fibroblastic foci, interstitial lymphocytic inflammation, and germinal centers, scored as absent (0), rare (1), moderate (2), or marked (3) for each slide. Airway-centered chronic inflammation/fibrosis was defined as peribronchiolar fibrosis with bronchiolar distortion or occlusion by scarring and smooth muscle hyperplasia. Confidence of HP diagnosis by histopathology was defined as definite (>95%), probable (50–94%), and possible (<50%). Pathological features were described as present (1) or absent (0) for association with gene expressions.
RNA Extraction, Quality Assessment, and Expression Profiling
Lung tissue was collected from all participants either as a surgical lung biopsy or at the time of lung transplantation. Lung samples were stored in optimal cutting temperature compound or flash frozen until use. RNA and DNA were isolated from tissues using AllPrep DNA/RNA/miRNA Universal Kit (Qiagen), according to manufacturer’s protocol. Quality was evaluated with Agilent 2100 BioAnalyzer (Agilent Technologies). Samples were excluded if RIN was below 5. mRNA library construction and deep sequencing were performed in the Genomic and Microarray Core at the University of Colorado. mRNA libraries were prepared using the TruSeq Stranded mRNA kit and sequenced on the Illumina NovaSEQ 6000 at a targeted minimum read depth of 80 million paired-end reads per sample. All samples passed the quality check (Phred quality score 35.19 ± 0.33), and the mapping rates were 96.32 ± 5.38%. The data have been deposited in the National Center for Biotechnology Information’s Gene Expression Omnibus and are accessible through Gene Expression Omnibus Series accession number GSE150910 (https://www.ncbi.nlm.nih.gov/geo/query/acc.cgi?acc=GSE150910).
RNA-Sequencing Analysis
RNA reads were mapped to the hg38 transcriptome with GENCODE version 27 annotations using Kallisto (18), and then all human protein-coding transcripts were considered to be evaluated. Normalization and identification of differentially expressed genes were performed using the Bioconductor package DESeq2 (19). We considered genes to be differentially expressed at Benjamini-Hochberg–adjusted P value < 0.05 and the absolute value of log2 fold change > 1 (corresponding to twofold change) (20). Signaling pathway enrichment analysis was performed by an online integrated analysis tool (the Database for Annotation, Visualization and Integrated Discovery; https://david.ncifcrf.gov/) version 6.8 with the Kyoto Encyclopedia of Genes and Genomes (KEGG; http://www.genome.jp/kegg) annotations and Gene Ontology knowledgebase (GO; geneontology.org) (21–23). In the GO analysis, only the biological process (BP) category was considered.
MUC5B rs35705950 Genotyping
We performed MUC5B rs35705950 genotyping using TaqMan genotyping assay (C_1582254_20; Thermo Fisher Scientific), as previously described (24). Real‐time PCR analysis was conducted with Viaa7 real-time PCR system (Applied Biosystems).
Identification of Coexpressed Gene Modules and Clinical Traits
Genes differentially expressed in CHP compared with unaffected controls were clustered and gene modules were identified using the R package for weighted gene coexpression network analysis (WGCNA) (25). A dendrogram cluster was obtained by a hierarchical clustering algorithm using average method, and then an eigengene was calculated for each cluster using principal component analysis. The appropriate power value was determined when the independence degree was up to 0.8. Pearson’s correlation was used to determine the significance of correlation (P < 0.05) between eigengenes of individual gene modules with clinical traits, radiological/pathological features, and MUC5B genotype. P values for 37 clinical, radiological, or pathological features were adjusted using the Benjamini-Hochberg method.
Statistical Analysis
The clinical data were expressed as the mean ± SD. Categorical data with clinical and histopathologic variables were evaluated using the chi-square or Fisher’s exact test, and continuous clinical variables were analyzed by the nonparametric test. P values of less than 0.05 were assumed to indicate statistically significant differences. Normalized RNA expression was evaluated with continuous clinical features by Pearson’s correlation. The statistical analyses and visualization were performed using the R package (26) and JMP Pro 14.1.0 (SAS Institute Inc.).
Results
Clinical Features of Subjects with CHP, Subjects with IPF, and Unaffected Controls
Table 1 presents the clinical characteristics of our study participants diagnosed with CHP (n = 82) or IPF (n = 103) or unaffected controls (n = 103). There were no significant differences in age, sex, race, and smoking history between our three study groups. The majority of participants were non-Hispanic white and approximately 60 years of age. The minor allele frequency of the MUC5B promoter variant rs35705950 was increased in both CHP and IPF compared with controls (P < 0.001) and was comparable between subjects with IPF and those with CHP.
Table 1.
Clinical Characteristics of All Participants
| Characteristic | CHP (n = 82) | IPF (n = 103) | Control (n = 103) | P Value |
|---|---|---|---|---|
| Age, yr | 59.4 ± 10.6 | 60.3 ± 8.3 | 59.9 ± 10.2 | 0.98 |
| Sex | n = 81 | n = 103 | n = 103 | 0.23 |
| M | 38 (47) | 57 (55) | 45 (44) | |
| F | 43 (53) | 46 (45) | 58 (56) | |
| Race | n = 75 | n = 101 | n = 103 | |
| Non-Hispanic white | 59 (79) | 85 (84) | 87 (84) | 0.055 |
| Hispanic | 10 (13) | 7 (7) | 4 (4) | — |
| Asian | 4 (5) | 2 (2) | 3 (3) | — |
| Black | 1 (1) | 4 (4) | 9 (9) | — |
| Other | 1 (1) | 3 (3) | 0 (0) | — |
| Smoke | n = 73 | n = 95 | n = 96 | 0.9 |
| Ever | 33 (45) | 40 (42) | 43 (45) | |
| Never | 40 (55) | 55 (58) | 53 (55) | |
| Sampling method | 0.51 | |||
| Surgical lung biopsy | 26 (32) | 36 (35) | 41 (40) | |
| Transplant | 56 (68) | 67 (65) | 62 (60) | |
| MUC5B genotype | <0.001 | |||
| GG | 52 (63) | 54 (52) | 80 (78) | |
| GT | 29 (35) | 43 (42) | 21 (20) | |
| TT | 1 (2) | 6 (6) | 2 (2) | |
| Minor allele frequency | 0.19 | 0.27 | 0.12 | — |
Definition of abbreviations: CHP = chronic hypersensitivity pneumonitis; IPF = idiopathic pulmonary fibrosis.
Continuous variables are shown as mean ± SD, and categorical variables are shown as n (%). P values are provided among three groups.
Clinical characteristics of subjects with CHP, subjects with IPF, and control subjects are provided in Tables 2–4. Although there was no significant difference in minor allele frequency of MUC5B in sampling methods, the percentage of non-Hispanic white and exposure to feather antigens were lower and unidentified antigen exposure was higher in subjects with CHP who had received transplantation (Table 2). %FVC was lower in subjects who had received transplantation than in control subjects, whereas there was no significant difference in other pulmonary function, minor allele frequency of MUC5B, and antigen exposure among subjects with IPF and control subjects (Tables 3 and 4). In addition, institutions were significantly different between biopsy and subjects who had received transplantation among all groups, as approximately one-half of samples from LTRC were obtained by biopsies, whereas 94% of samples from UCSF were obtained at the time of lung transplant. Lower pulmonary function and more frequent use of corticosteroids and/or immunosuppressants were also observed in subjects with CHP who had received transplantation.
Table 2.
Clinical Characteristics of Subjects with Chronic Hypersensitivity Pneumonitis
| Characteristic | Biopsy (n = 26) | Transplant (n = 56) | Total | P Value |
|---|---|---|---|---|
| Age, yr | 61.9 ± 9.7 | 58.2 ± 10.8 | 59.4 ± 10.6 | 0.15 |
| Sex | n = 26 | n = 55 | n = 81 | 0.57 |
| M | 11 (42) | 27 (48) | 38 (47) | |
| F | 15 (58) | 28 (52) | 43 (53) | |
| Smoke | n = 26 | n = 47 | n = 73 | |
| Ever | 17 (65) | 23 (49) | 40 (55) | 0.18 |
| Never | 9 (35) | 24 (51) | 33 (45) | — |
| Institution | <0.001 | |||
| LTRC | 24 (92) | 14 (25) | 38 (46) | |
| UCSF | 2 (8) | 34 (61) | 36 (44) | |
| NJH | 0 (0) | 8 (14) | 8 (10) | |
| MUC5B genotype | 0.32 | |||
| GG | 16 (62) | 36 (64) | 52 (63) | |
| GT | 9 (35) | 20 (36) | 29 (35) | |
| TT | 1 (4) | 0 (0) | 1 (1) | |
| Minor allele frequency | 0.217 | 0.179 | 0.189 | — |
| Antigen exposure | n = 26 | n = 48 | n = 74 | |
| Bird | 8 (31) | 16 (34) | 24 (33) | 1 |
| Feather | 13 (50) | 11 (23) | 24 (33) | 0.036 |
| Mold | 12 (46) | 15 (32) | 27 (36) | 0.32 |
| Multiple antigens | 11 (42) | 9 (16) | 20 (27) | <0.001 |
| Unknown | 7 (27) | 34 (61) | 41 (55) | 0.053 |
| Medication | n = 26 | n = 48 | n = 74 | |
| Corticosteroid | 7 (27) | 27 (56) | 34 (46) | 0.027 |
| IS | 1 (4) | 12 (25) | 13 (18) | 0.025 |
| Pulmonary function tests | n = 26 | n = 43 | n = 69 | |
| %FEV1 | 84.5 ± 24.0 | 46.6 ± 21.0 | 70.0 ± 28.9 | <0.001 |
| %FVC | 80.1 ± 21.2 | 41.3 ± 17.6 | 56.2 ± 26.8 | <0.001 |
| %DlCO | 59.3 ± 21.5 | 25.0 ± 9.1 | 40.8 ± 23.5 | <0.001 |
Definition of abbreviations: IS = immunosuppressant; LTRC = Lung Tissue Research Consortium; NJH = National Jewish Health; UCSF = University of California, San Francisco.
Continuous variables are shown as mean ± SD, and categorical variables are shown as n (%).
Table 4.
Clinical Characteristics of Control Subjects
| Characteristic | Biopsy (n = 40) | Transplant (n = 63) | Total | P Value |
|---|---|---|---|---|
| Age, yr | 62.5 ± 7.4 | 58.2 ± 11.3 | 59.9 ± 10.2 | 0.053 |
| Sex | 0.1 | |||
| M | 13 (33) | 32 (51) | 45 (44) | |
| F | 27 (67) | 31 (49) | 58 (56) | |
| Smoke | n = 37 | n = 59 | n = 96 | 0.29 |
| Ever | 18 (49) | 35 (59) | 53 (55) | |
| Never | 19 (51) | 24 (41) | 43 (45) | |
| Institution | <0.001 | |||
| LTRC | 40 (100) | 17 (27) | 57 (55) | |
| UCSF | 0 (0) | 9 (14) | 9 (9) | |
| PT | 0 (0) | 37 (59) | 37 (36) | |
| MUC5B genotype | 0.81 | |||
| GG | 32 (80) | 48 (76) | 80 (78) | |
| GT | 7 (18) | 14 (22) | 21 (20) | |
| TT | 1 (2) | 1 (2) | 2 (2) | |
| Minor allele frequency | 0.113 | 0.127 | 0.117 | — |
| Antigen exposure | n = 35 | n = 11 | n = 46 | |
| Bird | 9 (26) | 3 (27) | 12 (26) | 0.61 |
| Feather | 21 (60) | 8 (73) | 29 (63) | 0.92 |
| Mold | 9 (26) | 2 (18) | 11 (24) | 0.68 |
| Multiple antigens | 11 (31) | 3 (27) | 14 (30) | 0.79 |
| Unknown | 10 (29) | 1 (9) | 11 (24) | 0.19 |
| Medication | n = 39 | n = 15 | n = 54 | |
| Corticosteroid | 3 (8) | 1 (7) | 4 (7) | 0.9 |
| IS | 0 (0) | 0 (0) | 0 (0) | — |
| Pulmonary function tests | n = 39 | n = 16 | n = 54 | |
| %FEV1 | 100.7 ± 16.1 | 90.5 ± 7.0 | 96.9 ± 15.2 | 0.092 |
| %FVC | 99.8 ± 16.6 | 89.9 ± 7.5 | 72.0 ± 16.7 | 0.017 |
| %DlCO | 74.5 ± 18.0 | 66.5 ± 12.0 | 97.7 ± 14.3 | 0.083 |
Definition of abbreviations: IS = immunosuppressant; LTRC = Lung Tissue Research Consortium; PT = Pittsburgh University; UCSF = University of California, San Francisco.
Continuous variables are shown as mean ± SD, and categorical variables are shown as n (%).
Table 3.
Clinical Characteristics of Subjects with Idiopathic Pulmonary Fibrosis
| Characteristic | Biopsy (n = 36) | Transplant (n = 67) | Total | P Value |
|---|---|---|---|---|
| Age, yr | 60.9 ± 8.4 | 60.0 ± 8.2 | 60.3 ± 8.3 | 0.56 |
| Sex | 0.39 | |||
| M | 22 (61) | 35 (52) | 57 (55) | |
| F | 14 (39) | 32 (48) | 46 (45) | |
| Smoke | n = 33 | n = 62 | n = 95 | 0.18 |
| Ever | 23 (70) | 32 (52) | 55 (58) | |
| Never | 10 (30) | 30 (48) | 40 (42) | |
| Institution | <0.001 | |||
| LTRC | 35 (97) | 19 (28) | 54 (52) | |
| UCSF | 1 (3) | 32 (48) | 33 (32) | |
| PT | 0 (0) | 14 (21) | 14 (14) | |
| VU | 0 (0) | 2 (3) | 2 (2) | |
| MUC5B genotype | 0.21 | |||
| GG | 16 (44) | 38 (57) | 54 (52) | |
| GT | 19 (53) | 24 (36) | 43 (42) | |
| TT | 1 (3) | 5 (7) | 6 (6) | |
| Minor allele frequency | 0.292 | 0.253 | 0.267 | — |
| Antigen exposure | n = 31 | n = 9 | n = 40 | |
| Bird | 11 (35) | 3 (34) | 14 (35) | 0.91 |
| Feather | 13 (42) | 5 (56) | 18 (45) | 0.47 |
| Mold | 5 (16) | 2 (25) | 7 (18) | 0.67 |
| Multiple antigens | 7 (23) | 3 (34) | 10 (25) | 0.51 |
| Unknown | 11 (35) | 3 (34) | 14 (35) | 0.9 |
| Medication | n = 33 | n = 9 | n = 42 | |
| Corticosteroid | 17 (52) | 6 (67) | 23 (55) | 0.41 |
| IS | 7 (21) | 3 (33) | 10 (24) | 0.45 |
| Pulmonary function tests | n = 31 | n = 10 | n = 41 | |
| %FEV1 | 64.8 ± 25.5 | 59.2 ± 15.6 | 63.4 ± 23.4 | 0.69 |
| %FVC | 61.9 ± 24.3 | 56 ± 16.9 | 60.5 ± 22.6 | 0.72 |
| %DlCO | 33 ± 19.5 | 26 ± 10.2 | 31.2 ± 17.8 | 0.63 |
Definition of abbreviations: IS = immunosuppressant; LTRC = Lung Tissue Research Consortium; PT = Pittsburgh University; UCSF = University of California, San Francisco; VU = Vanderbilt University.
Continuous variables are shown as mean ± SD, and categorical variables are shown as n (%).
Differentially Expressed Genes in CHP and IPF
Technical variation including batch effects and covariates described above was assessed by principal component regression analysis (Figure E1). As gene expression was strongly affected by the sampling method, we evaluated our population as two separate cohorts, distinguished by surgical lung biopsy and transplantation, and then genes upregulated or downregulated in both biopsy and transplanted cohorts were regarded as important genes. To identify differences in protein-coding gene expression profiles, we compared the transcriptional signatures between CHP and controls, and between IPF and controls, adjusting for sex, race, age, plate, institution, and smoking history using DESeq2. In surgical lung biopsy specimens, we identified 907 upregulated and 1,077 downregulated genes as differentially expressed between subjects with CHP and control subjects, whereas 1,077 upregulated and 480 downregulated genes were differentially expressed between subjects with IPF and control subjects at a false discovery rate–adjusted P value < 0.05 and absolute log2 fold change > 1 (Figures 1A and 1B). In lung transplant specimens, 1,114 upregulated and 796 downregulated genes were identified as differentially expressed between subjects with CHP and control subjects, and 1,375 upregulated and 589 downregulated genes were differentially expressed between subjects with IPF and control subjects (Figures 1C and 1D).
Figure 1.

Protein-coding gene expression profiles in chronic hypersensitivity pneumonitis (CHP) and idiopathic pulmonary fibrosis (IPF). Volcano plot of differentially expressed genes in CHP versus controls and IPF versus controls from biopsy or transplanted samples are shown in A–D. Genes with adjusted P value < 0.05 and absolute log2 fold change > 1 are shown as red spots. Genes having absolute log2 fold change < 1 are shown as black, whereas absolute log2 fold change > 1 but adjusted P value > 0.05 are shown in blue. Venn diagrams for (E) upregulated and (F) downregulated genes are shown. Genes upregulated or downregulated in both biopsy and subjects who had received transplantation were regarded as important. Four hundred thirteen and 317 genes were upregulated or downregulated in both biopsy and subjects with CHP who had received transplantation, whereas 861 and 322 genes were upregulated or downregulated in both biopsy and subjects with IPF who had received transplantation, respectively. Three hundred four and 167 genes were upregulated or downregulated commonly in CHP and IPF. (G) Scatter plot analysis for all protein-coding genes. Genes with adjusted P value < 0.05 and absolute log2 fold change > 1 in both CHP and IPF are shown as black spots. All genes were evaluated with log2 fold changes for CHP versus controls (x-axis) or IPF versus controls (y-axis) from (G) biopsy samples and (H) transplanted samples and showed positive relationship between IPF and CHP (Pearson correlation coefficient = 0.72, P < 0.001, and Pearson correlation coefficient = 0.62, P < 0.001, respectively).
Combining the surgical lung biopsy and lung transplant results, 413 genes were commonly upregulated (Figure 1E) and 317 genes were downregulated in CHP versus controls, whereas 861 genes were upregulated and 322 genes were downregulated in IPF versus controls (Figure 1F). There was a strong correlation in log2 fold change of gene expression between IPF and CHP in both biopsy (Pearson correlation coefficient = 0.72, P < 0.001, Figure 1G) and transplant specimens (Pearson correlation coefficient = 0.62, P < 0.001, Figure 1H). Among the commonly differentially expressed genes in both biopsy and transplant cohorts, we identified 304 upregulated genes, including SPRR1A, CXCL13, and S100A2, whereas 167 genes, including ITNL2 and BTNL9, were downregulated in both CHP and IPF (Table 5). We also identified 109 upregulated genes that were differentially expressed in CHP and not differentially expressed in IPF (“specific to CHP”), including BGN, CXCL9, and CHIT1, and 150 genes, including ANO3, GPD1, and FMO2, were downregulated (Table 6). All upregulated or downregulated genes specific to CHP or observed in both CHP and IPF are provided in Table E2. Gene expression differences among antigen identification, corticosteroid treatment, and immunosuppressant treatment were also compared in subjects with CHP adjusting with sex, race, age, and sampling method. We identified one upregulated gene (AC136428) and two downregulated genes (CD2, NPIPA8) when we compared subjects with and without immunosuppressant treatment, and no significant gene expression difference was identified when we evaluated the effect of corticosteroid treatment or antigen identification.
Table 5.
Commonly Differentially Expressed Genes in Both CHP and IPF
| Gene Name | Base Mean | log2 Fold Change | P Value | Adjusted P Value |
|---|---|---|---|---|
| SPRR1A | 212.75 | 7.63 | 3.81 × 10⁻²⁷ | 4.22 × 10⁻²⁴ |
| AC009086.2 | 10.57 | 6.65 | 6.55 × 10⁻⁴ | 2.17 × 10⁻³ |
| PRSS2 | 232.53 | 5.36 | 1.28 × 10⁻²² | 4.97 × 10⁻²⁰ |
| KLK6 | 9.05 | 4.95 | 3.40 × 10⁻¹⁹ | 5.77 × 10⁻¹⁷ |
| LGALS7B | 1,070.95 | 4.87 | 4.24 × 10⁻²⁴ | 2.17 × 10⁻²¹ |
| COL17A1 | 266.77 | 4.75 | 1.63 × 10−41 | 2.70 × 10−37 |
| FDCSP | 600.65 | 4.74 | 1.80 × 10⁻¹⁷ | 1.96 × 10⁻¹⁵ |
| S100A2 | 10,007.22 | 4.66 | 4.14 × 10−39 | 2.29 × 10⁻³⁵ |
| KRT14 | 51.91 | 4.28 | 5.76 × 10⁻¹⁷ | 5.71 × 10⁻¹⁵ |
| IGFL2 | 307.46 | 4.24 | 2.24 × 10⁻³³ | 6.20 × 10⁻³⁰ |
| CXCL13 | 1,041 | 3.98 | 9.75 × 10⁻¹⁹ | 1.51 × 10⁻¹⁶ |
| CALML3 | 10.8 | 3.92 | 9.98 × 10⁻¹² | 2.50 × 10⁻¹⁴ |
| COMP | 559.6 | 3.87 | 8.54 × 10⁻²⁹ | 1.09 × 10⁻²⁵ |
| GREM1 | 222.34 | 3.86 | 4.46 × 10⁻¹⁷ | 4.52 × 10⁻¹⁵ |
| KRTAP2-3 | 8.83 | 3.86 | 2.52 × 10⁻⁷ | 2.10 × 10⁻⁶ |
| GPR87 | 261.82 | 3.72 | 1.20 × 10⁻¹⁷ | 1.38 × 10⁻¹⁵ |
| LGALS7 | 389.94 | 3.47 | 8.54 × 10⁻¹⁴ | 1.33 × 10⁻⁸ |
| DSC3 | 57.1 | 3.44 | 5.47 × 10⁻⁸ | 5.44 × 10⁻⁷ |
| FAM83A | 127.66 | 3.44 | 9.97 × 10⁻²⁷ | 8.73 × 10⁻²⁴ |
| TMPRSS4 | 871.29 | 3.34 | 7.19 × 10⁻²¹ | 1.78 × 10⁻¹⁸ |
| CHRM2 | 27.51 | −2.37 | 5.92 × 10⁻¹¹ | 1.22 × 10⁻⁹ |
| CA2 | 141.79 | −2.39 | 8.47 × 10⁻¹² | 2.15 × 10⁻¹⁴ |
| SLC6A4 | 1,562.49 | −2.43 | 9.98 × 10⁻⁷ | 7.19 × 10⁻⁶ |
| BTNL8 | 117.4 | −2.43 | 3.03 × 10⁻²⁴ | 1.73 × 10⁻²¹ |
| AL096711.2 | 64.67 | −2.44 | 8.99 × 10⁻²⁴ | 4.27 × 10⁻²¹ |
| KLRG2 | 49.16 | −2.49 | 2.37 × 10⁻²² | 8.78 × 10⁻²⁰ |
| SLC14A1 | 161.79 | −2.51 | 6.31 × 10⁻¹² | 1.66 × 10⁻¹⁴ |
| MME | 847.08 | −2.51 | 4.02 × 10⁻²⁴ | 2.16 × 10⁻²¹ |
| ERICH4 | 29.72 | −2.53 | 9.25 × 10⁻²³ | 3.66 × 10⁻²⁰ |
| C8B | 61.34 | −2.53 | 3.76 × 10⁻⁸ | 3.90 × 10⁻⁷ |
| GRM8 | 15.09 | −2.57 | 1.49 × 10⁻¹² | 4.51 × 10⁻¹¹ |
| ADCY8 | 12.86 | −2.67 | 9.26 × 10⁻¹³ | 2.95 × 10⁻¹¹ |
| NKD1 | 56.01 | −2.72 | 5.22 × 10⁻¹⁵ | 2.96 × 10⁻¹³ |
| FAM167A | 32.04 | −2.81 | 2.13 × 10⁻¹⁴ | 1.01 × 10⁻¹² |
| SLCO1A2 | 30.14 | −2.92 | 3.32 × 10⁻¹³ | 1.19 × 10⁻¹¹ |
| BTNL9 | 1,746.64 | −2.96 | 2.70 × 10⁻²⁹ | 4.99 × 10⁻²⁶ |
| ADRA1A | 99.65 | −3.35 | 4.05 × 10−38 | 1.43 × 10⁻³⁴ |
| LAMP3 | 110.46 | −3.42 | 3.72 × 10⁻⁸ | 3.87 × 10⁻⁷ |
| ITLN2 | 511.01 | −3.77 | 6.78 × 10⁻¹⁶ | 4.80 × 10⁻¹⁴ |
| FAM71A | 6.87 | −3.84 | 1.46 × 10⁻⁶ | 1.00 × 10⁻⁵ |
Definition of abbreviations: CHP = chronic hypersensitivity pneumonitis; IPF = idiopathic pulmonary fibrosis.
Top 20 up- and downregulated genes in CHP. The table shows differentially expressed genes overlapped in IPF and CHP. The table was sorted by log2 fold change in CHP with transplanted samples.
Table 6.
CHP-Specific Differentially Expressed Genes
| Gene Name | Base Mean | log2 Fold Change | P Value | Adjusted P Value |
|---|---|---|---|---|
| BGN | 1,607.81 | 3.43 | 3.35 × 10⁻²⁴ | 1.86 × 10⁻²¹ |
| MYBL2 | 3.46 | 3.23 | 4.86 × 10⁻³ | 1.22 × 10⁻² |
| CHIT1 | 5,195.27 | 3.09 | 2.54 × 10⁻¹¹ | 5.81 × 10⁻¹⁴ |
| PAX5 | 6.39 | 2.94 | 1.80 × 10⁻⁷ | 1.55 × 10⁻⁶ |
| TIMP1 | 21,378.87 | 2.75 | 7.77 × 10⁻²¹ | 1.85 × 10⁻¹⁸ |
| PCP4 | 8.97 | 2.68 | 6.13 × 10⁻⁴ | 2.05 × 10⁻³ |
| TIMD4 | 15.4 | 2.6 | 1.12 × 10⁻⁴ | 4.66 × 10⁻⁴ |
| TOP2A | 70.63 | 2.13 | 6.69 × 10⁻⁷ | 5.04 × 10⁻⁶ |
| BFSP2 | 32.09 | 2.11 | 3.85 × 10⁻¹⁴ | 6.51 × 10⁻⁹ |
| MYBPC2 | 17.7 | 2.07 | 3.24 × 10⁻⁵ | 1.55 × 10⁻⁴ |
| C4B | 6,629.57 | 2.06 | 2.89 × 10⁻²⁶ | 2.29 × 10⁻²³ |
| CCL25 | 10.43 | 2.04 | 2.77 × 10⁻⁵ | 1.35 × 10⁻⁴ |
| TSPAN8 | 368.71 | 2.02 | 7.86 × 10⁻¹⁴ | 3.27 × 10⁻¹² |
| MYL2 | 5.98 | 1.98 | 4.77 × 10⁻⁵ | 2.19 × 10⁻⁴ |
| CCL13 | 51.06 | 1.88 | 7.20 × 10⁻⁴ | 2.35 × 10⁻³ |
| TNFRSF17 | 11.6 | 1.82 | 3.20 × 10⁻³ | 8.48 × 10⁻³ |
| PLTP | 2,135.31 | 1.79 | 9.12 × 10⁻¹⁴ | 3.75 × 10⁻¹² |
| CCL19 | 16.93 | 1.78 | 4.20 × 10⁻³ | 1.07 × 10⁻² |
| SYN1 | 94.42 | 1.76 | 1.89 × 10⁻¹¹ | 4.48 × 10⁻¹⁴ |
| ARMC1 | 29.4 | 1.76 | 1.44 × 10⁻⁶ | 9.91 × 10⁻⁶ |
| FOS | 7,972.61 | −1.67 | 7.24 × 10⁻⁷ | 5.39 × 10⁻⁶ |
| ARGLU1 | 1,180.58 | −1.69 | 2.77 × 10⁻¹⁷ | 2.89 × 10⁻¹⁵ |
| STC1 | 3.36 | −1.72 | 2.17 × 10⁻² | 4.40 × 10⁻² |
| INMT-MINDY4 | 66.96 | −1.72 | 2.42 × 10⁻¹³ | 8.99 × 10⁻¹² |
| HBEGF | 75.02 | −1.73 | 1.62 × 10⁻⁹ | 2.36 × 10⁻⁸ |
| ADAMTS7 | 98.77 | −1.77 | 1.76 × 10⁻¹⁹ | 3.15 × 10⁻¹⁷ |
| AC142391.1 | 16.24 | −1.8 | 6.53 × 10⁻⁴ | 2.17 × 10⁻³ |
| SULT1E1 | 12.09 | −1.82 | 2.36 × 10⁻³ | 6.52 × 10⁻³ |
| PLEKHH2 | 319.79 | −1.83 | 3.23 × 10⁻¹⁶ | 2.51 × 10⁻¹⁴ |
| OLAH | 63.02 | −1.84 | 9.90 × 10⁻⁹ | 1.19 × 10⁻⁷ |
| CDC42EP2 | 7.92 | −1.84 | 1.83 × 10⁻² | 3.81 × 10⁻² |
| OLR1 | 745.23 | −1.9 | 1.23 × 10⁻⁹ | 1.85 × 10⁻⁸ |
| MGAT3 | 61.56 | −1.9 | 6.71 × 10⁻¹² | 1.76 × 10⁻¹⁴ |
| CDH13 | 295.38 | −2 | 1.59 × 10⁻²⁰ | 3.57 × 10⁻¹⁸ |
| FMO2 | 478.74 | −2.07 | 9.03 × 10⁻¹³ | 2.90 × 10⁻¹¹ |
| GPD1 | 181.69 | −2.1 | 2.62 × 10⁻¹⁴ | 4.64 × 10⁻⁹ |
| KLF15 | 32.39 | −2.11 | 4.30 × 10⁻⁶ | 2.61 × 10⁻⁵ |
| DYTN | 2.66 | −2.36 | 5.68 × 10⁻⁴ | 1.92 × 10⁻³ |
| ADRA1B | 9.4 | −2.4 | 1.93 × 10⁻⁴ | 7.49 × 10⁻⁴ |
| ANO3 | 6.85 | −2.85 | 5.53 × 10⁻¹² | 1.48 × 10⁻¹⁴ |
Definition of abbreviation: CHP = chronic hypersensitivity pneumonitis.
Top 20 up- and downregulated genes in CHP. The table shows genes differentially expressed in CHP but not significant in idiopathic pulmonary fibrosis. The table was sorted by log2 fold change in CHP with transplanted samples.
We next performed enrichment analysis among CHP-related genes with GO and KEGG pathways. Upregulated genes common to both CHP and IPF were mapped to 30 GO BPs including collagen catabolic process, collagen fibril organization, and cell adhesion, whereas downregulated genes common to both CHP and IPF included calcium ion transmembrane transport and angiogenesis. Upregulated genes specific to CHP were mapped to 20 BP terms and included chemokine-mediated signaling pathway and immune responsiveness, and CHP unique downregulated genes included steroid metabolic processes and positive regulation of angiogenesis (Figure 2A). In KEGG pathways, upregulated genes common to both CHP and IPF were enriched in 11 pathways including protein digestion and absorption and extracellular matrix–receptor interaction, and downregulated pathways including neuroactive ligand–receptor interaction and calcium signaling pathway. CHP-specific upregulated genes were mapped to cytokine–cytokine receptor interaction and chemokine signaling pathway, and two downregulated pathways related to steroid hormone biosynthesis and PI3K–Akt signaling pathway (Figure 2B). All pathways enriched in CHP-specific genes or commonly expressed in CHP and IPF genes with P < 0.05 are included in Table E3.
Figure 2.

Bubble plots displaying the most significant (A) Gene Ontology knowledgebase terms and (B) Kyoto Encyclopedia of Genes and Genomes pathways enriched to chronic hypersensitivity pneumonitis (CHP)-related genes. Bubble colors represent upregulated (red) and downregulated (blue) gene set, and sizes indicate the number of genes. UP overlapped: upregulated genes commonly expressed in idiopathic pulmonary fibrosis (IPF) and CHP; DOWN overlapped: downregulated genes commonly expressed in IPF and CHP; UP specific: upregulated genes in CHP but not in IPF; DOWN specific: downregulated genes in CHP but not in IPF.
Clinical, Pathological, and Radiological Features and Coexpression Network Analysis
Of 82 subjects with CHP, 71 lung samples (38 from LTRC and 33 from UCSF) were available for histopathological scoring, and 70 HRCT scans (38 from LTRC and 32 from UCSF) were available for radiological scoring. Table 7 summarizes the histopathological features of lung samples, and representative histopathological features are shown in Figure E2. Numbers in each sampling methods were provided as absent (0), rare (1), moderate (2), or marked (3), and total subjects (N = 71) were described as present/absent with percentage. Fibrosis and lymphocyte inflammation were present in more than 80% of subjects with CHP, and giant cells, granuloma, or fibroblastic foci were found in approximately 50%. Honeycombing (48%), organizing pneumonia (28%), or germinal center (21%) were observed in some subjects with CHP. Table 8 summarizes radiological findings in HRCT. Ground-glass opacity, irregular reticulation, and traction bronchiectasis were found in more than 80% of subjects with CHP, whereas honeycombing (30%), mosaic attenuation (57%), and lymphadenopathy (54%) were less frequently observed.
Table 7.
Pathological Features of Subjects with Chronic Hypersensitivity Pneumonitis
| Biopsy (n = 26) | Transplant (n = 45) | Total (N = 71) | P Value | |
|---|---|---|---|---|
| Site | 0.14 | |||
| Right upper lobe | 4 | 19 | 23 | |
| Right lower lobe | 12 | 14 | 26 | |
| Left upper lobe | 3 | 7 | 10 | |
| Left lower lobe | 7 | 8 | 15 | |
| Pathological findings* | ||||
| Airway-centered inflammation | 5/14/6/1 | 24/8/11/2 | 42/29 (59%) | 0.008 |
| Granuloma | 12/8/4/2 | 29/7/6/3 | 30/41 (42%) | 0.42 |
| Giant cells | 12/10/4/0 | 23/17/7/3 | 36/35 (51%) | 0.32 |
| Peribronchiolar metaplasia | 11/6/5/4 | 18/11/13/3 | 42/29 (59%) | 0.59 |
| Organizing pneumonia | 15/8/3/0 | 36/7/2/0 | 20/51 (28%) | 0.13 |
| Fibrosis | 11/6/9/0 | 1/4/23/17 | 59/12 (83%) | <0.001 |
| Honeycombing | 20/4/2/0 | 17/12/6/8 | 34/37 (48%) | 0.02 |
| Fibroblastic foci | 13/6/7/0 | 14/15/14/2 | 44/27 (63%) | 0.34 |
| Lymphocytic inflammation | 6/11/8/1 | 1/21/21/2 | 64/7 (84%) | 0.039 |
| Germinal center | 21/4/1/0 | 35/7/3/0 | 15/56 (21%) | 0.88 |
| Diagnosis | 16 (62%) | 26 (51%) | 42/29 (59%) | 0.42 |
The table shows sampling site and pathological features for each sampling methods and total cases. Numbers are presented as absent/rare/moderate/severe in biopsy and transplant cohorts, and present/absent in total cases in pathological features. Percentages are provided with positive cases/total subjects (N = 71).
Absent: 0, rare: 1, moderate: 2, severe: 3, and present/absent.
Table 8.
High-Resolution Computed Tomography Findings of Subjects with Chronic Hypersensitivity Pneumonitis
| Biopsy (n = 26) | Transplant (n = 44) | Total (N = 70) | P Value | |
|---|---|---|---|---|
| Predominance | ||||
| Central/peripheral/diffuse | 10/14/9 | 1/34/8 | 11/48/17 | 0.1 |
| Upper/middle/lower/diffuse | 3/0/10/13 | 6/0/17/21 | 9/0/27/34 | 0.96 |
| Left/right/both | 0/0/26 | 2/0/42 | 2/0/68 | 0.27 |
| Findings, n (%) | ||||
| Ground-glass opacity | 22 (85) | 38 (86) | 60 (86) | 0.84 |
| Consolidation | 4 (15) | 5 (11) | 9 (13) | 0.63 |
| Irregular reticulation | 20 (77) | 43 (98) | 63 (90) | 0.005 |
| Traction bronchiectasis | 18 (69) | 43 (98) | 61 (87) | <0.001 |
| Honeycombing | 2 (8) | 19 (43) | 21 (30) | 0.002 |
| Subpleural sparing | 1 (4) | 2 (5) | 3 (4) | 0.89 |
| Lymphadenopathy | 12 (46) | 26 (59) | 38 (54) | 0.33 |
| Mosaic perfusion | 15 (58) | 25 (57) | 40 (57) | 0.94 |
| Air trapping | 18 (69) | 7 (21) | 35 (50) | 0.025 |
| Emphysema | 3 (12) | 8 (18) | 11 (16) | 0.55 |
| Cysts | 2 (8) | 5 (11) | 7 (10) | 0.25 |
| Nodules | 5 (19) | 8 (18) | 13 (19) | 0.91 |
The table shows radiological features including predominance lesion of disease. Numbers in findings were provided as positive cases.
The 413 genes upregulated in both transplanted and biopsy CHP were clustered into seven gene coexpression modules using WGCNA. Network topology analysis was performed to determine candidate power values for relative, balanced scale independence and mean connectivity in the WGCNA (Figure 3A). The eigengene values of each module were computed by principal component analysis, and then correlations and enrichment analysis were performed with clinical, pathological, and radiological traits (Figure 3B). Among the modules, the yellow module showed that genes involved in adaptive immune response and B-cell receptor signaling pathway positively correlated with %FEV (r = 0.42, P = 0.02). The turquoise module demonstrated an inverse relationship between expression of genes involved in epithelial development and salivary secretion and %DlCO (r = −0.44, P = 0.01) (Figure 3C). MUC5B expression showed a strong correlation with the turquoise module (r = 0.74, P = 1 × 10⁻¹⁰). The red module was correlated with radiographic evidence of consolidation (r = 0.5, P = 0.001) and was enriched in protein digestion.
Figure 3.

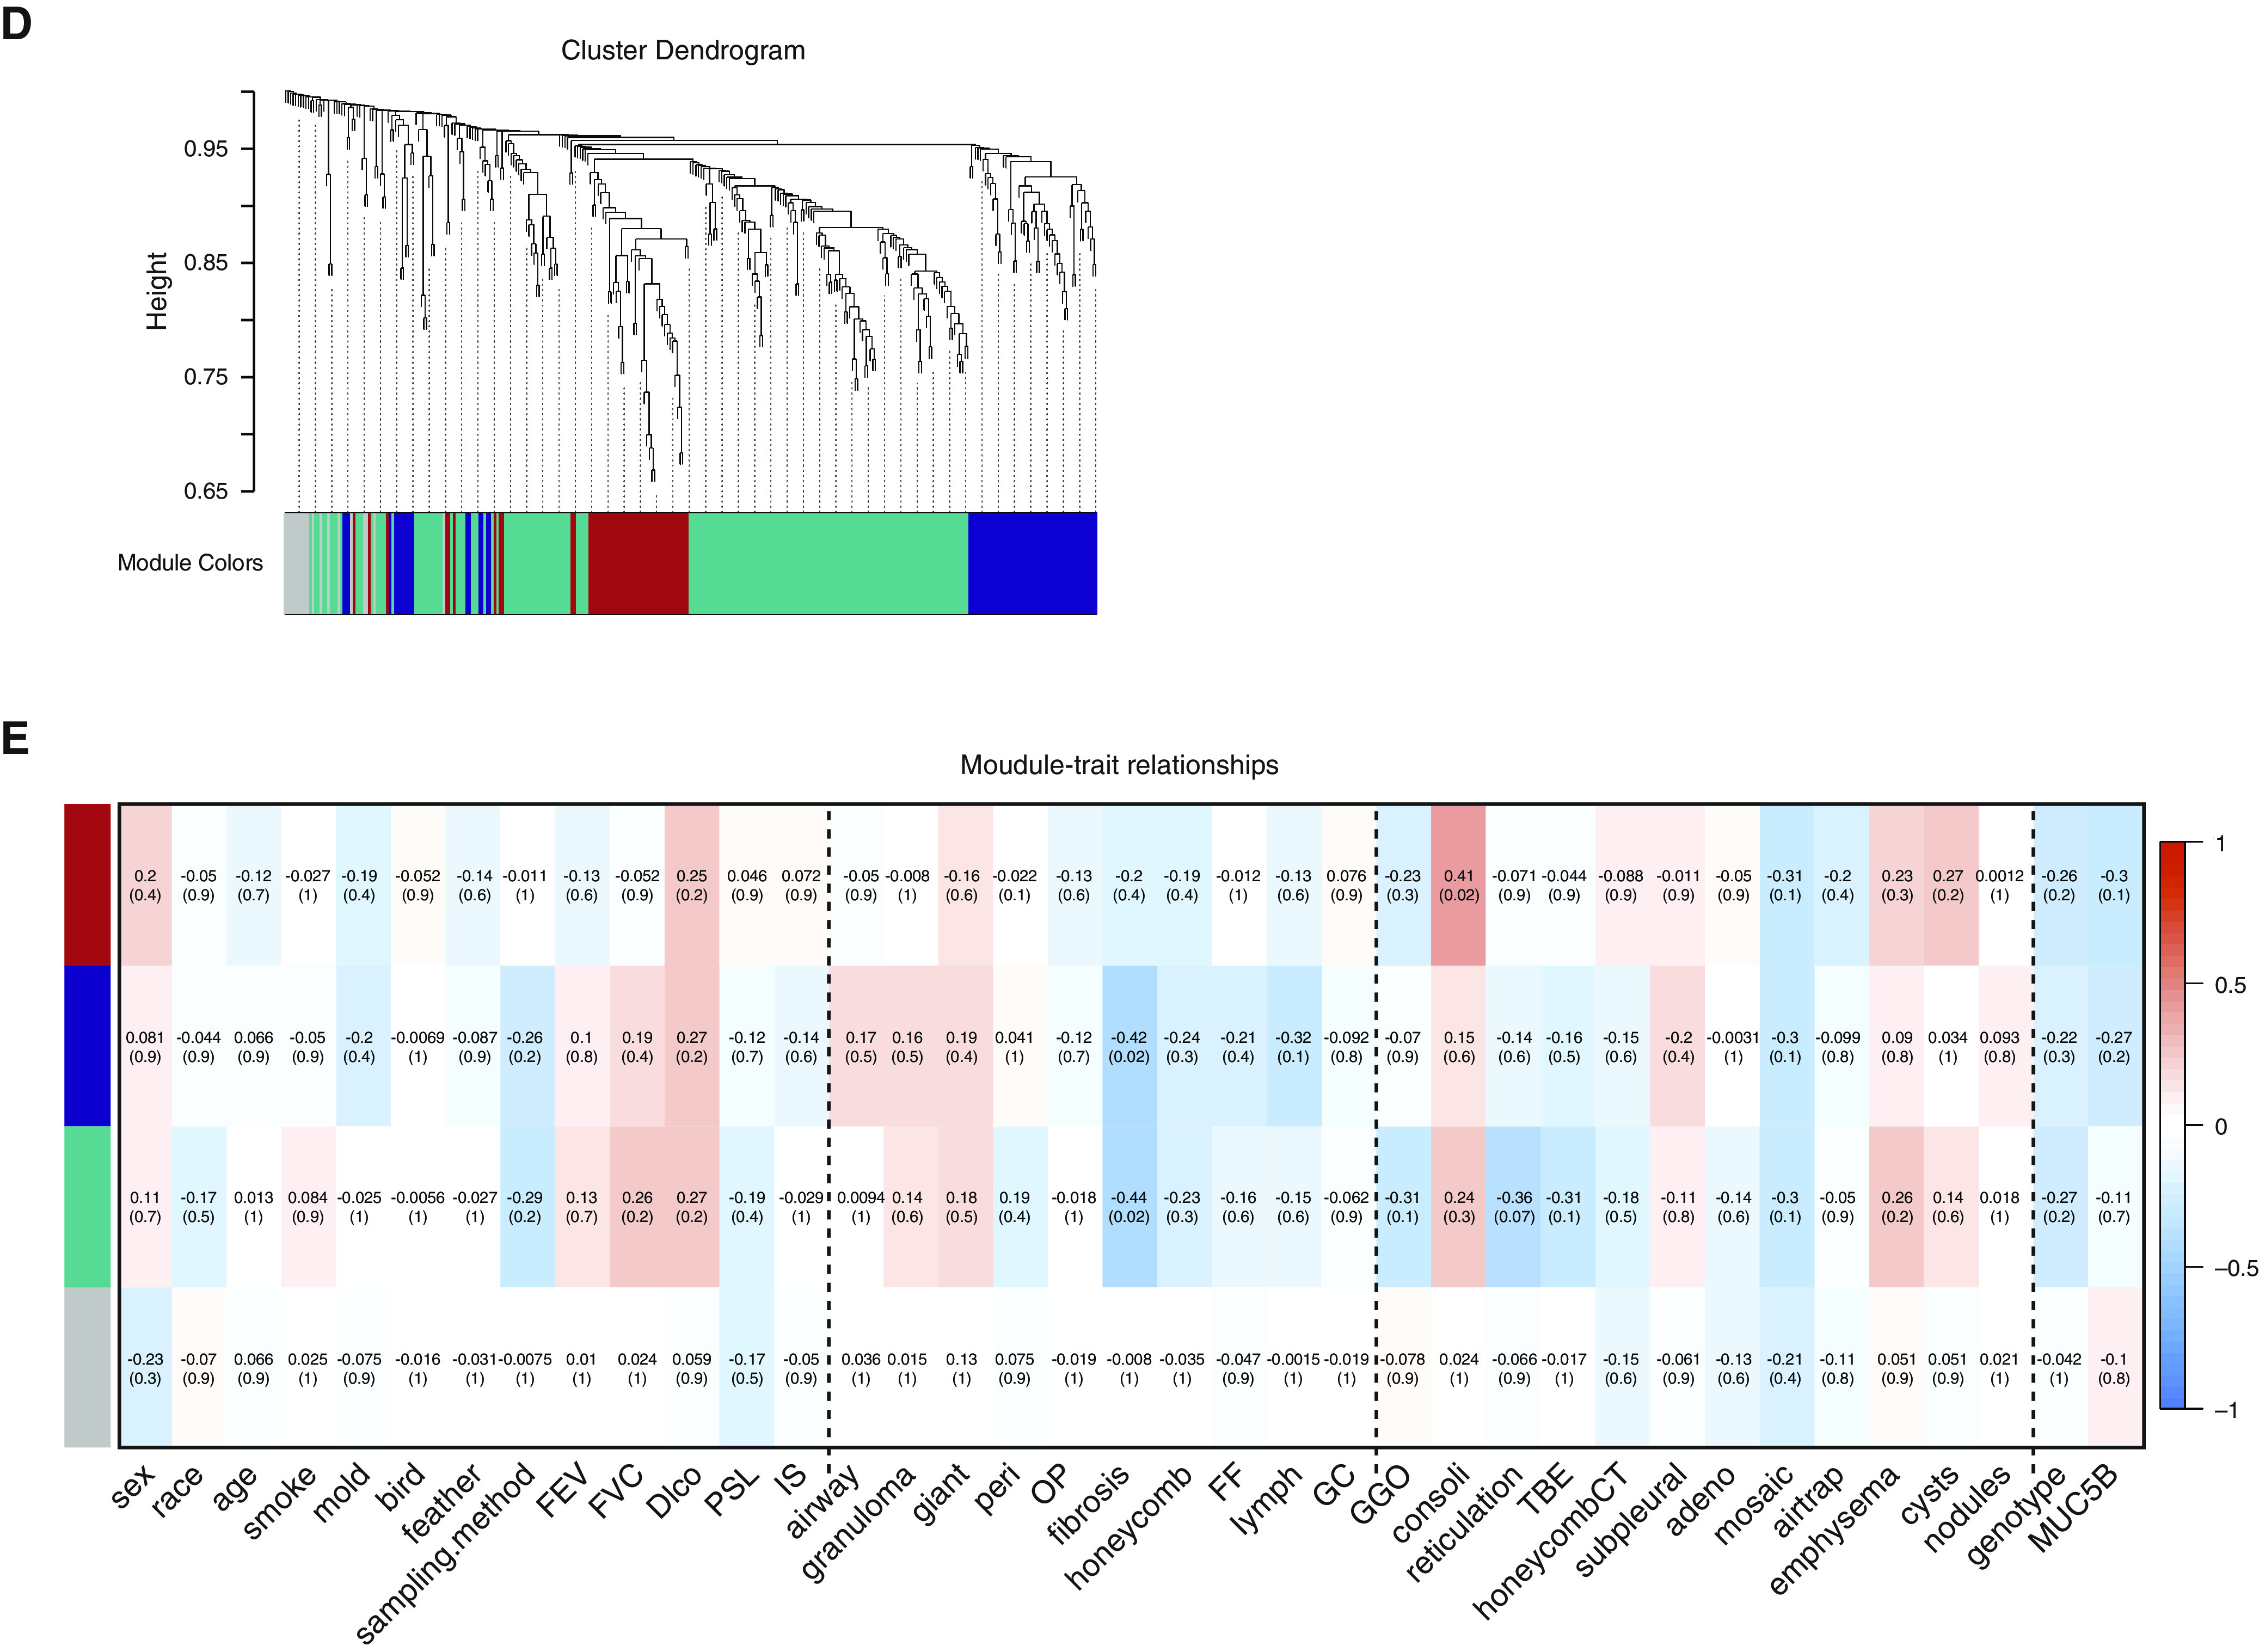
Weighted gene coexpression network analysis of RNA-sequencing data from 730 chronic hypersensitivity pneumonitis (CHP) differentially expressed genes. (A) Clustering dendrograms of CHP upregulated genes, obtained by average linkage hierarchical clustering. The color row shows seven coexpression modules. (B) Module–trait relationships in subjects with CHP. Each row presents a module and each column presents clinical, pathological, and radiological traits. Correlation of module eigengene with each trait was determined by Pearson correlation and described the corresponding correlation and Benjamini-Hochberg adjusted P value in each cell colored by the direction of correlation (red) or anticorrelation (blue). Vertical dashed lines on the heatmap separate clinical, pathological, and radiological traits. (C) A bubble plot displaying the most significant GO terms and KEGG pathways enriched to yellow and turquoise modules. Bubble colors represent modules, and sizes indicate the number of genes. (D) Clustering dendrograms of CHP downregulated genes, obtained by average linkage hierarchical clustering. The color row shows four coexpression modules. (E) Module–trait relationships in subjects with CHP. Each row presents a module and each column presents clinical, pathological, and radiological traits. Correlation of module eigengene with each trait was described in each cell colored by the direction of correlation (red) or anticorrelation (blue) presented with Benjamini-Hochberg
The 317 genes downregulated in both transplanted and biopsy CHP were also clustered into four modules (Figures 3D and 3E). The turquoise module was enriched for genes involved in smooth muscle contraction and steroid hormone biosynthesis and was associated with pathological fibrosis (r = −0.44, P = 0.02). All hub genes for each module and pathways are described in Table E3.
Relationship between MUC5B and Clinical, Radiological, and Pathological Features
Subjects with CHP with MUC5B rs35705950 minor allele (genotype TT or GT compared with GG) were older (57.3 ± 11.4 vs. 62.9 ± 8.1, P = 0.04, Figure 4A) and were more often cigarette smokers (72.0% vs. 45.8%, P = 0.05); however, there was no other significant difference in sex, race, pulmonary function, treatment, histopathological, or radiological findings. We performed differential gene expression analysis using DESeq2 between subjects with CHP with MUC5B promoter rs35705950 GG alleles and with GT/TT alleles among 730 genes differentially expressed and specific to CHP. SLC12A1 was highly expressed in subjects with CHP with GT/TT alleles (log2 fold change, 2.31; adjusted P value, 0.001); on the other hand, BAAT and COL10A1 were highly expressed in subjects with CHP with GG alleles (log2 fold change, −1.24 and −1.97; adjusted P values, 0.01 and 8.3 × 10⁻⁵, respectively). Among subjects with CHP, MUC5B mRNA expression was negatively associated with %DlCO (r = −0.35, P = 0.01, Figure 4B) and pathological features of lung fibrosis and honeycombing (Figures 4C and 4D, respectively).
Figure 4.

Relationship between MUC5B and clinical or pathological features. (A) Age comparison between subjects with chronic sensitivity pneumonitis with GG versus GT or TT. Subjects with chronic sensitivity pneumonitis with GT or TT were significantly older than subjects with GG (57.3 ± 11.4 vs. 62.9 ± 8.1, P = 0.04). (B) Scatter plot showed negative correlation between MUC5B mRNA expression and %DlCO (R = 0.36, P < 0.001). (C) MUC5B mRNA expression was related to fibrosis score (0 vs. 1, P = 0.04; 2 vs. 3, P = 0.02; 0 vs. 3, P = 0.02) and (D) honeycomb score (0 vs. 3, P = 0.01; 2 vs. 3, P = 0.04).
Discussion
Our results identified gene expression features unique to both CHP and those that overlap with IPF. We found that pathways common to CHP and IPF included upregulated pathways of collagen catabolism and cell–cell adhesion, and downregulated pathways of angiogenesis. In contrast, pathways uniquely upregulated in CHP were related to chemokine-mediated signaling and immune responsiveness, whereas the steroid metabolism pathway was downregulated. Moreover, among subjects with CHP, we found that adaptive immunity and epithelial cell development gene expression was associated with improved or reduced lung function, respectively, and that MUC5B expression was also associated with epithelial cell development gene expression. In subjects with CHP, MUC5B expression was also associated with lung fibrosis and honeycombing.
This study revealed that many specific features of gene expression are similar between IPF and CHP. Of 730 genes differentially expressed genes in CHP, 471 genes were shared between CHP and IPF. SPRR1A showed highest expression in both CHP and IPF compared with controls. SPRR1A is a protein coding gene of small proline-rich protein 1A, or Cornifin-A, characterized by high content of proline residues and was originally identified in keratinocytes. The function of this protein is still uncertain, and there are no previous reports regarding the relationship between this protein and IPF in humans. However, expression of SPRR1A is associated with increased epithelial proliferation, and several studies have reported that this protein was increased with cigarette smoke, vitamin A, or carbon monoxide treatment in bleomycin-mediated lung fibrosis in murine (27, 28). CXCL13 was highly expressed in both subjects with IPF and those with CHP. This chemokine is selectively chemotactic for B cells and plays an important role in B-cell homing to inflammatory foci. Its overexpression in subjects with IPF was related to a poor prognosis and presence of acute exacerbation and pulmonary artery hypertension (29, 30).
Gene set enrichment analysis identified a number of developmental processes that were also common to IPF and CHP, including epithelial cell development pathways, extracellular matrix, and collagen organization and metabolism. These findings are consistent with the concept that pulmonary fibrosis is caused by abnormal activation of alveolar epithelial cells, which express numerous mediators involved in the expansion of the fibroblast, differentiation of myofibroblasts, and in the exaggerated accumulation of extracellular matrix provoking the loss of lung architecture (31). Our analysis confirmed enrichment of the PI3K–Akt pathway. The PI3K–Akt pathway mediates pulmonary fibrogenesis in IPF via prosurvival/antiapoptotic signaling, and several murine studies have found that PI3K inhibitors can reduce fibroblast proliferation and improve pulmonary function (32, 33). These findings suggest that inhibition of PI3K may prove to be effective in both IPF and CHP.
Gene expression patterns specific to CHP were also identified. Among the numerous newly identified genes specific to CHP, several are of particular interest. BGN showed one of the highest expressions in subjects with CHP. This gene encodes biglycan protein, a small leucine-rich repeat proteoglycan. By binding to Toll-like receptors 2 and 4, this protein acts as a danger-associated molecular pattern and initiates inflammation (34, 35), potentially forming a bridge between immune responsiveness and lung fibrosis. Biglycan is elevated in several lung conditions, including bleomycin-mediated lung fibrosis in mice (36), chronic obstructive pulmonary disease with frequent exacerbation (37), and bronchiolitis obliterans syndrome after lung transplantation (38).
We also found CHP-specific genes, CXCL9, an IFN-γ–inducible chemokine and a ligand for CXCR3. CXCL9 is highly expressed in granuloma on lung tissue, serum, and BAL of granulomatous diseases like sarcoidosis and HP and was associated with a favorable prognosis with high protein concentration in serum from subjects with HP (39, 40).
To elucidate the relationship between these gene expression profiles and clinical, pathological, or radiological features in CHP, 413 upregulated and 317 downregulated genes in CHP were evaluated with WGCNA, a methodology for analyzing high-dimensional relationship with constructing biological networks based on pairwise correlation. This analysis identified gene expression modules associated with physiologic and pathological features of CHP. Specifically, among subjects with CHP, adaptive immune and epithelial development gene expression pathways modules were found to be associated with improved and reduced lung function, respectively, and MUC5B expression was associated with epithelial development gene expression and reduced lung function. Overall, our gene expression and pathway analysis illustrated variation of disease severity and pathological and radiological features that were previously unknown.
The MUC5B promoter variant rs35705950 is the strongest risk factor for the development of IPF (11). Subjects with IPF with T alleles showed a significantly higher subpleural and axial distribution and greater proportion of confident UIP pattern diagnoses (41). Subjects with T alleles were also associated with UIP-like computed tomography findings in rheumatoid arthritis (42) and CHP (24). These findings indicate that the MUC5B promoter variant is specifically associated with a UIP-like pattern or honeycombing in interstitial lung disease. Although we could not find a definitive relationship between MUC5B promoter variant and clinical, histopathological, and radiological pattern in this limited sample, we found that higher MUC5B expression was correlated with lower %DlCO and presence of honeycombing and fibrosis by histopathology. The relationship between MUC5B expression and honeycombing was also observed previously by us in subjects with IPF (11, 43) and raises the possibility that expression of MUC5B is causally related to the development of honeycombed lesions in the lung (44). We also identified three genes differentially expressed in CHP that were associated with the MUC5B genotype.
There are several limitations in this study. First, we could not assess the clinical course or prognosis of subjects with CHP enrolled in our study because approximately half of subjects with CHP were enrolled at the time of lung transplantation and many of our subjects originated from the LTRC. However, we found that the extent of lung fibrosis was associated with specific patterns of gene expression. Second, the diagnosis of CHP was not made centrally but was reconfirmed with a central review. Third, this study is not a multicenter analysis and did not have a validation cohort because of sample size; despite this limitation, this is the largest transcriptome analysis for CHP to date. Fourth, racial, geographical, or causative antigen differences showed little information potentially caused by lack of sample power and population. Further examination with a multicenter and prospective study may be warranted. Fifth, clinical severity of enrolled patients with CHP was potentially higher than that of the average patients, because all the cases clinically required biopsy or transplant.
In conclusion, we identified CHP patterns of gene expression that were associated with clinical, radiographic, and pathological features of disease, highlighting both the overlap and distinct biological features of CHP and IPF. Unique to CHP, we found that a gene module including MUC5B expression correlates with features of fibrotic lung disease, whereas immune response signatures positively correlate with lung function.
Supplementary Material
Acknowledgments
Acknowledgment
The authors thank the Nina Ireland Program for Lung Health, the LTRC, the individuals who participated in the studies that contributed to this work, and the clinical and research staff at each site for their efforts.
Footnotes
Supported by grants from the NHLBI (R01-HL097163, P01-HL092870, and UH3-HL123442) and the Department of Defense (W81XWH-17-1-0597).
Author Contributions: I.V.Y. and D.A.S. designed the study and provided quality control at each step of the project. H.F., T.O., A.D.W., K.K.B., J.A.K., M.R., J.S.L., and P.J.W. provided data and samples. H.F. performed the sample preparation. A.D.W. and I.V.Y. supervised and coordinated the laboratory work. H.F., J.H.C., I.R.K., and J.S.K. performed the data cleanings and analysis. H.F., T.J.B., M.I.S., K.K.B., C.D.C., J.S.L., and P.J.W. contributed clinical, pathological, or radiological evaluation and diagnosis. All authors contributed to data interpretation. H.F. and D.A.S. wrote the original draft of the manuscript. All authors contributed to manuscript review, editing, and final approval for submission.
This article has an online supplement, which is accessible from this issue’s table of contents at www.atsjournals.org.
Originally Published in Press as DOI: 10.1164/rccm.202001-0134OC on June 30, 2020
Author disclosures are available with the text of this article at www.atsjournals.org.
References
- 1.Selman M, Pardo A, King TE., Jr Hypersensitivity pneumonitis: insights in diagnosis and pathobiology. Am J Respir Crit Care Med. 2012;186:314–324. doi: 10.1164/rccm.201203-0513CI. [DOI] [PubMed] [Google Scholar]
- 2.Chiba S, Tsuchiya K, Akashi T, Ishizuka M, Okamoto T, Furusawa H, et al. Chronic hypersensitivity pneumonitis with a usual interstitial pneumonia-like pattern: correlation between histopathologic and clinical findings. Chest. 2016;149:1473–1481. doi: 10.1016/j.chest.2015.12.030. [DOI] [PubMed] [Google Scholar]
- 3.Wang P, Jones KD, Urisman A, Elicker BM, Urbania T, Johannson KA, et al. Pathologic findings and prognosis in a large prospective cohort of chronic hypersensitivity pneumonitis. Chest. 2017;152:502–509. doi: 10.1016/j.chest.2017.02.011. [DOI] [PubMed] [Google Scholar]
- 4.Churg A, Sin DD, Everett D, Brown K, Cool C. Pathologic patterns and survival in chronic hypersensitivity pneumonitis. Am J Surg Pathol. 2009;33:1765–1770. doi: 10.1097/PAS.0b013e3181bb2538. [DOI] [PubMed] [Google Scholar]
- 5.Kern RM, Singer JP, Koth L, Mooney J, Golden J, Hays S, et al. Lung transplantation for hypersensitivity pneumonitis. Chest. 2015;147:1558–1565. doi: 10.1378/chest.14-1543. [DOI] [PMC free article] [PubMed] [Google Scholar]
- 6.Morell F, Villar A, Montero M-Á, Muñoz X, Colby TV, Pipvath S, et al. Chronic hypersensitivity pneumonitis in patients diagnosed with idiopathic pulmonary fibrosis: a prospective case-cohort study. Lancet Respir Med. 2013;1:685–694. doi: 10.1016/S2213-2600(13)70191-7. [DOI] [PubMed] [Google Scholar]
- 7.Shibata S, Furusawa H, Inase N. Pirfenidone in chronic hypersensitivity pneumonitis: a real-life experience. Sarcoidosis Vasc Diffuse Lung Dis. 2018;35:139–142. doi: 10.36141/svdld.v35i2.6170. [DOI] [PMC free article] [PubMed] [Google Scholar]
- 8.Flaherty KR, Wells AU, Cottin V, Devaraj A, Walsh SLF, Inoue Y, et al. INBUILD Trial Investigators. Nintedanib in progressive fibrosing interstitial lung diseases. N Engl J Med. 2019;381:1718–1727. doi: 10.1056/NEJMoa1908681. [DOI] [PubMed] [Google Scholar]
- 9.Fernández Pérez ER, Swigris JJ, Forssén AV, Tourin O, Solomon JJ, Huie TJ, et al. Identifying an inciting antigen is associated with improved survival in patients with chronic hypersensitivity pneumonitis. Chest. 2013;144:1644–1651. doi: 10.1378/chest.12-2685. [DOI] [PMC free article] [PubMed] [Google Scholar]
- 10.Rodríguez de Castro F, Carrillo T, Castillo R, Blanco C, Díaz F, Cuevas M. Relationships between characteristics of exposure to pigeon antigens: clinical manifestations and humoral immune response. Chest. 1993;103:1059–1063. doi: 10.1378/chest.103.4.1059. [DOI] [PubMed] [Google Scholar]
- 11.Seibold MA, Wise AL, Speer MC, Steele MP, Brown KK, Loyd JE, et al. A common MUC5B promoter polymorphism and pulmonary fibrosis. N Engl J Med. 2011;364:1503–1512. doi: 10.1056/NEJMoa1013660. [DOI] [PMC free article] [PubMed] [Google Scholar]
- 12.Ley B, Torgerson DG, Oldham JM, Adegunsoye A, Liu S, Li J, et al. Rare protein-altering telomere-related gene variants in patients with chronic hypersensitivity pneumonitis. Am J Respir Crit Care Med. 2019;200:1154–1163. doi: 10.1164/rccm.201902-0360OC. [DOI] [PMC free article] [PubMed] [Google Scholar]
- 13.Selman M, Pardo A, Barrera L, Estrada A, Watson SR, Wilson K, et al. Gene expression profiles distinguish idiopathic pulmonary fibrosis from hypersensitivity pneumonitis. Am J Respir Crit Care Med. 2006;173:188–198. doi: 10.1164/rccm.200504-644OC. [DOI] [PMC free article] [PubMed] [Google Scholar]
- 14.Horimasu Y, Ishikawa N, Iwamoto H, Ohshimo S, Hamada H, Hattori N, et al. Clinical and molecular features of rapidly progressive chronic hypersensitivity pneumonitis. Sarcoidosis Vasc Diffuse Lung Dis. 2017;34:48–57. doi: 10.36141/svdld.v34i1.5388. [DOI] [PMC free article] [PubMed] [Google Scholar]
- 15.Furusawa H, Cardwell J, Okamoto T, Walts AD, Schwarz MI, Cool CD, et al. Chronic hypersensitivity pneumonitis (CHP), an ILD with distinct molecular signatures [abstract] Am J Respir Crit Care Med. 2020;201:A7135. doi: 10.1164/rccm.202001-0134OC. [DOI] [PMC free article] [PubMed] [Google Scholar]
- 16.Morisset J, Johannson KA, Jones KD, Wolters PJ, Collard HR, Walsh SLF, et al. HP Delphi Collaborators. Identification of diagnostic criteria for chronic hypersensitivity pneumonitis: an international modified Delphi survey. Am J Respir Crit Care Med. 2018;197:1036–1044. doi: 10.1164/rccm.201710-1986OC. [DOI] [PMC free article] [PubMed] [Google Scholar]
- 17.Raghu G, Remy-Jardin M, Myers JL, Richeldi L, Ryerson CJ, Lederer DJ, et al. American Thoracic Society, European Respiratory Society, Japanese Respiratory Society, and Latin American Thoracic Society. Diagnosis of idiopathic pulmonary fibrosis: an official ATS/ERS/JRS/ALAT clinical practice guideline. Am J Respir Crit Care Med. 2018;198:e44–e68. doi: 10.1164/rccm.201807-1255ST. [DOI] [PubMed] [Google Scholar]
- 18.Bray NL, Pimentel H, Melsted P, Pachter L. Near-optimal probabilistic RNA-seq quantification. Nat Biotechnol. 2016;34:525–527. doi: 10.1038/nbt.3519. [DOI] [PubMed] [Google Scholar]
- 19.Love MI, Huber W, Anders S. Moderated estimation of fold change and dispersion for RNA-seq data with DESeq2. Genome Biol. 2014;15:550. doi: 10.1186/s13059-014-0550-8. [DOI] [PMC free article] [PubMed] [Google Scholar]
- 20.Benjamini Y, Hochberg Y. Controlling the false discovery rate: a practical and powerful approach to multiple testing. J R Stat Soc B. 1995;57:289–300. [Google Scholar]
- 21.Huang W, Sherman BT, Lempicki RA. Systematic and integrative analysis of large gene lists using DAVID bioinformatics resources. Nat Protoc. 2009;4:44–57. doi: 10.1038/nprot.2008.211. [DOI] [PubMed] [Google Scholar]
- 22.Kanehisa M, Sato Y, Furumichi M, Morishima K, Tanabe M. New approach for understanding genome variations in KEGG. Nucleic Acids Res. 2019;47:D590–D595. doi: 10.1093/nar/gky962. [DOI] [PMC free article] [PubMed] [Google Scholar]
- 23.The Gene Ontology Consortium. The gene ontology resource: 20 years and still GOing strong. Nucleic Acids Res. 2019;47:D330–D338. doi: 10.1093/nar/gky1055. [DOI] [PMC free article] [PubMed] [Google Scholar]
- 24.Ley B, Newton CA, Arnould I, Elicker BM, Henry TS, Vittinghoff E, et al. The MUC5B promoter polymorphism and telomere length in patients with chronic hypersensitivity pneumonitis: an observational cohort-control study. Lancet Respir Med. 2017;5:639–647. doi: 10.1016/S2213-2600(17)30216-3. [DOI] [PMC free article] [PubMed] [Google Scholar]
- 25.Langfelder P, Horvath S. WGCNA: an R package for weighted correlation network analysis. BMC Bioinformatics. 2008;9:559. doi: 10.1186/1471-2105-9-559. [DOI] [PMC free article] [PubMed] [Google Scholar]
- 26.R Development Core Team. R: a language and environment for statistical computing. Vienna, Austria: R Foundation for Statistical Computing; 2018. [Google Scholar]
- 27.Tesfaigzi J, Wright PS, Oreffo V, An G, Wu R, Carlson DM. A small proline-rich protein regulated by vitamin A in tracheal epithelial cells is induced in lung tumors. Am J Respir Cell Mol Biol. 1993;9:434–440. doi: 10.1165/ajrcmb/9.4.434. [DOI] [PubMed] [Google Scholar]
- 28.Zheng L, Zhou Z, Lin L, Alber S, Watkins S, Kaminski N, et al. Carbon monoxide modulates alpha-smooth muscle actin and small proline rich-1a expression in fibrosis. Am J Respir Cell Mol Biol. 2009;41:85–92. doi: 10.1165/rcmb.2007-0401OC. [DOI] [PMC free article] [PubMed] [Google Scholar]
- 29.Neighbors M, Cabanski CR, Ramalingam TR, Sheng XR, Tew GW, Gu C, et al. Prognostic and predictive biomarkers for patients with idiopathic pulmonary fibrosis treated with pirfenidone: post-hoc assessment of the CAPACITY and ASCEND trials. Lancet Respir Med. 2018;6:615–626. doi: 10.1016/S2213-2600(18)30185-1. [DOI] [PubMed] [Google Scholar]
- 30.Vuga LJ, Tedrow JR, Pandit KV, Tan J, Kass DJ, Xue J, et al. C-X-C motif chemokine 13 (CXCL13) is a prognostic biomarker of idiopathic pulmonary fibrosis. Am J Respir Crit Care Med. 2014;189:966–974. doi: 10.1164/rccm.201309-1592OC. [DOI] [PMC free article] [PubMed] [Google Scholar]
- 31.Pardo A, Cabrera S, Maldonado M, Selman M. Role of matrix metalloproteinases in the pathogenesis of idiopathic pulmonary fibrosis. Respir Res. 2016;17:23. doi: 10.1186/s12931-016-0343-6. [DOI] [PMC free article] [PubMed] [Google Scholar]
- 32.Le Cras TD, Korfhagen TR, Davidson C, Schmidt S, Fenchel M, Ikegami M, et al. Inhibition of PI3K by PX-866 prevents transforming growth factor-alpha-induced pulmonary fibrosis. Am J Pathol. 2010;176:679–686. doi: 10.2353/ajpath.2010.090123. [DOI] [PMC free article] [PubMed] [Google Scholar]
- 33.Lukey PT, Harrison SA, Yang S, Man Y, Holman BF, Rashidnasab A, et al. A randomised, placebo-controlled study of omipalisib (PI3K/mTOR) in idiopathic pulmonary fibrosis. Eur Respir J. 2019;53:1801992. doi: 10.1183/13993003.01992-2018. [DOI] [PubMed] [Google Scholar]
- 34.Roedig H, Nastase MV, Wygrecka M, Schaefer L. Breaking down chronic inflammatory diseases: the role of biglycan in promoting a switch between inflammation and autophagy. FEBS J. 2019;286:2965–2979. doi: 10.1111/febs.14791. [DOI] [PubMed] [Google Scholar]
- 35.Frevert CW, Felgenhauer J, Wygrecka M, Nastase MV, Schaefer L. Danger-associated molecular patterns derived from the extracellular matrix provide temporal control of innate immunity. J Histochem Cytochem. 2018;66:213–227. doi: 10.1369/0022155417740880. [DOI] [PMC free article] [PubMed] [Google Scholar]
- 36.Rydell-Törmänen K, Andréasson K, Hesselstrand R, Westergren-Thorsson G. Absence of fibromodulin affects matrix composition, collagen deposition and cell turnover in healthy and fibrotic lung parenchyma. Sci Rep. 2014;4:6383. doi: 10.1038/srep06383. [DOI] [PMC free article] [PubMed] [Google Scholar]
- 37.Sun P, Ye R, Wang C, Bai S, Zhao L. Identification of proteomic signatures associated with COPD frequent exacerbators. Life Sci. 2019;230:1–9. doi: 10.1016/j.lfs.2019.05.047. [DOI] [PubMed] [Google Scholar]
- 38.Müller C, Andersson-Sjöland A, Schultz HH, Eriksson LT, Andersen CB, Iversen M, et al. Early extracellular matrix changes are associated with later development of bronchiolitis obliterans syndrome after lung transplantation. BMJ Open Respir Res. 2017;4:e000177. doi: 10.1136/bmjresp-2016-000177. [DOI] [PMC free article] [PubMed] [Google Scholar]
- 39.Nukui Y, Yamana T, Masuo M, Tateishi T, Kishino M, Tateishi U, et al. Serum CXCL9 and CCL17 as biomarkers of declining pulmonary function in chronic bird-related hypersensitivity pneumonitis. PLoS One. 2019;14:e0220462. doi: 10.1371/journal.pone.0220462. [DOI] [PMC free article] [PubMed] [Google Scholar]
- 40.Nishioka Y, Manabe K, Kishi J, Wang W, Inayama M, Azuma M, et al. CXCL9 and 11 in patients with pulmonary sarcoidosis: a role of alveolar macrophages. Clin Exp Immunol. 2007;149:317–326. doi: 10.1111/j.1365-2249.2007.03423.x. [DOI] [PMC free article] [PubMed] [Google Scholar]
- 41.Chung JH, Peljto AL, Chawla A, Talbert JL, McKean DF, Rho BH, et al. CT imaging phenotypes of pulmonary fibrosis in the MUC5B promoter site polymorphism. Chest. 2016;149:1215–1222. doi: 10.1016/j.chest.2015.11.009. [DOI] [PMC free article] [PubMed] [Google Scholar]
- 42.Juge PA, Lee JS, Ebstein E, Furukawa H, Dobrinskikh E, Gazal S, et al. MUC5B promoter variant and rheumatoid arthritis with interstitial lung disease. N Engl J Med. 2018;379:2209–2219. doi: 10.1056/NEJMoa1801562. [DOI] [PMC free article] [PubMed] [Google Scholar]
- 43.Yang IV, Coldren CD, Leach SM, Seibold MA, Murphy E, Lin J, et al. Expression of cilium-associated genes defines novel molecular subtypes of idiopathic pulmonary fibrosis. Thorax. 2013;68:1114–1121. doi: 10.1136/thoraxjnl-2012-202943. [DOI] [PMC free article] [PubMed] [Google Scholar]
- 44.Evans CM, Fingerlin TE, Schwarz MI, Lynch D, Kurche J, Warg L, et al. Idiopathic pulmonary fibrosis: a genetic disease that involves mucociliary dysfunction of the peripheral airways. Physiol Rev. 2016;96:1567–1591. doi: 10.1152/physrev.00004.2016. [DOI] [PMC free article] [PubMed] [Google Scholar]
Associated Data
This section collects any data citations, data availability statements, or supplementary materials included in this article.