

Abstract
This case study is in response to a recognized need to transform short-term regional ocean condition forecast information into useful data products for a range of end users, considering their perceptions of uncertainty and risk associated with these forecasts. It demonstrates the value of user engagement in achieving long-term goals for data providers. Commercial fishermen from Oregon are selected as key information users due to the physically risky and economically uncertain nature of their profession, their expertise at navigating the marine environment, and their important economic and cultural role at the Oregon coast. Semistructured interviews (n = 16) are used to clarify the processes that govern decision making, in terms of risk perception and comfort with uncertainty. The results characterize a community “mental model” in regard to ocean use and ocean forecasts. Findings reveal that commercial fishermen consume and interpret forecast data in a nonlinear fashion by combining multiple sources and data types and with a heavy reliance on real-time data. Our assessment is that improving accuracy at temporal and spatial scales that are relevant to decision making, improving the accessibility of forecasts, and increasing forecast lead time could potentially add more value to forecasts than quantifying and communicating the types of uncertainty metrics used within the scientific community.
Keywords: ocean forecasts, end-user, decision making, risk, uncertainty
Introduction
From Forecasts to Data Products
Ocean and coastal observing systems and numerical modeling techniques have substantially advanced the quality of regional ocean forecasts in recent years, and there is a recognized need from the scientific community (Integrated Framework for Sustained Ocean Observing [IFSOO] Task Team, 2012; U.S. Integrated Ocean Observing System [IOOS] Of-fice, 2010; Kourafalou et al., 2015; National Academies of Sciences [NAS], 2017b) to transition from research to operational systems that can provide value-added data products to a variety of marine stakeholders. Forecasts of surface winds and waves have long been available to mariners. “Ocean condition forecasts,” as used here, include these and newly available forecasts of surface and subsurface current speed and direction, water temperature, salinity, pH, oxygen concentrations, and biological components such as chlorophyll A (Kite-Powell et al., 2008). Improvements to short-term ocean condition forecasts—defined here as having a lead time of 1–120 h—that are available through web interfaces are of particular interest to sea-going end users for planning optimal routes resulting in cost savings and safety improvements (Kite-Powell et al., 2008; Price & Rosenfeld, 2012). Marine operations encompass a diverse group of end users that includes commercial shipping and fishing, recreational fishing and boating, Coast Guard, and oil spill and response (Price & Rosenfeld, 2012). While the methods needed to improve the technical aspects of these regional observation and numerical modeling systems are relatively well known within the scientific community (Kourafalou et al., 2015; Siddorn et al., 2016; Wilkin et al., 2017), recommendations regarding how to identify, prioritize, and engage with end users outside that community are notably lacking.
Ocean condition forecasts are used by decision makers to reduce uncertainty about the future state of the ocean and to manage risk. Building on recent recommendations from the weather enterprise, this research assumes that the providers of ocean forecast data products can improve the products’ usefulness by better understanding the factors that affect decision making and behavior among individual end users, while also recognizing the importance of characterizing and communicating forecast uncertainty (NAS, 2017a; National Research Council [NRC], 2006).
The goal of this research is to gain insight into how an important subgroup of ocean forecast end users, commercial fishermen in Oregon, use ocean forecasts to make decisions. Most high-resolution, short-term regional ocean forecasts that take into account local features are presently produced using single, deterministic ocean models and therefore cannot provide the kinds of uncertainty metrics that the public is used to seeing with coarse resolution global weather forecasts that use ensemble modeling. Furthermore, the research within the weather enterprise tends to focus on laypeople’s interpretations of uncertainty (Morss et al., 2008; Sivle et al., 2014; Sivle & Kolstø, 2016; Zabini, 2016) or their interpretations of hurricane or tornado hazard warnings (Demuth et al., 2012), which may not have direct parallels for forecasts of ocean currents and water properties.
Case Study: Oregon Commercial Fishermen
Oregon’s commercial fisheries are physically risky and economically uncertain, have long been an integral part of the fabric of many coastal communities, and are an economic driver for the coast and the state (Oregon Department of Fish and Wildlife [ODFW], 2017). Nationwide, commercial fishing is ranked as the most dangerous occupation, with hazardous weather and waves as significant contributing factors (Centers for Disease Control and Prevention [CDC], 2010). West Coast fisheries experienced 115 commercial fishing deaths over a 15-year period (2000–2014) or almost eight fatalities annually (National Institute for Occupational Safety and Health [NIOSH], 2017). Accessing the ocean is particularly difficult in the Pacific Northwest due to hazards associated with entering and leaving port, or “crossing the bar,” where a bay or flowing river enters the ocean. The “bar” refers to a shallow region of accumulated sediment at the entrance to a port where incoming wave heights are amplified and may break, creating dangerous conditions.
Commercial fishermen in Oregon are adept at seeking out sources of present and recent ocean condition information that include surface temperatures, currents, waves, and wind to inform their decisions on an almost daily basis (Duncan, 2014). They have a vested interest in access to, and reliability of, this information because weather and ocean conditions play a major role in all aspects of commercial fishing (Savelli & Joslyn, 2012). Findings from previous research on the use of ocean condition information for strategic decision making revealed that the fishermen use multiple data sources for a variety of reasons yet lack a single trusted source (Duncan, 2014). These findings led to a cooperative product development effort that created seacast. org (Seacast), a web interface that presents experimental ocean forecast data provided by marine scientists at Oregon State University (OSU) in a simple and intuitive format driven by the visualization needs of the fishermen.
This study goes beyond documenting the fishermen’s visualization preferences. It examines why fishermen want to see the information presented the way that they do by characterizing how they perceive risk and uncertainty regarding ocean use and ocean forecasts. Uncertainty is part of every decision we make as individuals, groups, or institutions, and it is approached and communicated differently based on discipline, profession, or problem domain (Smithson, 2008). The way that different disciplines and professions orient toward uncertainty has implications for the way it is managed or interpreted. The expression of uncertainty metrics is standard practice within scientific cultures so that those who use it can assess its reliability and compare it to other measurements (Joint Committee for Guides in Metrology [JCGM], 2008); however, the way that uncertainty in ocean forecasts is communicated to those outside scientific cultures can affect perceptions of risk by the decision maker (Dieckmann et al., 2015).
Risk perception is the intuitive risk judgment that people rely on to evaluate the hazards that they encounter. An examination of risk perception can increase our understanding of how people make decisions with imperfect information in response to risk and uncertainty (Slovic, 1987). Risk perception research has led to the recognition that the concept of risk is inherently subjective, value-laden, and contextual (Ropeik, 2012; Slovic, 2016). Recent methodologies aiming for a deeper understanding of specific issues have turned away from broad quantitative assessments to a deeper, more qualitative understanding of an individual’s mental model that recognizes that the actions of every individual are based on his or her unique situation.
Mental models are a way to represent the manner in which individuals organize their thoughts and beliefs about aspects of the world that they encounter and the way that world works. A person’s mental model influences the way that new information, such as forecasts or uncertainty metrics, is interpreted (Cone & Winters, 2011; Dieckmann et al., 2015). Individuals construct these “internal representations” based on their personal life experiences and use them to reason, anticipate events, form explanations, and interact with the world (Craik, 1943; Jones et al., 2011). An individual’s orientation toward uncertainty and risk perception is a function of his or her mental model, which is shaped by factors that include discipline, profession, life experience, and social groups. Mental models serve a functional role to structure and simplify the world and therefore are not complete or accurate representations of reality (Abel et al., 1998; Jones et al., 2011). This simplification carries a cost when different people, such as researchers and fishermen, are trying to communicate or solve a problem together but have mental models that “differ in structure, content, focus, and range of concerns” (Abel et al., 1998, p. 79).
The cost of what scientific experts gain in efficiency and insight through their own specialized mental model is that they lose the ability to understand another’s mental model outside their discipline, thus inhibiting communication and collaboration (Kaplan & Kaplan, 1982). Likewise, any non-scientist’s mental model that is constructed based on his or her own motives, goals, or existing knowledge structures will filter incoming information according to his or her own information needs and understanding of the world (Jones et al., 2011; Klayman & Ha, 1989). The difference in mental models between scientists and fishermen, which can be extended to any potential end user outside the scientific community, is why systematic end-user engagement is so crucial to creating useful data products. Furthermore, previous research has shown that understanding contextual factors in risk-based decision making and presenting data at temporal and spatial scales that are relevant to decision making can improve the uptake of scientific information by decision makers (Kirchhoff et al., 2013; Parris et al., 2016; Roux et al., 2006).
This research asks: How can characterizing the commercial fishing community’s mental model of risk and uncertainty (RQ1) provide insights into how ocean condition forecasts are used in decision making and (RQ2) direct the consideration of uncertainty metrics for the data provider?
Methods
Sample and Elicitation
Interviews were conducted with 16 members of the commercial fishing community from the central portion of Oregon’s coast, including 11 vessel operators (skippers) and five onshore counterparts. Onshore counterparts of commercial fishermen include spouses and representatives of the industry who have personal and economic interest in the success of the commercial fishing fleet. Commercial fishing community members were mostly based out of Newport, the second largest port for commercial fishing landings located along the central Oregon coast, while two participants were based out of Charleston-Coos Bay, a smaller port in southern Oregon (Figure 1).
FIGURE 1.

Map of Oregon coast with ports where interview participants were located. Additional geographic areas of interest are labeled.
Purposeful selection was used to obtain a sample of members from the commercial fishing community (Maxwell, 2013), to capture a range of variation within the community in terms of gear types (ODFW, 2017), vessel sizes, and ages. Recruitment started with six key contacts and contributors already engaged in the Seacast project (aka convenience sampling), and an additional 13 contacts were obtained at the suggestion of current participants (aka snowball sampling) (Auerbach & Silverstein, 2003). Purposeful selection further reduced the snowball sample from 13 to 10 participants. All but one participant regularly used web-based interfaces to access ocean and weather information. While interview participants represented a range of fisheries and vessel sizes, some were missing (such as Pacific whiting). Semistructured interviews (Auerbach & Silverstein, 2003) were conducted either in person at a location chosen by the participant or over the phone until saturation was reached.
Interviews were conducted with individual participants following a modified protocol developed by Morgan et al. (2002) that provides a systematic and repeatable interview procedure to elicit an individual’s mental model about risk. There are several procedures available to characterize an individual’s mental model based on research ranging from cognitive psychology to natural resource management (Jones et al., 2011). The Morgan et al. (2002) line of inquiry begins with open-ended prompts that allow participants to freely express their views about a risk followed by more specific, semistructured prompts and questions that target the typical risk assessment topics of exposure, effect, and mitigation of risk (Cone & Winters, 2011; Morgan et al., 2002) (Table 1).
TABLE 1.
Mental model interview protocol for the commercial fishing community.
| Commercial fishing community interview guide |
|---|
| Open-ended prompts |
| Talk to me about the ocean as an uncertain place. |
| Talk to me about the ocean as a risky place. |
| Semistructured prompts and questions |
| Exposure: Tell me what creates hazardous ocean conditions. |
| Effect: How do hazardous ocean conditions impact you? How does the availability of information/forecast data impact you? |
| Mitigation: How do you cope with the risks and uncertainties of ocean conditions before, during, and after your trips? |
Modified from Morgan et al. (2002).
Data Coding and Analysis
All interviews were recorded, transcribed, and coded using MAXQDA software and a grounded theory approach. The traditional method under Morgan et al. (2002) creates conceptual/influence diagrams that express causal connections between concepts, which are then used to identify gaps in knowledge of the target group to improve communications. The grounded theory approach was deemed appropriate because the purpose of this study is to create a narrative to learn about the risks, uncertainties, and decision-making context of an important subgroup of ocean forecast end users, rather than creating a conceptual mental model that is generalizable.
In grounded theory, initial open coding identifies consistently repeating ideas that are grouped into conceptual themes and then connected back to the research questions in a stepwise process to create a theoretical narrative (Auerbach & Silverstein, 2003; Bernard & Ryan, 2010; Creswell & Creswell, 2017). Themes emerged from the data using both inductive codes from repeating ideas and deductive codes guided by the research questions (Bernard & Ryan, 2010). Results are structured into three organizing themes: mental model of risk and uncertainty, scales of decision making: time and space, and relationship with uncertainty.
Results and Discussion
Mental Model of Risk and Uncertainty
The results presented here reveal some of the factors that influence decisions related to commercial fishing through the lens of risk perception and comfort with uncertainty. Research participants described commercial fishermen as small businessmen operating in the ocean environment who experience tension between physical risk and economic risk—or risk versus reward. Time at sea is extremely valuable due to the significant overhead costs of running a commercial fishing operation that includes boat payments, boat maintenance, insurance, fuel, and living wages for crewmembers, and the uncertainties related to fish populations, management decisions, and market forces. A common strategy to maximize time at sea is to fish up to the threshold of bad weather or to “push the envelope,” without endangering the crew or the operation (it should be noted that commercial fishermen commonly referred to all ocean conditions as “weather,” and results are reported as such). Maximizing time at sea also means fishing at certain important times, such as during the winter crab fishery, and making optimal decisions about placing and retrieving gear.
Physical risk is always present, and there is always an attempt to avoid it; however, compounding hazards and the pressure to maximize profit does result in accidents. Several participants described close calls and first-hand accounts of sunken vessel, rescues, and loss of loved ones. Participants generally considered accidents as part of life in commercial fishing and often attribute them to bad weather, equipment failure, human error, or some combination of all three:
There’s always; of course, accidents that happen. But there’s nothing you can really do about that. I think, as a fisherman part of the job is understanding the risks.
The nature of decision making in this high-risk environment can result in stress and frustration for vessel operators that take a toll on their psychological health, which in turn can impact decision making and the perceived risks surrounding profit and loss, as described in the following quotes (one fisherman and one onshore counterpart):
In the back of your mind you’re always thinking, “Should I have gone this morning, should I have gotten out and gotten some work done?” It’s risk and its stress more than anything. Stress is the biggest one for guys running boats. It’s huge. That’ll kill you quicker than the ocean does.
He’s very good at running the boat but he’s a little hard on himself sometimes because it’s a really stressful job and you’re responsible for people, for making calls that could really affect people’s lives.
However, the inherent uncertainty and risk of commercial fishing is a large part of the appeal of the profession and the lifestyle, and participants also expressed enthusiasm for the challenges and freedom of working on the ocean in the face of those risks:
[Commercial fishing is] not for everybody, that’s for sure. But for a lot of fishermen, myself included, it’s the reason we live.
If we wanted something that was certain we’d go get a 9 to 5, right?I do it for the love of the ocean and the love of the freedom and the catch and the chase. So, the uncertainty is just part of the job
Risk tolerance is determined by each vessel operator and depends on several contextual factors for any given scenario, a finding that is consistent with other research into weather-related decision making under risk and uncertainty (see Joslyn & LeClerc, 2013; Joslyn & Savelli, 2010; Savelli & Joslyn, 2012; Sivle & Kolstø, 2016). Participants reported that vessel size is an important factor in a fishermen’s risk orientation and influences personal risk tolerance and decision making. There is a clear “big boat/small boat” division within the Oregon commercial fishing fleet, with the dividing line somewhere around 60 feet. Vessels larger than 60 feet in length are generally able to withstand higher wind speeds and wave heights for longer periods and can cross the bar under more severe conditions. Smaller vessels have lower thresholds and rely more heavily on weather and ocean condition forecasts to move strategically in space and to plan when to cross the bar. Beyond this general distinction, vessel shape, material (e.g., steel or wood), and age combine with the experience of the vessel operator to contribute to individual risk tolerance.
These results suggest that fishermen face intersecting and cumulative risks, that risk tolerance varies by operator and by context, and it is likely that one-size-fits-all forecasts or verbally described risk categories (“go” vs. “no-go”) are not likely to serve their decision-making needs (Joslyn & LeClerc, 2013). Furthermore, mental model interviews revealed that, while there was overall agreement regarding general risk perception and comfort with uncertainty, there were also variations in specifics of decision making based on age, experience, and access to forecasts. These results reflect the importance of understanding diverse perspectives within the community and how insights can vary.
Scales of Decision Making:Time and Space
Commercial fishermen use forecasts for planning and informed decision making to cope with the uncertainty and risk of the future ocean state as it relates to their operations, considering both timing and location (space). The context of a decision scenario includes factors such as time of year, fishery, gear type, vessel size, amount of catch on board, conditions, whether the vessel is at sea or crossing the bar, and other socioeconomic factors. Planning depends on the accessibility of spatially detailed forecasts before and during fishing trips and is largely driven by avoiding hazards such as storms and high wind speeds and wave heights.
Planning
Research participants described planning for a range of time and spatial scales. Shorter-term decisions are often considered within the length of a tidal cycle (looking 6–12 h ahead) when deciding where to lay gear or when to cross the bar. When crossing the bar to enter or exit port, timing and magnitude of the tide, swell, wave period, and wave direction must all be considered together. Beyond these base factors is the consideration of how the channel has been dredged from year to year or how the current may be interacting with the waves, which can change from hour to hour. The most limiting factor for crossing the bar is the timing of the tide. One participant captured this experience when he described the uncertainty in a fisherman’s decision-making process about when to cross the bar and how forecasts are used to manage that uncertainty:
Is it going to be safer to cross the bar right now even though the swell is bigger, but the tide is in my favor? Or do I wait and watch it on the ebb for the smaller swell? Or do I wait until the next tide and see if this front that’s supposed to come in tonight is going to come before the tide changes? You’re looking at a lot of timing, and those are marginal conditions. It’s very marginal if everything has to happen right at the same time for it to be safe. That’s when you’re going to be paying the most attention to your forecasts. That’s when you get as much data as you can to try to predict.
Research participants described how looking at forecasts 1 day (24 h) ahead in time was helpful for making a plan of where to fish for the next day. Forecasts 2–4 days (48–96 h) ahead were also helpful for planning and for practical considerations like knowing how much food to bring on a fishing trip. Different fishermen can come to different conclusions based on their own risk tolerance and the context for their operations (i.e., vessel size), as seen in the following two quotes:
We’re not going to stay in for 2 days if we can go fishing for a day or 2 and get some work done.
No sense of going out today and having a couple hours of getting my butt kicked for no reason when in 2 days I’ll have 4 days of working weather. Good working weather.
The National Weather Service (NWS) marine forecasts were reported to be the first source of weather and ocean conditions for commercial fishermen. Marine forecasts extend 5 days (120 h) into the future and are reported by large marine zones for each Weather Forecasting Office (WFO) that are divided from north to south by points of interest on land and from land to sea in increments of 0–10 and 10–60 nm (Figure 2) (National Oceanic and Atmospheric Administration [NOAA], 2010).
FIGURE 2.
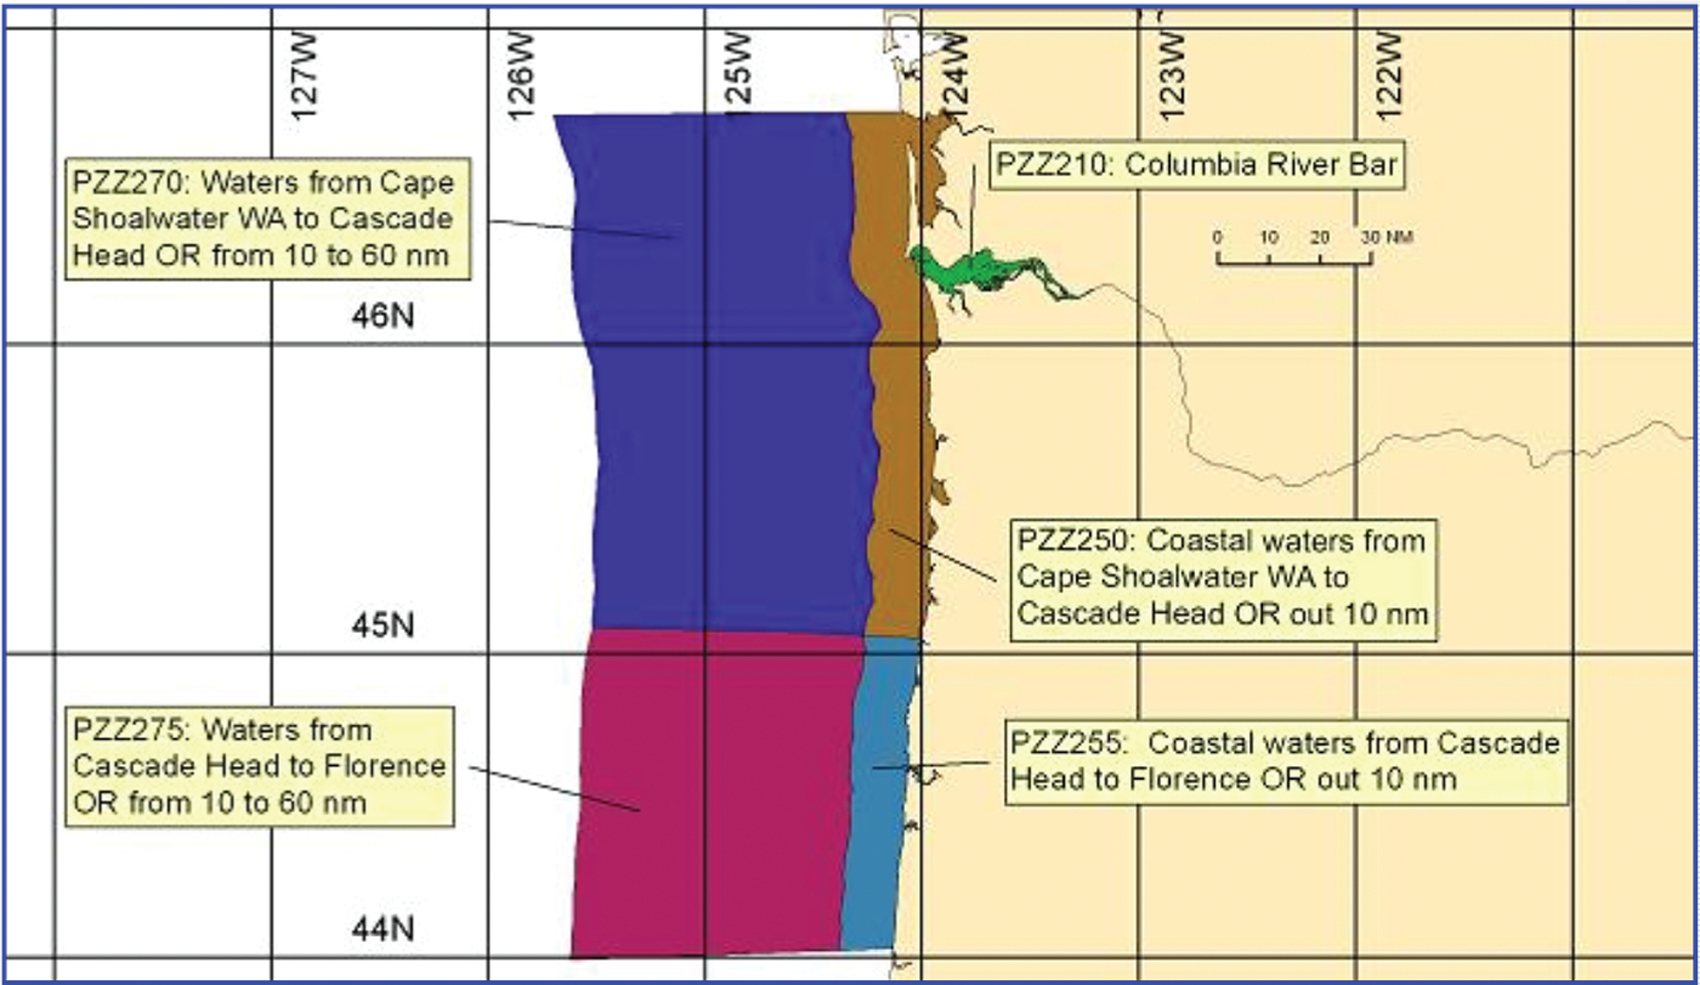
Marine zone forecast areas for the Portland, OR, WFO (NOAA, 2010).
Marine point forecasts are also available for a smaller grid cell (1.6 km2) within the larger marine zone forecast. Both marine zone and point forecasts are presented in text format and are generally considered a trusted and reliable source of forecast information, but at a very low resolution. Fishermen supplement these forecasts using other sources available online through commercial websites.
Research participants cited 4 days (96 h) as a typical trip length and planning time frame, which partly reflects the maximum holding time for common fisheries and is within the length of the NWS marine forecast. Although research participants typically have the most confidence in the 24-h forecast with less confidence after that, 4 days (96 h) may be an appropriate lead-time goal for regional ocean forecasts that would provide benefits to the Oregon commercial fishing fleet in terms of improved planning and thus improved safety and efficiency.
Accessing Forecasts
This study indicates that active, full-time commercial fishermen begin the process of planning for future trips by monitoring buoy data and the NWS weather forecasts using computers or smartphones to get a sense of what is coming. During this onshore planning phase, they are accessing ocean and weather forecasts from a variety of sources, comparing them to each other and to real-time information from buoys, and are monitoring the trends over time in a process that is typical of the modern, nonlinear, and multimodal communication environment described in previous research (Gladwin et al., 2007; Morss et al., 2017; Neeley, 2014).
When at sea, research participants described how they make decisions about when to stop fishing or whether to move to different locations in space by accessing information about incoming weather. In the not-so-distant past, this information was accessed through the NOAA NWS very high–frequency (VHF) weather radio station that plays on a continuous loop; however, the process has changed in recent years with advances in technology. The current process involves accessing weather and ocean forecast websites through smartphones or computers on board when working close to shore:
Rather than having to sit and wait to hear it over the VHF, being able to go online and switch from one page to the next and look at everybody’s interpretation of what the ocean is doing is a lot easier. It’s a lot easier to process it that way.
The VHF radio is still an important tool that the fishermen rely on, particularly when they are out of cellular range, which varies by carrier. One participant described getting cellular service out to Stonewall Banks, an important local bathymetric feature and location of a National Data Buoy Center buoy approximately 20 nautical miles from shore (Figure 1), while another participant described getting service 50 nautical miles offshore. When out of cellular and VHF radio range, some fishermen have satellite phones, but several research participants noted that it was prohibitively expensive for many. A common way to overcome this lack in data access is by fishing in groups where vessels with satellite phones or extended coverage maintain communication over the radio with smaller vessels nearby. Research participants described a process of continually checking the weather and adjusting the plan accordingly, as described in the following quote that considers time, space, and accuracy of forecasts:
The long-range forecast is always changing. It’s more stable in the summer. You look at the daily and then you’re looking at the next day because you’ve already set a plan for the day because yesterday’s prediction for today is going to be pretty accurate. You’re planning a day ahead if you’re more than a day offshore. And then you’re looking at the 3-to 5-day, and then you’re looking at where you’re at and where you going to go.
Ocean Hazards
Planning for and coping with ocean hazards is an integral part of commercial fishing. Research participants tended to differentiate between hazards at the bar and at sea and often described the cumulative impact of wind, waves, and current acting together or in opposition at different times and for different durations. Large swell waves alone may not be hazardous until a strong wind creates wind waves on top of the swell waves that have the potential to break at sea, sometimes referred to as “blowing the tops off.” Currents and random sea breaks were most often cited as individual hazards at sea. Opposing forces happen at the bar with an outgoing tide running into incoming swell or at sea with tidal and ocean currents running into the wind. Opposing forces create chaotic surface conditions that were variously described as having a “vertical affect,” the ocean “getting confused,” or feeling “like a washing machine.” Opposing forces can also happen on a large scale at certain times of year:
A lot of times what will create a super hazardous condition is a northwest flow running into a strong front coming in from the south. That can be hideous for the first few hours. They’re just colliding into each other. The ocean gets really chaotic and a lot of times it’s pretty nasty until a storm front really takes control of the ocean and it gets the current and everything going in the same direction.
Research participants described how weather and ocean hazards varied depending on the time of year. Winter hazards include large swell waves and storms from across the Pacific Ocean that contribute to dangerous bar crossings or hazardous nearshore conditions that coincide with downwelling season and the beginning of the nearshore Dungeness crab fishery. Summer hazards are caused by strong, continuous winds and currents from the northwest that create uncomfort able working conditions at sea during upwelling season, especially south of Cape Blanco (Figure 1). Wind was recognized as the genesis for most weather and ocean conditions (with tides as an exception), and swell was often related to fetch length, either from across the Pacific in the winter or from the north during the summer:
Big, building seas—there’s a lot of fetch to it because it’s built over a long ocean. Understanding that it’s blowing in northern Washington all the way down the coast of northern Oregon, all coming from exactly the same direction. Its accelerating as it goes down the coast as the land lines up. It’s not a good ocean. Brings the current with it; lots of current.
The nature of how cumulative and opposing forces change over time, both at sea and when crossing the bar, described by research participants suggests the value of integrating multiple ocean condition forecast variables into one interface. This finding is consistent with results from the cooperative design of Seacast (Duncan, 2014).
Contextual Factors: The High-Stakes Dungeness Crab Fishery
The Dungeness crab fishery is an excellent example of how context impacts planning, decision making, and access to forecasts. Participants described how most commercial fishermen in Oregon make a significant portion of their annual income in the first 4 weeks of Dungeness crab season when winter storms create hazardous nearshore conditions. If an operator misses time during the opening weeks of crab season, they will not be able to catch up throughout the year. It is a time when the most is at stake, financially and safety-wise. Many stories of close calls and great loss coincided with the start of the Dungeness crab season in late December and January, when large swell waves and high winds from winter storms create hazardous conditions at the bar and at sea. Research participants described times when they were stuck at sea due to bar closures and had to head offshore or to the north to avoid storms.
Forecasted current speeds and direction are especially useful for crab and other fisheries that deploy pots or other gear, because pots cannot be retrieved when the current speed is too high and pots must be deployed in a certain direction in relation to the current to avoid wasting valuable time:
When running different gear, its huge to know where the current is and how it’s running so you don’t waste all that time back and forth. With crab gear you have to go with the current. You have to run your gear a certain direction. Otherwise you run it backwards and it doesn’t work. With salmon fishing too, you want to know where the current is because of the way gear hangs in the water… Sometimes you only have a 12-hour window. You want to be as efficient as you can be in that amount of time because there could be another storm behind you
Commercial fishermen are typically within cellular range during the nearshore Dungeness crab fishery and check the forecasts often:
I don’t even want to know how many times I look at the weather during the winter time, fishing crabs. It has me going, “Well, we can do this, and we can do that if the weather’s going to be like this.” I watch it pretty often.
This example shows how fishery, socioeconomic considerations, time of year, and hazards all create the context in which decisions are made and how forecasts are accessed. In the summer, different fisheries move fishermen offshore out of cellular range where they use other gear types and face different physical hazards. The changes made between winter and summer operations reflect how contextual factors influence access to information, interpretations of risk, and capacities to take action (Morss et al., 2017).
Table 2 provides a summary of typical uses of ocean forecasts that were described by the Oregon commercial fishing community, with an indication of when the forecast is accessed and the decision is made, and a reference to the scale of the decision in terms of space and time.
TABLE 2.
Types of decisions informed by ocean condition forecasts that were described by research participants.
| Planning | Type of Decision | Scale |
|---|---|---|
| Pretrip | When to depart (day) | Time |
| Duration of trip (hours to days) | Time | |
| Directly before and during trip | When to cross the bar (hour) | Time |
| Where to fish | Space | |
| How to lay gear—often based on current | Space | |
Choosing routes
|
Space and time | |
| When to stop fishing | Time | |
| Longer term | Planning the next trip | Time |
List is not exhaustive.
The goal of Table 2 is to inform ocean forecast providers about some of the ways ocean condition forecasts are used by the Oregon commercial fishing community. It is essential to understand that fishermen consider other drivers beyond ocean conditions. For example, the decision to stop fishing also depends on economic factors and how successful fishermen have been at meeting their catch goals; the decision of whether to move offshore to avoid a storm or “jog” into a storm also depends on vessel size, risk tolerance of the vessel operator, and how much catch is on board. There was overall agreement that the NWS marine forecast is used by all fishermen at all stages of planning through web interfaces and VHF radio and that all ocean variables are considered when crossing the bar. For more information regarding other sources of ocean information used by commercial fishermen, see Duncan (2014).
Relationship With Uncertainty
Commercial fishermen depend on weather and ocean condition forecasts for planning yet perceive the forecasts themselves to be another source of uncertainty in their decision-making process. The NWS marine forecasts of wind and wave conditions were consistently cited by all participants as the first source that they check. These are generally “pretty accurate” and have improved over time; however, there was overall agreement that forecasts are imperfect and will never be good enough to be the only source of information.
I’d be a fool to be too confident. We’re responsible for our own observations. And even good in this age of abundant information but imperfect forecasting, there’s a place for our own intuitive interpretation for what’s going on around us. We’ve got to keep using our senses, regardless of how good modeling is.
Research participants reported having more confidence in forecasts the longer they have used them and that they combine forecasts from different sources based on the kind of information they are looking for. Participants also reported a process of comparing multiple forecasts of the same variable to see how well they agree.
When it’s [marginal conditions] you’re going to pay a lot more attention to all of the forecasts and get as much information as you can. If everyone is saying the same thing, then you have a little bit more confidence in it.
All participants recounted experiences when forecasts did not align with what they were experiencing that included both higher and lower wind speeds, currents moving in the opposite direction, and unforecasted gales or southerlies. Fishermen cope with sudden and unexpected changes in weather in real time and also by monitoring updates to NWS marine forecasts while at sea to revise their plans accordingly. Underprediction of wind speeds and wave heights results in increased hazards to a vessel, while overpredicted wind speeds and wave heights result in missed opportunities to fish and frustration for the operator and crew. Despite frustration with inaccurate forecasts, most participants expressed gratitude for all sources of information and recognized that the nature of prediction is challenging:
[Forecasters] are doing the best they can but it’s difficult to predict everything in the environment. There are so many forces at play…. There are things that are really a mystery to all of us. I don’t think we can understand every single thing.
A common perception within the fleet is that NWS forecasters overpredict hazardous conditions at times as a means of discouraging the decision to go to sea, which adds another layer of uncertainty for the fishermen about the objectivity of the forecasts and whether they should trust them. Taken together, these findings agree with a 2012 survey of Pacific Northwest boaters that suggests that, like the recreational boaters surveyed, commercial fishermen are able to correctly identify overforecasting bias and to anticipate the inherent uncertainty in determin istic forecasts, which factors into their decision-making process (Savelli & Joslyn, 2012).
Real-time information from the buoys is valued and trusted more than forecasts.
The primary forecast is the NOAA websites and the buoys that are out there that give us wave height and update every hour. If we’re sitting here deciding whether to cross the bar, that’s going to be more important than anything the forecast says. It’s what it’s actually doing.
Fishermen monitor buoys offshore, to the north, and to the south to get a sense of how weather and swell height will change in the coming hours. Real-time information is also used prior to fishing trips as a way for fishermen to assess the level of uncertainty of the forecasts for themselves by comparing forecasts with buoys to see how well they agree.
So, in the next couple of weeks I’ll be looking at the forecast religiously. I’ll look at the forecast and then I’ll look at the Stonewall bank buoy and see how the swell height, the wind, and the forecast actually matches up with what’s happening out there. Then I can kind of get a picture as to how accurate it is, and then when it comes time to go I feel I have better information to make my decision on.
Combining forecasts and real-time information to assess the trend in forecast accuracy was widely reported by research participants. Physical observations of the environment are another type of real-time information that was commonly valued—and trusted, over models. Deciding when to cross the bar is one of the most important decisions made by a commercial fisherman in Oregon due to the number of conditions that they have to consider and how the ocean conditions have to align. The following passage from a participant describes how information from forecasts is evaluated against what they are seeing with their own eyes and with help from the Coast Guard:
And one variable is the [wave] series. It can be very different than the average swell height sometimes. A lot of times if we’re concerned about that; well, there’s really no substitute for sitting there watching and the Coast Guard is good about helping us with that too.
These results suggest that the commercial fishing community is comfortable with and expect uncertainty in ocean and weather conditions and forecasts and have developed their own approaches to manage these uncertainties.
Conclusion
This case study documents the role of ocean condition forecasts in decision making by characterizing the mental model of risk and conceptualization of uncertainty for an important subgroup of ocean forecast end users: the commercial fishing community in Oregon. These findings expand the previous limited understanding of go/no-go decisions (Kite-Powell et al., 2008) and are regionally specific to Oregon. Results of this study can help inform forecasters interested in improving the value of weather and ocean forecasts to commercial fishermen that can be extended to other potential end users.
With regard to RQ1, characterizations of the mental model of risk and uncertainty have provided insights to the risk-based decision-making context of the commercial fishing community that can contribute to more useful data products. Our results agree with those from previous research regarding risk perception in commercial fishing in places other than Oregon (McDonald & Kucera, 2007; Thorvaldsen, 2013): commercial fishermen along the central Oregon coast balance the desire to maintain safety with the need to make a living. In the context of this balance, they emphasize the importance of vessel maintenance and experience in managing risk, while perceiving weather and ocean conditions as an occupational hazard to be worked around using all available information. Commercial fishermen accept and celebrate a certain amount of risk as part of the profession and value their ability to combine ocean and weather forecasts with physical observations and information from each other to make decisions.
These findings are supported by other research describing how individual risk tolerance can vary widely between high-stakes end users (Savelli & Joslyn, 2012), who often employ complex processes to make decisions that are influenced by many interconnected factors rather than relying solely on scientific and technical information (Morss et al., 2017). The nature of hazards as composed of cumulative and opposing forces that change over time (both at sea and when crossing the bar) suggests the value of integrating multiple ocean condition forecast variables (and real-time observations) into one interface (Duncan, 2014).
With regard to RQ2, characterizing the mental model of risk and uncertainty has provided insights into how commercial fishermen relate to uncertainty beyond forecasts, which can direct uncertainty metrics and the strategic use of resources for the data provider in providing value-added forecasts. Because fishermen use real-time data to evaluate the trend of forecast accuracy over time, root-mean-square error (RMSE) estimates over the course of the past week or month could be a useful way to quantify and visually represent uncertainty metrics for deterministic models (Mauch, 2017). However, this has not been tested, and it is essential to empirically evaluate people’s interpretations of uncertainty information prior to implementation of new metrics and visualizations (Demuth et al., 2012, 2013). Interestingly, this study found there are times when the uncertainty of forecasted conditions becomes irrelevant to decision making, particularly when fishermen cannot afford to lose time at sea. The evidence presented here makes the case that real-time data, in the form of buoys, physical observations, and communication between vessels over the radio, will likely always supplant information from forecasts and any associated uncertainty metrics for Oregon commercial fishermen.
Based on the findings that fishermen gain more confidence in forecasts the longer they have used them and have their own trusted processes in place to assess model uncertainty, expanding efforts toward making the forecasts more useful and accessible through direct community engagement should be a top priority for the investment of time and resources. This is not to say that uncertainty quantification is not of interest to the commercial fishing community. Well-calibrated metrics that report uncertainty in forecasts would likely be useful to commercial fishermen in narrowing the expected range of values (Savelli & Joslyn, 2012), as long as they align with a fisherman’s experience-based, conceptual understanding of uncertainty and the way that it is managed and integrated into daily work (Thorvaldsen, 2013). Key here is that the lack of quantified uncertainty metrics should not prevent potentially useful forecast information from being made available due to fear of getting it wrong, as imperfection in forecasts is already expected and managed by these experienced end users.
Previous research on the topic of usability of science has found that, for scientific information to be usable, decision makers must perceive it to be credible, salient, and legitimate (Buizer et al., 2016; Cash et al., 2003, 2006; Kirchhoff et al., 2013). The usefulness, or salience, of forecasts could be improved through efforts at creating better interfaces that align with decision making (i.e., integrating multiple ocean variable forecasts and real-time data), investing in mobile apps to enhance accessibility through smart-phones, and increasing regional ocean forecast lead times to 96 h (4 days) despite the known uncertainties. Direct, iterative engagement can enhance trust and perceived legitimacy and credibility of an institution and its data products from a sense of inclusion in the process and open exchange to inform end users of the quality and limitations of the science (Cash et al., 2003; Kirchhoff et al., 2013). End-user engagement is an iterative, two-way process to ensure that data products are relevant and accessible by learning about the decision-making needs of the end users while informing end users about the capabilities of ocean data providers (Price & Rosenfeld, 2012).
Finally, this research suggests that continuing to improve model accuracy, particularly at locations and times that are of interest to the fishermen, would be valuable to the commercial fishing fleet. Models are often improved through adding sensors to the environment (i.e., buoys or high-frequency [HF] radar) that provide more observations (for model evaluation and to improve model initial conditions); however, sensors are costly to deploy and maintain. Another way to improve model accuracy at time and spatial scales relevant to the fishermen that is potentially much more cost-effective is to recruit fishermen to collect observations as they traverse the marine environment. This form of cooperative research could strengthen relationships between the commercial fishing and data provider communities, which can also serve to inform uncertainty metrics. Potential benefits to data providers working directly with fishermen extend beyond supporting their own mission goals and objectives to building long-term economic, social, and human capital in the region (Table 3).
TABLE 3.
List of potential benefits to data providers generated from this research.
| Potential Benefits to Data Providers in Working Directly With Data Users (fishermen) |
|---|
| 1. Better understand users |
| 2. Cost savings in observations |
| 3. Gain valuable partners in marine operations |
| 4. Learn from local and experiential knowledge |
| 5. Positive impact on local communities |
In addition to cost savings in observations, working directly with fishermen could help data providers better understand their needs, thus creating more useful data products with less perceived risk regarding the product and the user. Furthermore, commercial fishermen are adaptive, observant, and technologically savvy. These traits make them valuable partners in marine space and for carrying out any type of marine operations. Partnering with fishermen to alleviate some of the economic and safety risks that they face could also provide direct benefits to the onshore industry and families that depend on them. Finally, fishermen have extensive local experiential and ecological knowledge and are constantly discussing weather and ocean conditions. Fishermen regularly observe and try to make sense of patterns in nature, and data providers could potentially learn a great deal from their observations that could drive future research. While user engagement is known to be costly and time consuming, it is critical to the successful creation of useful data products that neither party could create on their own (Duncan, 2014; Price & Rosenfeld, 2012).
Future work should be aimed at developing these relationships and processes through pilot studies, empirically testing what kinds of uncertainty metrics would be useful to fishermen, and expanding to other regions and end users.
Acknowledgments
This study was funded by Oregon Sea Grant under Award NA14OAR4170064 (Project #R/PSS-02-Strub) from the National Oceanic and Atmospheric Administration’s National Sea Grant College Program, U.S. Department of Commerce, and by appropriations made by the Oregon State Legislature. The statements, findings, conclusions, and recommendations are those of the authors and do not necessarily reflect the views of these funders. Additional support was provided from the Oregon State University National Science Foundation Research Traineeship: Risk and Uncertainty Quantification in Marine Science and from Oregon Space Grant. Many thanks to the commercial fishing community of the central Oregon coast who participated in this study.
Contributor Information
Jessica Kuonen, College of Earth, Ocean, and Atmospheric Sciences, Oregon State University.
Flaxen Conway, College of Liberal Arts, Oregon State University and Oregon Sea Grant.
Ted Strub, College of Earth, Ocean, and Atmospheric Sciences, Oregon State University.
References
- Abel N, Ross H, & Walker P 1998. Mental models in rangeland research, communication and management. Rangeland J. 20(1): 77–91. 10.1071/RJ9980077. [DOI] [Google Scholar]
- Auerbach C, & Silverstein LB 2003. An Introduction to Coding and Analysis: Qualitative Data. New York, NY: New York University Press; 202 pp. [Google Scholar]
- Bernard HR, & Ryan GW 2010. Analyzing Qualitative Data: Systematic Approaches. Thousand Oaks, CA: Sage Publications; 451 pp. [Google Scholar]
- Buizer J, Jacobs K, & Cash D 2016. Making short-term climate forecasts useful: Linking science and action. P Natl Acad Sci USA. 113(17):4597–602. 10.1073/pnas.0900518107. [DOI] [PMC free article] [PubMed] [Google Scholar]
- Cash DW, Borck JC, & Patt AG 2006. Countering the loading-dock approach to linking science and decision making: Comparative analysis of El Niño/Southern Oscillation (ENSO) forecasting systems. Sci Technol Hum Val. 31(4):465–94. 10.1177/0162243906287547. [DOI] [Google Scholar]
- Cash DW, Clark WC, Alcock F, Dickson NM, Eckley N, Guston DH, Mitchell RB 2003. Knowledge systems for sustainable development. P Natl Acad Sci USA. 100(14):8086–91. 10.1073/pnas.1231332100. [DOI] [PMC free article] [PubMed] [Google Scholar]
- CDC (Centers for Disease Control and Prevention). 2010. Commercial fishing deaths—United States, 2000–2009. MMWR-Morbid Mortal W. 59(27):842–5. Available at: https://www.cdc.gov/mmwr/preview/mmwrhtml/mm5927a2.htm. [PubMed] [Google Scholar]
- Cone J, & Winters K 2011. Mental Models Interviewing for More-Effective Communication: A Primer. Corvallis, OR: Oregon Sea Grant. [Google Scholar]
- Craik KJ 1943. The Nature of Explanation. Cambridge, UK: Cambridge University Press; 136 pp. [Google Scholar]
- Creswell JW, & Creswell JD 2017. Research Design: Qualitative, Quantitative, and Mixed Methods Approaches. Thousand Oaks, CA: Sage; 273 pp. [Google Scholar]
- Demuth JL, Morss RE, Lazo JK, & Hilderbrand DC 2013. Improving effectiveness of weather risk communication on the NWS point-and-click web page. Weather Forecast. 28(3):711–26. 10.1175/WAF-D-12-00118.1. [DOI] [Google Scholar]
- Demuth JL, Morss RE, Morrow BH, Lazo JK 2012. Creation and communication of hurricane risk information. B Am Meteorol Soc. 93(8):1133–45. 10.1175/BAMS-D-11-00150.1. [DOI] [Google Scholar]
- Dieckmann NF, Peters E, & Gregory R 2015. At home on the range? Lay interpretations of numerical uncertainty ranges. Risk Anal. 35(7):1281–95. 10.1111/risa.12358. [DOI] [PubMed] [Google Scholar]
- Duncan C 2014. Cooperative product development between researchers and commercial fishermen to find applications for ocean condition forecasting technology Unpublished master’s thesis. Oregon State University; 193 pp. [Google Scholar]
- Gladwin H, Lazo JK, Morrow BH, Peacock WG, & Willoughby HE 2007. Social science research needs for the hurricane forecast and warning system. Nat Hazards Rev. 8(3):87–95. 10.1061/(ASCE)1527-6988(2007)8:3(87). [DOI] [Google Scholar]
- IFSOO (Integrated Framework for Sustained Ocean Observing) Task Team. 2012. A framework for ocean observing (no. IOC/INF-1284) UNESCO; Available at: http://www.eoos-ocean.eu/download/GOOSFrameworkOceanObserving.pdf (accessed January 23, 2018). [Google Scholar]
- JCGM (Joint Committee for Guides in Metrology). 2008. Evaluation of measurement data—Guide for the expression of uncertainty in measurement. Available at: https://ncc.nesdis.noaa.gov/documents/documentation/JCGM_100_2008_E.pdf (accessed November 23, 2017).
- Jones N, Ross H, Lynam T, Perez P, & Leitch A 2011. Mental models: An interdisciplinary synthesis of theory and methods. Ecol Soc. 16(1):46 10.5751/ES-03802-160146. [DOI] [Google Scholar]
- Joslyn S, & LeClerc J 2013. Decisions with uncertainty: The glass half full. Curr Dir Psychol Sci. 22(4):308–15. 10.1177/0963721413481473. [DOI] [Google Scholar]
- Joslyn S, & Savelli S 2010. Communicating forecast uncertainty: Public perception of weather forecast uncertainty. Meteorol Appl. 17(2):180–95. 10.1002/met.190. [DOI] [Google Scholar]
- Kaplan S, & Kaplan R 1982. Cognition and Environment: Functioning in an Uncertain World. Ann Arbor, MI: Praeger; 287 pp. [Google Scholar]
- Kirchhoff CJ, Lemos MC, & Dessai S 2013. Actionable knowledge for environmental decision making: Broadening the usability of climate science. Annu Rev Env Resour. 38:393–414. 10.1146/annurev-environ-022112-112828. [DOI] [Google Scholar]
- Kite-Powell H, Colgan C, & Weiher R 2008. Estimating the economic benefits of regional ocean observing systems. Coast Manage. 36(2):125–45. 10.1080/08920750701868002. [DOI] [Google Scholar]
- Klayman J, & Ha Y-W 1989. Hypothesis testing in rule discovery: Strategy, structure, and content. J Exp Psychol Learn. 15(4): 596–604. 10.1037/0278-7393.15.4.596. [DOI] [Google Scholar]
- Kourafalou VH, De Mey P, Le Hénaff M, Charria G, Edwards CA, He R, Zhu X 2015. Coastal ocean forecasting: System integration and evaluation. J Oper Oceanogr. 8(suppl 1):s127–46. [Google Scholar]
- Mauch M 2017. Coastal ocean variability inferred from high resolution models: Two case studies (Unpublished master’s thesis). Oregon State University; 74 pp. [Google Scholar]
- Maxwell JA 2013. Qualitative Research Design: An Interactive Approach. Thousand Oaks, CA: Sage; 232 pp. [Google Scholar]
- McDonald MA, & Kucera KL 2007. Understanding non-industrialized workers’ approaches to safety: How do commercial fishermen “stay safe”? J Safety Res. 38(3): 289–97. 10.1016/j.jsr.2006.10.009. [DOI] [PubMed] [Google Scholar]
- Morgan MG, Atman CJ, & Bostrom A 2002. Risk Communication: A Mental Models Approach. New York, NY: Cambridge University Press; 351 pp. [Google Scholar]
- Morss RE, Demuth JL, & Lazo JK 2008. Communicating uncertainty in weather forecasts: A survey of the U.S. public. Weather Forecast. 23(5):974–91. 10.1175/2008WAF2007088.1. [DOI] [Google Scholar]
- Morss RE, Demuth JL, Lazrus H, Palen L, Barton CM, Davis CA, Watts J 2017. Hazardous weather prediction and communication in the modern information environment. B Am Meteorol Soc. 98(12): 2653–74. 10.1175/BAMSD-16-0058.1. [DOI] [Google Scholar]
- NAS (National Academies of Sciences). 2017a. Integrating Social and Behavioral Sciences Within the Weather Enterprise. Washington, DC: National Academies Press; 198 pp. [Google Scholar]
- NAS (National Academies of Sciences). 2017b. Sustaining Ocean Observations to Understand Future Changes in Earth’s Climate. Washington, DC: National Academies Press; 150 pp. [Google Scholar]
- NIOSH (National Institute for Occupational Safety and Health). 2017. Commercial Fishing Fatality Summary: West Coast Region (2010–2014). Report No. 2017–172. Anchorage, AK: Author; pp. 1–6. [Google Scholar]
- National Oceanic and Atmospheric Administration (NOAA). 2010. Coastal/Great Lakes Forecasts by Zone - West - Portland, OR. Available at: http://www.nws.noaa.gov/os/marine/zone/west/pqrmz.htm (accessed 22 May 2018).
- NRC (National Research Council). 2006. Completing the Forecast: Characterizing and Communicating Uncertainty for Better Decisions Using Weather and Climate Forecasts. Washington, DC: National Academies Press; 124 pp. [Google Scholar]
- Neeley L 2014. Risk communication in social media In Effective Risk Communication (pp. 143–164). New York, NY: Routledge; 360 pp. [Google Scholar]
- ODFW (Oregon Department of Fish and Wildlife). 2017. Oregon’s Ocean Commercial Fisheries. Available at: http://www.dfw.state.or.us/mrp/docs/Backgrounder_Comm_Fishing.pdf (accessed September 20, 2017).
- Parris AS, Garfin GM, Dow K, Meyer R, & Close SL 2016. Understanding context and risk In Climate in Context (pp. 1–2). West Sussex, UK: Wiley-Blackwell; 274 pp. 10.1002/9781118474785.part1. [DOI] [Google Scholar]
- Price H, & Rosenfeld L 2012. Synthesis of Regional IOOS Build-out Plans for the Next Decade. Silver Spring, MD: Integrated Ocean Observing System Association; Available at: http://www.ioosassociation.org/sites/nfra/files/documents/ioos_documents/regional/BOP%20Synthesis%20Final.pdf. [Google Scholar]
- Ropeik D 2012. The perception gap: Recognizing and managing the risks that arise when we get risk wrong. Food Chem Toxicol. 50(5):1222–5. 10.1016/j.fct.2012.02.015. [DOI] [PubMed] [Google Scholar]
- Roux D, Rogers K, Biggs H, Ashton P, & Sergeant A 2006. Bridging the science–management divide: Moving from unidirectional knowledge transfer to knowledge interfacing and sharing. Ecol Soc. 11(1). 10.5751/ES-01643-110104. [DOI] [Google Scholar]
- Savelli S, & Joslyn S 2012. Boater safety: Communicating weather forecast information to high-stakes end users. Weather, Climate, and Society. 4(1):7–19. 10.1175/WCAS-D-11-00025.1. [DOI] [Google Scholar]
- Siddorn JR, Good SA, Harris CM, Lewis HW, Maksymczuk J, Martin MJ, & Saulter A 2016. Research priorities in support of ocean monitoring and forecasting at the Met Office. Ocean Sci. 12(1): 217–31. 10.5194/os-12-217-2016. [DOI] [Google Scholar]
- Sivle AD, Kolstø SD, Kirkeby Hansen PJ, & Kristiansen J 2014. How do laypeople evaluate the degree of certainty in a weather report? A case study of the use of the web service yr.no. Weather Clim Soc 6(3):399–412. 10.1175/WCAS-D-12-00054.1. [DOI] [Google Scholar]
- Sivle AD, & Kolstø SD 2016. Use of online weather information in everyday decision-making by laypeople and implications for communication of weather information. Meteorol Appl. 23(4):650–62. 10.1002/met.1588. [DOI] [Google Scholar]
- Slovic P 1987. Perception of risk. Science 236(4799):280–5. 10.1126/science.3563507. [DOI] [PubMed] [Google Scholar]
- Slovic P 2016. Understanding perceived risk: 1978–2015. Environ Sci Policy Sust Dev. 58(1):25–9. 10.1080/00139157.2016.1112169. [DOI] [Google Scholar]
- Smithson M 2008. The many faces and masks of uncertainty In Uncertainty and Risk: Multidisciplinary Perspectives (pp. 13–25). London, UK: Routledge; 382 pp. [Google Scholar]
- Thorvaldsen T 2013. The importance of common sense: How Norwegian coastal fishermen deal with occupational risk. Mar Policy. 42:85–90. 10.1016/j.marpol.2013.02.007. [DOI] [Google Scholar]
- U.S. IOOS Office. 2010. U.S. Integrated Ocean Observing System: A Blueprint for Full Capability, Version 1.0 Silver Spring, MD: Author. [Google Scholar]
- Wilkin J, Rosenfeld L, Allen A, Baltes R, Baptista A, He R, Smith J 2017. Advancing coastal ocean modelling, analysis, and prediction for the US Integrated Ocean Observing System. J Oper Oceanogr. 10(2): 115–26. 10.1080/1755876X.2017.1322026. [DOI] [Google Scholar]
- Zabini F 2016. Mobile weather apps or the illusion of certainty? Meteorol Appl. 23(4): 663–70. 10.1002/met.1589. [DOI] [Google Scholar]