Abstract
Objective
To test the hypothesis that individual differences in episodic memory and verbal fluency in cognitively normal middle-aged adults will predict progression to amnestic mild cognitive impairment (MCI) after 6 years.
Method
The cohort analyzed included 842 male twins who were cognitively normal at baseline (mean 56 years) and completed measures of episodic memory and verbal fluency at baseline and again 6 years later (mean 62 years).
Results
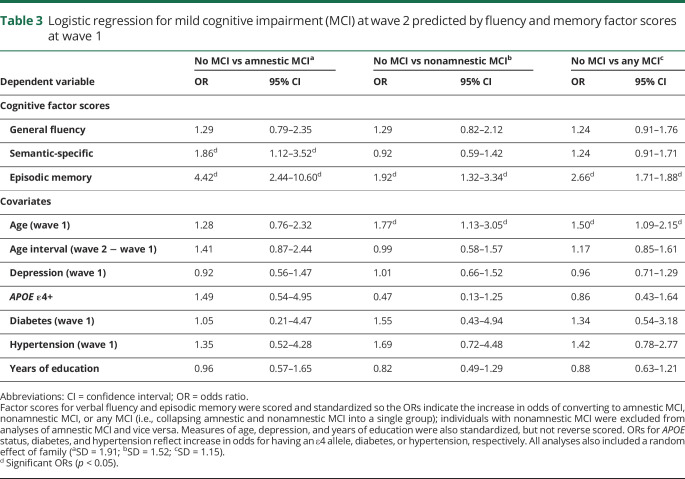
Poor episodic memory predicted progression to both amnestic MCI (odds ratio [OR], 4.42; 95% confidence interval [CI], 2.44–10.60) and nonamnestic MCI (OR, 1.92; 95% CI, 1.32–3.44). Poor semantic verbal fluency also independently predicted progression to amnestic MCI (OR, 1.86; 95% CI, 1.12–3.52). In the full sample, a semantic-specific fluency latent variable at wave 1 (which controls for letter fluency) predicted change in episodic memory at wave 2 (β = 0.13), but not vice versa (β = 0.04). Associations between episodic memory and verbal fluency factors were primarily explained by genetic, rather than environmental, correlations.
Conclusions
Among individuals who were cognitively normal at wave 1, episodic memory moderately to strongly predicted progression to MCI at average age 62, emphasizing the fact that there is still meaningful variability even among cognitively normal individuals. Episodic memory, which is typically a primary focus for Alzheimer disease (AD) risk, declined earlier and more quickly than fluency. However, semantic fluency at average age 56 predicted 6-year change in memory as well as progression to amnestic MCI even after accounting for baseline memory performance. These findings emphasize the utility of memory and fluency measures in early identification of AD risk.
Although the A/T/N framework (amyloid/tau/neurodegeneration) is agnostic regarding the sequence of biomarker progression, it is generally assumed that biomarker positivity is present before cognitive manifestations.1 β-Amyloid and tau biomarkers indicate increased risk because they reflect underlying disease pathophysiology, but it does not necessarily follow that—with currently available detection techniques—these biomarkers will be the earliest predictors of progression to Alzheimer disease (AD). In older adults without dementia, including those who already have mild cognitive impairment (MCI), cognitive markers—particularly episodic memory—do as well as or better than AD biomarkers.2–5 Semantic fluency impairment has also been associated with MCI and progression to AD in older adults.6–12 However, because the AD process begins decades before dementia onset, researchers have recommended greater emphasis on earlier identification of risk.13,14
With that in mind, there is substantial variability in cognitive function even in cognitively normal (CN) middle-aged adults. To address the need for early identification, we examined the ability of cognitive measures to predict progression to MCI in a 6-year follow-up of CN, community-dwelling men in their 50s who were rigorously defined as CN at baseline. We addressed the following questions: (1) Does episodic memory predict progression to MCI? (2) Does semantic fluency predict progression to MCI after accounting for episodic memory? (3) Does episodic memory predict change in semantic fluency or vice versa? (4) To what extent do shared genetic influences underlie associations between semantic fluency and episodic memory?
Method
Participants
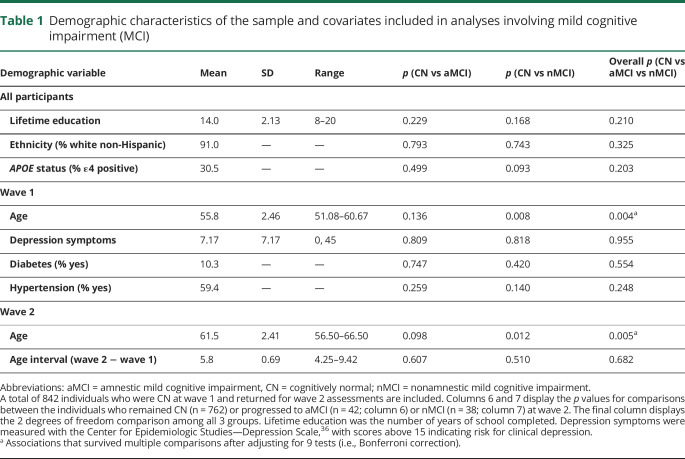
The primary analyses involving MCI progression (questions 1 and 2) were based on 842 individuals from the longitudinal Vietnam Era Twin Study of Aging (VETSA) project who were CN at wave 1 and returned to complete the wave 2 assessment approximately 6 years later. All participants were recruited randomly from a pool of 3,322 Vietnam Era Twin Registry twin pairs from a previous study that had no inclusion/exclusion criteria other than being in the Registry.15 All served in the US military at some time between 1965 and 1975; nearly 80% did not serve in combat or in Vietnam.16,17 Participants are generally representative of American men in their age group with respect to health and lifestyle characteristics.18 See table 1 for demographic characteristics of the subsample of 842 individuals, which includes the descriptive statistics for all covariates in the analyses involving MCI. The only inclusion criteria for wave 1 were that twins must be between ages 51 and 59 at the time of recruitment, and that both twins in a pair agreed to participate. All twins were invited to complete wave 2 regardless of participation of their co-twin.
Table 1.
Demographic characteristics of the sample and covariates included in analyses involving mild cognitive impairment (MCI)
There were 1,237 individuals who completed the protocol at wave 1. Of these, 107 (8.6%) were excluded from the analysis of progression to MCI because they had MCI at wave 1. This left 1,130 (91.4%) CN individuals, 906 (80.2%) of whom returned for wave 2. Of those 906, 64 were excluded for the following reasons: missing covariates (57); missing fluency data (1); MCI with language domain impairment (which includes fluency) at wave 2 (6). This left 842 (92.9% of 906 and 74.5% of the total CN individuals at wave 1) for the analyses of progression to MCI. See figure 1 for a flowchart describing this sample breakdown.
Figure 1. Flowchart of the sample for primary analysis of progression to mild cognitive impairment (MCI).
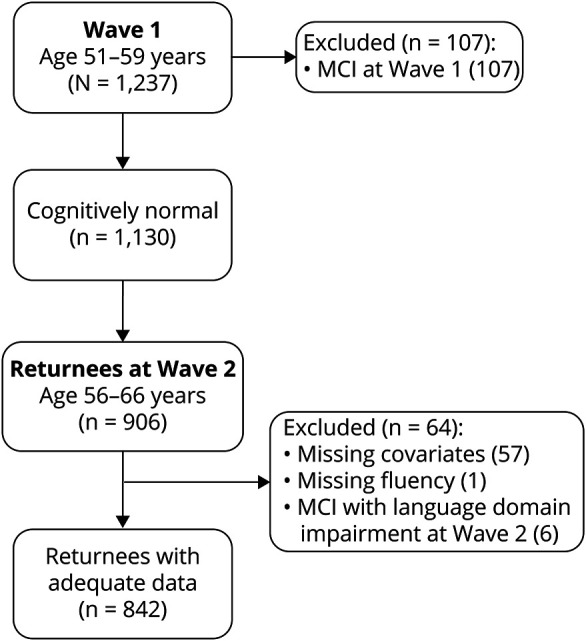
The black box indicates final sample of individuals who were cognitively normal at baseline, returned for wave 2, and had all data relevant for this analysis. Gray boxes indicate excluded subjects. Of the 57 subjects missing covariates, 47 were missing the age 20 general cognitive ability measure used in MCI diagnosis, 9 were missing APOE, and 1 was missing depression symptoms.
Additional analyses involving the full sample (questions 3 and 4) made use of data from all VETSA participants: 1,484 total individuals. At wave 2, participants included 1,257 individuals: 1,013 returnees, 191 attrition replacement subjects who were in the age range of returnees, and 53 attrition replacements who were in the age range of participants at wave 1. The final 53 attrition replacements were analyzed with the wave 1 subjects. Despite some missing data, all available participants were included because structural equation models (i.e., phenotypic cross-lagged and genetic twin models) use all available data. This provides more accurate and less biased estimates of variance, thus making for more accurate factor loadings and estimates of genetic/environmental influences at each age. Thus the final sample included 1,290 individuals at mean age 56 (367 monozygotic [MZ] twin pairs, 273 dizygotic [DZ] twin pairs, and 10 unpaired twins) and 1,204 individuals at mean age 62 (332 MZ twin pairs, 234 DZ twin pairs, and 72 unpaired twins).
Standard protocol approvals, registrations, and patient consents
All participants provided informed consent, and all procedures were approved by the institutional review boards of participating institutions.
Measures
Development of latent variable measures of episodic memory, verbal fluency, and other cognitive variables and MCI diagnoses has been reported in our earlier work.19–22 These measures are summarized briefly here. In addition, all cognitive measures at the second wave of testing were adjusted to account for the fact that many of the participants had encountered the tasks before.20 Although practice effects were small and often nonsignificant, it is important to correct for them as ignoring these small differences results in the underdiagnoses of MCI in this sample.20
Episodic memory
Memory was measured with the logical memory (LM) and visual reproductions (VR) subtests of the Wechsler Memory Scale III23 and the California Verbal Learning Test II (CVLT).24 The dependent measures were the LM and VR delayed recall scores and the CVLT long delay free recall score. These measures were combined to create a latent factor.
Verbal fluency
Fluency was measured with 6 verbal fluency subtests from the Delis-Kaplan Executive Function System.25 Participants performed the letter subtests (F, A, and S), followed by semantic subtests (animals, boys' names, and fruits/furniture). Dependent measures were the number of words generated in 60 seconds. We utilized a latent variable model of verbal fluency that highlights unique variance in semantic fluency.26 This model decomposes the variance in the 6 fluency subtests into 2 latent factors: a general fluency factor captures variance across letter and semantic subtests, and a semantic-specific factor captures the remaining variance shared among semantic subtests not captured by the general factor. To be comparable with the other measures, we used the number of words on fruits/furniture switching condition, ignoring switching ability. This was validated in the previous work,26 which also showed that removal of this subtest has little impact on the factor structure of verbal fluency. Performance on both factors was explained mostly by genetic influences at wave 1 and wave 2 and demonstrated strong phenotypic and genetic correlations over this 6-year interval.26
Mild cognitive impairment
MCI was diagnosed using the Jak-Bondi actuarial/neuropsychological approach.27–29 Impairment in a cognitive domain was defined as having at least 2 tests >1.5 SDs below the age- and education-adjusted normative means after accounting for premorbid cognitive ability by adjusting neuropsychological scores for performance on a test of general cognitive ability that was taken at a mean age of 20 years. The adjustment for age 20 cognitive ability ensures that the MCI diagnosis is capturing a decline in function rather than long-standing low ability. The validity of the VETSA MCI diagnoses is supported by previous studies27–29 and in the present sample by evidence of reduced hippocampal volume in those diagnosed with amnestic MCI.30 Higher AD polygenic risk scores were associated with significantly increased odds of MCI,19 indicating that our diagnosis is genetically related to AD.
Because we were interested in transition to MCI, analyses involving incident MCI at wave 2 only included individuals who were CN at wave 1 and had data for all covariates (figure 1). Of the 842 returnees meeting this criterion, 42 (5.0%) progressed to amnestic MCI, and 38 (4.5%) progressed to nonamnestic MCI. An additional 6 individuals who had MCI with language domain impairment (3 of whom were also amnestic) were assigned missing values for all analyses involving MCI. This was done to prevent biasing estimates of the association between verbal fluency and MCI because letter and semantic fluency comprised the language domain. However, odds ratios (ORs) were nearly identical if these individuals were all included.
Other cognitive measures (wave 1 only)
To examine how other cognitive abilities account for the overlap between episodic memory and semantic fluency, a latent factor for vocabulary was created using the vocabulary subtest of the Wechsler Abbreviated Scale of Intelligence (WASI)31 and the multiple-choice vocabulary subtest of the Armed Forces Qualification Test.32,33 Two executive function latent factors were included based on our previous work.34 The first factor (common executive function) captures common variance across 6 tasks assessing inhibition, shifting, and working memory.21 The second latent factor (working memory–specific) captures covariance among working memory tasks not already captured by the common factor.
Data analysis
Phenotypic analyses involving MCI were conducted with mixed effects logistic regression using the lme4 package in R version 3.3.1.35 The lme4 package uses list-wise deletion with missing observations, and reports profile-based 95% confidence intervals (95% CIs). In all models, pair ID was included as a random effect to account for the clustering of data within families. We also controlled for wave 1 age, diabetes, hypertension, depression symptoms (based on Center for Epidemiologic Studies–Depression scale),36 the time interval between wave 1 and wave 2, APOE status (ε4+ alleles vs ε4−), and years of education. Post hoc analyses indicated no evidence that prediction of later MCI differed in MZ vs DZ twins (i.e., no memory × zygosity or fluency × zygosity interactions), so these interaction terms were excluded in all models presented. Additional post hoc analyses revealed that the pattern of results was nearly identical without having controlled for any covariates.
Additional phenotypic regression and cross-lagged analyses in the full sample were conducted using Mplus Version 7.37 Genetic analyses were conducted using the structural equation modeling package OpenMx in R.38 Both programs account for missing observations using a full-information maximum likelihood approach. Model fit for these structural equation models was determined using χ2 tests, the root mean square error of approximation (RMSEA), and the comparative fit index (CFI). Good fitting models had χ2 values less than 2 times the degrees of freedom, RMSEA values <0.06, and CFI values >0.95.39 In addition, good fitting genetic models did not fit significantly worse than a full Cholesky decomposition of all measures, a common baseline model in twin studies. Significance of individual parameters was established with standard error–based (Mplus) or likelihood-based (OpenMx) 95% CI.
Genetically informed models were based on the standard assumptions in twin designs, which decompose variance in phenotype (and covariance among phenotypes) into 3 sets of influences: additive genetic influences (A), shared environmental influences (C), and nonshared environmental influences (E). Additive genetic influences are correlated at 1.0 in MZ twin pairs and 0.5 in DZ twin pairs because MZ twins share all their alleles identical by descent and DZ twins share, on average, 50% of their alleles identical by descent. Shared environmental influences (C), which are environmental influences that make twins in a pair more similar, are correlated at 1.0 in both MZ and DZ twins. Nonshared environmental influences (E), which are environmental influences that make twins in a pair dissimilar, are correlated at 0.0 in both MZ and DZ twin pairs, by definition. We also assume equal means and variances within pairs and across zygosity. These assumptions for univariate analyses apply to multivariate cases and to situations where phenotypic correlations between constructs are decomposed into their genetic (rgenetic) and nonshared environmental components (renvironmental). Shared environmental influences on verbal fluency factors, and their correlations with episodic memory, were not estimated based on our previous work showing no evidence for shared environment on verbal fluency.26
Data availability
VETSA data are publicly available, with restrictions. Information regarding data access can be found at our website: medschool.ucsd.edu/som/psychiatry/research/VETSA/Pages/default.aspx.
Results
Descriptive statistics
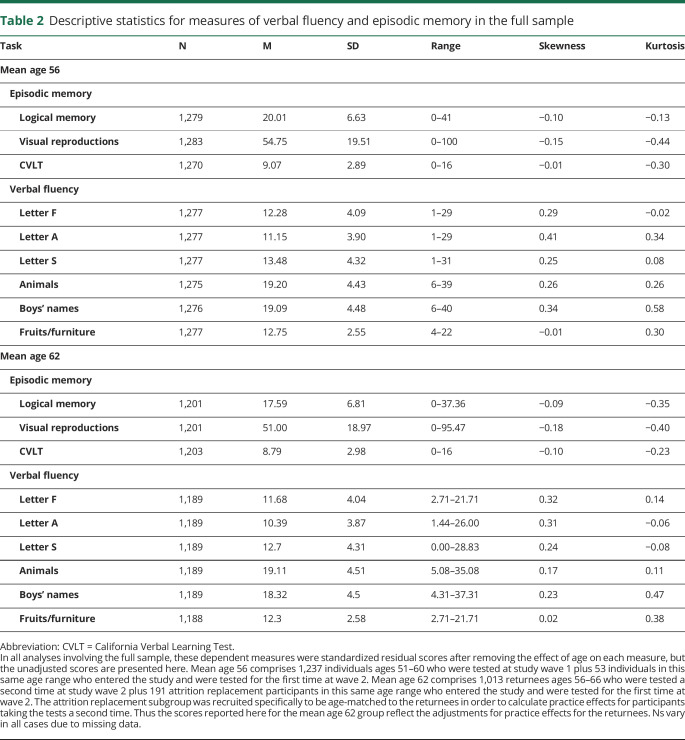
Demographic and clinical characteristics are displayed in table 1. There were no significant differences between CN and MCI groups in any of these characteristics, except that individuals who progressed to amnestic MCI were older than those who remained CN at both wave 1 and wave 2. Descriptive statistics for fluency and memory measures are displayed in table 2.
Table 2.
Descriptive statistics for measures of verbal fluency and episodic memory in the full sample
Predicting progression to MCI
Table 3 displays the longitudinal logistic regression analyses. Progression to amnestic MCI (table 3A) or nonamnestic MCI (table 3B) at wave 2 is predicted by general fluency, semantic-specific, and episodic memory factor scores at wave 1, as well as the covariates. Higher ORs indicate increased odds of progression to MCI (estimated for −1 SD decrease on the original factor score scale). Table 3C displays similar analyses of progression to any MCI (i.e., amnestic and nonamnestic MCI collapsed into a single group).
Table 3.
Logistic regression for mild cognitive impairment (MCI) at wave 2 predicted by fluency and memory factor scores at wave 1
Results indicated that episodic memory at wave 1 strongly predicted progression to amnestic MCI at wave 2, even when controlling for both verbal fluency factors (OR, 4.42; 95% CI, 2.44–10.60). Poor semantic-specific fluency was also associated with nearly double the odds of being diagnosed with amnestic MCI at wave 2 even when controlling for episodic memory (OR, 1.86; 95% CI, 1.12–3.52). Poor general fluency was not associated with increased odds of amnestic MCI (OR, 1.29; 95% CI, 0.79–2.35). Interestingly, poor episodic memory was also associated with progression to nonamnestic MCI (OR, 1.92; 95% CI, 1.21–3.34). Neither fluency factor predicted progression to nonamnestic MCI.
Longitudinal associations between episodic memory and verbal fluency
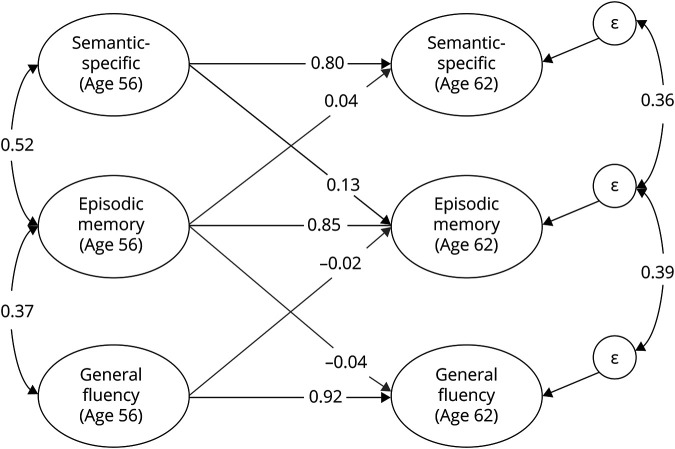
We next fit a phenotypic cross-lagged model using fluency and memory data from both waves in the full sample. As seen in figure 2, memory at mean age 62 was significantly predicted by semantic-specific fluency at mean age 56 (β = 0.13; 95% CI, 0.01–0.25), even after accounting for memory at age 56 (β = 0.85; 95% CI, 0.74–0.98). In contrast, memory at age 56 did not predict semantic-specific fluency at age 62 (β = 0.04; 95% CI, −0.09 to 0.16). The general fluency factor also did not predict later memory (or vice versa).
Figure 2. Phenotypic cross-lagged model of verbal fluency and episodic memory.
Both fluency latent factors are correlated with episodic memory at wave 1 (age 56) and predict episodic memory at wave 2 (age 62). Episodic memory at wave 1 also predicts the fluency factors at wave 2. Each factor at wave 1 also predicts itself at wave 2, and there are residual correlations between the residual variances (ε) on the fluency factors at wave 2 and the episodic memory factor at wave 2. Not pictured are the factor loadings on individual tasks (which were equated across time and similar in magnitude to those displayed in figure 2) or residual correlations between all observed variables across time (e.g., animals at wave 1 correlated with animals at wave 2). The semantic-specific factor is the only factor to significantly predict another construct at the second wave (β = 0.13).
Biometric models of cognitive abilities
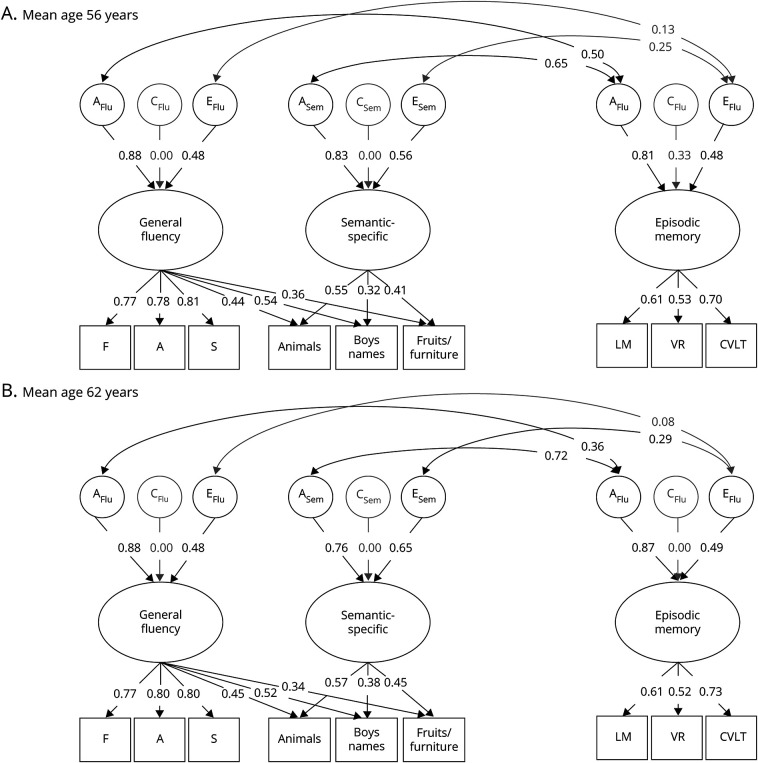
In biometric twin models of the age 56 and 62 data (figure 3), the phenotypic correlations between memory and semantic-specific fluency were explained primarily by genetic influences at age 56 (rgenetic = 0.65; 95% CI, 0.46–0.88) and at age 62 (rgenetic = 0.73; 95% CI, 0.58–0.94), explaining 87% (age 56) and 86% (age 62) of the total phenotypic correlations. There was also a significant nonshared environmental correlation between episodic memory and semantic-specific fluency at age 62 only (renvironmental = 0.28; 95% CI, 0.01–0.55). This environmental correlation was nonsignificant at age 56, but similar in magnitude (renvironmental = 0.25; 95% CI, −0.08 to 0.60). Genetic correlations explained 92% (age 56) (rgenetic = 0.50; 95% CI, 0.36–0.70) and 94% (age 62) (rgenetic = 0.36; 95% CI, 0.25–0.50) of the correlation between memory and general fluency.
Figure 3. Genetic and environmental associations between verbal fluency and episodic memory.
Full correlational models of the genetic (A), shared environmental (C), and nonshared environmental (E) influences on the general fluency, semantic-specific, and episodic memory latent variables at wave 1 (mean age 56; top) and wave 2 (mean age 62; bottom). Ellipses indicate latent variables and rectangles indicate measured variables. Significant factor loadings are displayed with black text and lines (p < 0.05). Variation explained by latent factors can be computed by squaring the factor loadings. CVLT = California Verbal Learning Test; LM = logical memory; VR = visual reproduction.
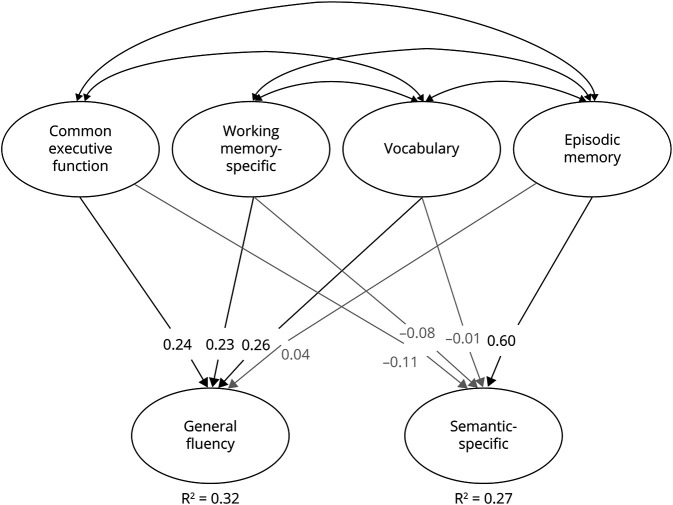
Using only the age 56 data, we fit a regression model (figure 4) in which the 2 fluency factors were regressed on factors for memory, vocabulary, and the 2 executive function factors. Although semantic-specific fluency was positively correlated with episodic memory (r = 0.46; 95% CI, 0.35–0.56), vocabulary (r = 0.19; 95% CI, 0.10–0.28), and common executive function (r = 0.20; 95% CI, 0.07–0.33), only the association with memory remained significant in the regression model (β = 0.60; 95% CI, 0.41–0.78). Conversely, the general fluency factor was correlated with all other cognitive abilities (rs = 0.32–0.50), including memory (r = 0.38; 95% CI, 0.30–0.45), but this association with memory was nonsignificant in the regression model (β = 0.04; 95% CI, −0.09 to 0.17). These findings suggest that the genetic correlations between memory and general fluency were likely explained by their overlap with other cognitive abilities, but the association between episodic memory and semantic-specific fluency reflects unique genetic associations between these constructs.
Figure 4. Regression model of verbal fluency and other cognitive latent factors at age 56.
Structural equation model where both fluency factors are regressed on latent variables for executive function (common executive function, working memory–specific), vocabulary, and episodic memory. Not pictured are factor loadings on latent factors (which are similar to our previous work and those displayed in figure 2). Significant paths and correlations are displayed with black text and lines (p < 0.05).
Discussion
These findings highlight the importance of episodic memory and semantic fluency as risk factors for cognitive decline and MCI. Among middle-aged men (ages 51–60) who were CN at wave 1, both measures predicted amnestic MCI 6 years later. Importantly, our previous results showing that higher AD polygenic risk scores were associated with significantly increased odds of having MCI in this sample provide support for this diagnosis being AD-related MCI.19 The current study demonstrated that baseline semantic-specific fluency predicted progression to amnestic MCI even after controlling for baseline memory. In other previous work, we found that there was no change in the semantic-specific factor (d = −0.01) over this 6-year interval,26 yet in the current study it did independently predict episodic memory 6 years later. Thus, semantic-specific fluency is associated with episodic memory, but it does not necessarily change at the same time or rate as episodic memory. Nevertheless, it does add to the prediction of memory and progression to amnestic MCI beyond the predictive value of baseline memory itself.
With respect to amnestic MCI, the focus is naturally on episodic memory, but our results indicate that relatively poor semantic-specific fluency performance among CN adults may precede decline in episodic memory. The associations between semantic-specific fluency and episodic memory were driven by genetic influences at both waves. Furthermore, these genetic influences may overlap with those for AD. Additional research examining the relationship of cognitive and biomarker trajectories may determine the mechanisms driving this ordering of decline. For example, the functional networks contributing to these cognitive processes may be affected at different points in the aging or disease process due to the topographic spread of pathology or the vulnerability of particular brain regions to pathology. Studies utilizing molecular imaging of AD pathology (i.e., tau and amyloid PET) will be needed to further clarify the nature of these relationships. Regardless, these findings demonstrate that semantic fluency tests can be useful indicators of later memory impairment.
Although the prediction was not as strong as that for amnestic MCI, episodic memory at wave 1 also predicted nonamnestic MCI at wave 2, suggesting it can also be a predictor of cognitive decline in other domains (except fluency). Some of this prediction may also be due to AD pathology, where both memory and other cognitive abilities are declining together (but with memory not yet reaching criteria for amnestic MCI). However, this association may simply reflect other nonpathologic changes in aging. Specifically, memory is more strongly correlated with general cognitive ability than verbal fluency in this sample (especially the semantic-specific factor, which adjusts for letter fluency),40,41 and general cognitive ability may be driving age-related changes across all domains.42,43 Studies with multiple longitudinal assessments, especially those that can elucidate the relationship between biomarker and cognitive trajectories, will be useful in clarifying the causal mechanisms domain-specific changes.
Although biomarkers are necessary for biologically based diagnosis, and are important for identifying individuals at greatest risk for cognitive decline and dementia, several studies have shown that neuropsychological tests are often better and earlier predictors of progression to AD than biomarkers.3–5,44–46 One reason may be that current techniques for measuring biomarkers are not necessarily able to detect the earliest stages of disease progression. For example, β-amyloid accumulates slowly for as much as 2 decades before symptom onset, but PET ligands have high affinity only for later stage neuritic β-amyloid plaques.47,48 Continuing the search for earlier biomarker detection is critically important. Meanwhile, the present results suggest that measures of memory and fluency are effective early indicators of risk for progression to amnestic MCI given that participants were only in their 50s at the baseline assessment. They can also be completed in a short amount of time at little expense. Fluency and memory measures may be combined with biomarkers to further improve prediction of MCI and AD. Biomarker data will improve determination of specificity for AD-related deficits, and fluency and memory measures may also be useful as screening tools for identifying individuals who should be followed up with biomarker testing.
This sample comprised primarily white, non-Hispanic men, so these findings may not generalize across sex and race/ethnicity. It will also be important for future work to directly compare these ORs with those for biomarkers (preferably in the same model) and to examine whether neuropsychological tests more strongly predict progression to MCI in subsets of individuals (e.g., who are already amyloid positive). Finally, in most longitudinal studies, attriters tend to have lower cognitive ability than the returnees. In the present study, dropouts had significantly lower memory factor scores at wave 1, but no differences for fluency factor scores. Thus, we may have lost some individuals who were at the greatest risk for later memory impairment, but that would suggest that our findings regarding predictive ability are actually conservative. Strengths of the study are that this is a national, rather than a local, community-based nonclinical sample of middle-aged men with health, education, and lifestyle characteristics that are representative of American men in their age range. The young age of the wave 1 assessment is also a strength with respect to early identification of risk.
This study demonstrated that episodic memory and semantic fluency independently predicted progression to amnestic MCI in CN, middle-aged men who were only in their 50s at baseline. Episodic memory also predicted progression to later nonamnestic MCI, although not as strongly as amnestic MCI. These findings demonstrate the usefulness of examining neuropsychological variability among CN individuals for early identification of risk for AD, highlighting the fact that CN adults should not be treated as a homogeneous group. Efforts to improve the treatment of AD are beginning to focus on early identification, in part because developing effective treatments are seen as most likely to require intervention during the earliest stages of the disease,13,49 but also because diagnosing individuals in the stage of MCI could improve patient quality of life and is projected to substantially reduce the financial impact of the disease (e.g., due to nontherapeutic interventions such as financial planning, management of other medical conditions, and household safety).50 In the meantime, the results suggest that it will be important to take advantage of the predictive ability of episodic memory and verbal fluency tests in studies designed to identify individuals at greatest risk for MCI (and later dementia). Ultimately, the combination of these cognitive abilities and biomarkers may further improve prediction of MCI and AD.
Acknowledgment
The authors thank the twins and the efforts of many staff members.
Glossary
- AD
Alzheimer disease
- CFI
comparative fit index
- CI
confidence interval
- CN
cognitively normal
- CVLT
California Verbal Learning Test II
- DZ
dizygotic
- LM
logical memory
- MCI
mild cognitive impairment
- MZ
monozygotic
- OR
odds ratio
- RMSEA
root mean square error of approximation
- VETSA
Vietnam Era Twin Study of Aging
- VR
visual reproduction
Appendix. Authors
Footnotes
CME Course: NPub.org/cmelist
Study funding
This research was supported by grants AG050595, AG018386, AG018384, AG022381, and AG047903 from the NIH. The content of this article is the responsibility of the authors and does not represent official views of NIA/NIH or the Veterans' Administration. Numerous organizations provided assistance in the conduct of the VET Registry, including US Department of Veterans Affairs, Department of Defense; National Personnel Records Center, National Archives and Records Administration; Internal Revenue Service; National Opinion Research Center; National Research Council, National Academy of Sciences; and the Institute for Survey Research, Temple University.
Disclosure
The authors report no disclosures relevant to the manuscript. Go to Neurology.org/Nhttps://n.neurology.org/lookup/doi/10.1212/WNL.0000000000010130 for full disclosures.
References
- 1.Jack CR Jr, Bennett DA, Blennow K, et al. NIA-AA Research Framework: toward a biological definition of Alzheimer's disease. Alzheimers Dement 2018;14:535–562. [DOI] [PMC free article] [PubMed] [Google Scholar]
- 2.Chen P, Ratcliff G, Belle SH, Cauley JA, DeKosky ST, Ganguli M. Cognitive tests that best discriminate between presymptomatic AD and those who remain nondemented. Neurology 2000;55:1847–1853. [DOI] [PubMed] [Google Scholar]
- 3.Gomar JJ, Bobes-Bascaran MT, Conejero-Goldberg C, Davies P, Goldberg TE; Alzheimer's Disease Neuroimaging Initiative. Utility of combinations of biomarkers, cognitive markers, and risk factors to predict conversion from mild cognitive impairment to Alzheimer disease in patients in the Alzheimer's disease neuroimaging initiative. Arch Gen Psychiatry 2011;68:961–969. [DOI] [PubMed] [Google Scholar]
- 4.Edmonds EC, Delano-Wood L, Galasko DR, Salmon DP, Bondi MW; Alzheimer's Disease Neuroimaging Initiative. Subtle cognitive decline and biomarker staging in preclinical Alzheimer's disease. J Alzheimers Dis 2015;47:231–242. [DOI] [PMC free article] [PubMed] [Google Scholar]
- 5.Jedynak BM, Lang A, Liu B, et al. A computational neurodegenerative disease progression score: method and results with the Alzheimer's Disease Neuroimaging Initiative cohort. Neuroimage 2012;63:1478–1486. [DOI] [PMC free article] [PubMed] [Google Scholar]
- 6.Murphy KJ, Rich JB, Troyer AK. Verbal fluency patterns in amnestic mild cognitive impairment are characteristic of Alzheimer's type dementia. J Int Neuropsychological Soc 2006;12:570–574. [DOI] [PubMed] [Google Scholar]
- 7.Kochhann R, Pereira AH, Holz MR, Chaves ML, Fonseca RP. Deficits in unconstrained, phonemic and semantic verbal fluency in healthy elders, mild cognitive impairment, and mild Alzheimer's disease patients. Alzheimers Dement 2016;12:P751–P752. [Google Scholar]
- 8.Nutter-Upham KE, Saykin AJ, Rabin LA, et al. Verbal fluency performance in amnestic MCI and older adults with cognitive complaints. Arch Clin Neuropsychol 2008;23:229–241. [DOI] [PMC free article] [PubMed] [Google Scholar]
- 9.Mueller KD, Koscik RL, LaRue A, et al. Verbal fluency and early memory decline: results from the Wisconsin Registry for Alzheimer's Prevention. Arch Clin Neuropsychol 2015;30:448–457. [DOI] [PMC free article] [PubMed] [Google Scholar]
- 10.Raoux N, Amieva H, Le Goff M, et al. Clustering and switching processes in semantic verbal fluency in the course of Alzheimer's disease subjects: results from the PAQUID longitudinal study. Cortex 2008;44:1188–1196. [DOI] [PubMed] [Google Scholar]
- 11.Amieva H, Jacqmin-Gadda H, Orgogozo JM, et al. The 9 year cognitive decline before dementia of the Alzheimer type: a prospective population-based study. Brain 2005;128:1093–1101. [DOI] [PubMed] [Google Scholar]
- 12.Henry JD, Crawford JR, Phillips LH. Verbal fluency performance in dementia of the Alzheimer's type: a meta-analysis. Neuropsychologia 2004;42:1212–1222. [DOI] [PubMed] [Google Scholar]
- 13.Golde TE, Schneider LS, Koo EH. Anti-abeta therapeutics in Alzheimer's disease: the need for a paradigm shift. Neuron 2011;69:203–213. [DOI] [PMC free article] [PubMed] [Google Scholar]
- 14.Sperling RA, Aisen PS, Beckett LA, et al. Toward defining the preclinical stages of Alzheimer's disease: recommendations from the National Institute on Aging-Alzheimer's Association workgroups on diagnostic guidelines for Alzheimer's disease. Alzheimers Dement 2011;7:280–292. [DOI] [PMC free article] [PubMed] [Google Scholar]
- 15.Tsuang MT, Bar JL, Harley RM, Lyons MJ. The Harvard Twin Study of substance abuse: what we have learned. Harv Rev Psychiatry 2001;9:267–279. [PubMed] [Google Scholar]
- 16.Kremen WS, Panizzon MS, Xian H, et al. Genetic architecture of context processing in late middle age: more than one underlying mechanism. Psychol Aging 2011;26:852–863. [DOI] [PMC free article] [PubMed] [Google Scholar]
- 17.Kremen WS, Thompson-Brenner H, Leung YM, et al. Genes, environment, and time: the Vietnam Era Twin Study of Aging (VETSA). Twin Res Hum Genet 2006;9:1009–1022. [DOI] [PubMed] [Google Scholar]
- 18.Schoenborn CA, Heyman KM. Health characteristics of adults aged 55 years and over: United States, 2004-2007. Natl Health Stat Rep 2009;16:1–31. [PubMed] [Google Scholar]
- 19.Logue MW, Panizzon MS, Elman JA, et al. Use of an Alzheimer's disease polygenic risk score to identify mild cognitive impairment in adults in their 50s. Mol Psychiatry 2019;24:421–430. [DOI] [PMC free article] [PubMed] [Google Scholar]
- 20.Elman JA, Jak AJ, Panizzon MS, et al. Underdiagnosis of mild cognitive impairment: a consequence of ignoring practice effects. Alzheimers Dement Diagn Assess Dis Monit 2018;10:372–381. [DOI] [PMC free article] [PubMed] [Google Scholar]
- 21.Gustavson DE, Panizzon MS, Franz CE, et al. Genetic and environmental architecture of executive functions in midlife. Neuropsychology 2018;32:18–30. [DOI] [PMC free article] [PubMed] [Google Scholar]
- 22.Kremen WS, Panizzon MS, Franz CE, et al. Genetic complexity of episodic memory: a twin approach to studies of aging. Psychol Aging 2014;29:404–417. [DOI] [PMC free article] [PubMed] [Google Scholar]
- 23.Wechsler D. Wechsler Memory Scale (WMS-III). San Antonio: Psychological Corporation; 1997. [Google Scholar]
- 24.Delis DC, Kramer JH, Kaplan E, Ober BA. California Verbal Learning Test (CVLT-2). 2nd ed. San Antonio: Psychological Corporation; 2000. [Google Scholar]
- 25.Delis DC, Kaplan E, Kramer JH. Delis-Kaplan Executive Function System (D-KEFS). San Antonio: Psychological Corporation; 2001. [Google Scholar]
- 26.Gustavson DE, Panizzon MS, Elman JA, et al. Genetic and environmental influences on verbal fluency in middle age: a longitudinal twin study. Behav Genet 2018;48:361–373. [DOI] [PMC free article] [PubMed] [Google Scholar]
- 27.Bondi MW, Edmonds EC, Jak AJ, et al. Neuropsychological criteria for mild cognitive impairment improves diagnostic precision, biomarker associations, and progression rates. J Alzheimers Dis 2014;42:275–289. [DOI] [PMC free article] [PubMed] [Google Scholar]
- 28.Jak AJ, Bondi MW, Delano-Wood L, et al. Quantification of five neuropsychological approaches to defining mild cognitive impairment. Am J Geriatr Psychiatry 2009;17:368–375. [DOI] [PMC free article] [PubMed] [Google Scholar]
- 29.Kremen WS, Jak AJ, Panizzon MS, et al. Early identification and heritability of mild cognitive impairment. Int J Epidemiol 2014;43:600–610. [DOI] [PMC free article] [PubMed] [Google Scholar]
- 30.Jak AJ, Panizzon MS, Spoon KM, et al. Hippocampal atrophy varies by neuropsychologically defined MCI among men in their 50s. Am J Geriatr Psychiatry 2015;23:456–465. [DOI] [PMC free article] [PubMed] [Google Scholar]
- 31.Wechsler D. Wechsler Abbreviated Scale of Intelligence. San Antonio: The Psychological Corporation; 1999. [Google Scholar]
- 32.Bayroff AG, Anderson AA. Development of Literacy Screening Scales for AFQT 7 and 8 Failures. Washington: US Army Research Institute; 1963. [Google Scholar]
- 33.Lyons MJ, Panizzon MS, Liu W, et al. A longitudinal twin study of general cognitive ability over four decades. Dev Psychol 2017;53:1170–1177. [DOI] [PMC free article] [PubMed] [Google Scholar]
- 34.Gustavson DE, Panizzon MS, Elman JA, et al. Stability of genetic and environmental influences on executive functions in midlife. Psychol Aging 2018;33:219–231. [DOI] [PMC free article] [PubMed] [Google Scholar]
- 35.Bates D, Mächler M, Bolker B, Walker S. Fitting linear mixed-effects models using lme4. J Stat Softw 2015;67. [Google Scholar]
- 36.Radloff LS. The CES-D scale: a self-report depression scale for research in the general population. Appl Psychol Meas 1977;1:385–401. [Google Scholar]
- 37.Muthén LK, Muthén BO. Mplus Version 7 User's Guide . Los Angeles: Muthén & Muthén; 2010–2012. [Google Scholar]
- 38.Neale MC, Hunter MD, Pritikin JN, et al. OpenMx 2.0: extended structural equation and statistical modeling. Psychometrika 2016;81:535–549. [DOI] [PMC free article] [PubMed] [Google Scholar]
- 39.Hu LT, Bentler PM. Fit indices in covariance structure modeling: sensitivity to underparameterized model misspecification. Psychol Methods 1998;3:424–453. [Google Scholar]
- 40.Gustavson DE, Panizzon MS, Franz CE, et al. Integrating verbal fluency with executive functions: evidence from twin studies in adolescence and middle age. J Exp Psychol Gen 2019;148:2104–2119. [DOI] [PMC free article] [PubMed] [Google Scholar]
- 41.Kremen WS, Beck A, Elman JA, et al. Influence of young adult cognitive ability and additional education on later-life cognition. Proc Natl Acad Sci USA 2019;116:2021–2026. [DOI] [PMC free article] [PubMed] [Google Scholar]
- 42.Tucker-Drob EM, Briley DA, Starr JM, Deary IJ. Structure and correlates of cognitive aging in a narrow age cohort. Psychol Aging 2014;29:236–249. [DOI] [PMC free article] [PubMed] [Google Scholar]
- 43.Hertzog C, Dixon RA, Hultsch DF, MacDonald SW. Latent change models of adult cognition: are changes in processing speed and working memory associated with changes in episodic memory? Psychol Aging 2003;18:755–769. [DOI] [PubMed] [Google Scholar]
- 44.Ewers M, Walsh C, Trojanowski JQ, et al. Prediction of conversion from mild cognitive impairment to Alzheimer's disease dementia based upon biomarkers and neuropsychological test performance. Neurobiol Aging 2012;33:1203–1214. [DOI] [PMC free article] [PubMed] [Google Scholar]
- 45.Gomar JJ, Conejero-Goldberg C, Davies P, Goldberg TE; Alzheimer's Disease Neuroimaging Initiative. Extension and refinement of the predictive value of different classes of markers in ADNI: four-year follow-up data. Alzheimers Dement 2014;10:704–712. [DOI] [PMC free article] [PubMed] [Google Scholar]
- 46.Insel PS, Mattsson N, Mackin RS, et al. Accelerating rates of cognitive decline and imaging markers associated with beta-amyloid pathology. Neurology 2016;86:1887–1896. [DOI] [PMC free article] [PubMed] [Google Scholar]
- 47.Villemagne VL, Burnham S, Bourgeat P, et al. Amyloid beta deposition, neurodegeneration, and cognitive decline in sporadic Alzheimer's disease: a prospective cohort study. Lancet Neurol 2013;12:357–367. [DOI] [PubMed] [Google Scholar]
- 48.Jack CR Jr, Wiste HJ, Lesnick TG, et al. Brain beta-amyloid load approaches a plateau. Neurology 2013;80:890–896. [DOI] [PMC free article] [PubMed] [Google Scholar]
- 49.Sperling R, Mormino E, Johnson K. The evolution of preclinical Alzheimer's disease: implications for prevention trials. Neuron 2014;84:608–622. [DOI] [PMC free article] [PubMed] [Google Scholar]
- 50.Alzheimer’s Association. 2018 Alzheimer's disease facts and figures. Alzheimers Dement 2018;14:367–429. [Google Scholar]
Associated Data
This section collects any data citations, data availability statements, or supplementary materials included in this article.
Data Availability Statement
VETSA data are publicly available, with restrictions. Information regarding data access can be found at our website: medschool.ucsd.edu/som/psychiatry/research/VETSA/Pages/default.aspx.


