

Abstract
Reductions in greenhouse gas (GHG) emissions can bring ancillary benefits of improved air quality and reduced premature mortality, in addition to slowing climate change. Here we study the co-benefits of global and domestic GHG mitigation on US air quality and human health in 2050 at fine resolution using dynamical downscaling of meteorology and air quality from global simulations to the continental US, and quantify for the first time the co-benefits from foreign GHG mitigation. Relative to the reference scenario from which RCP4.5 was created, global GHG reductions in RCP4.5 avoid 16000 PM2.5-related all-cause deaths yr−1 (90% confidence interval, 11700–20300), and 8000 (3600–12400) O3-related respiratory deaths yr−1 in the US in 2050. Foreign GHG mitigation avoids 15% and 62% of PM2.5- and O3-related total avoided deaths, highlighting the importance of foreign mitigation for US health. GHG mitigation in the US residential sector brings the largest co-benefits for PM2.5-related deaths (21% of total domestic co-benefits), and industry for O3 (17%). Monetized benefits for avoided deaths from ozone and PM2.5 are $137 ($87–187) per ton CO2 at high valuation and $45 ($29–62) at low valuation, of which 31% are from foreign GHG reductions. These benefits likely exceed the marginal cost of GHG reductions in 2050. The US gains significantly greater air quality and health co-benefits when its GHG emission reductions are concurrent with reductions in other nations. Similarly, previous studies estimating co-benefits locally or regionally may greatly underestimate the full co-benefits of coordinated global actions.
Keywords: climate change, air quality, premature mortality, particulate matter, ozone, greenhouse gas, co-benefits
1. Introduction
Exposure to fine particulate matter (PM2.5) and ozone (O3) is associated with both morbidity (e.g. hospitalizations, emergency department visits, school absences, and asthma-related health effects) and premature human mortality (e.g. deaths from cardiovascular and respiratory disease and lung cancer), as revealed in epidemiological studies (US EPA 2009, 2013). Several cohort studies have shown evidence for chronic effects of PM2.5 on mortality (Laden et al 2006, Krewski et al 2009, Lepeule et al 2012), whereas fewer have demonstrated the chronic effects of O3 on mortality (Jerrett et al 2009).
Previous research has quantified future air quality changes and their effects on human health under projected emission scenarios, at both the global (West et al 2007, Selin et al 2009, Silva et al 2016a) and regional scales (Fann et al 2013, Kim et al 2014, Jiang et al 2015, Sun et al 2015). Climate change can also affect air quality through several mechanisms, including photochemical reactions, natural emissions, deposition rates, and air stagnation events (Weaver et al 2009, Jacob and Winner 2009, Fiore et al 2012, 2015). Related studies have quantified the effect of global and regional climate change on air quality and human health (Bell et al 2007, Tagaris et al 2009, Post et al 2012, Fang et al 2013, Fann et al 2015). Post et al (2012) used an ensemble of atmospheric models to study the effect of climate change in 2050 on air quality and human health in the US, and found significant variability when using different models.
Many studies have also investigated the co-benefits of greenhouse gas (GHG) mitigation for air quality and avoided premature mortality, as actions to reduce GHG emissions also tend to reduce co-emitted air pollutants (Bell et al 2008, Cifuentes et al 2001, Nemet et al 2010). When monetized, the health co-benefits of GHG mitigation were found to range across the literature from $2 to $196/tCO2 (Nemet et al 2010), comparable to the costs of GHG reductions. Other recent studies have also analyzed the effects of GHG mitigation on future air quality and human health co-benefits in the US (Driscoll et al 2015, Thompson et al 2014, Trail et al 2015, Plachinski et al 2014). Thompson et al (2014) studied the cobenefits of different climate policies in the US on domestic air quality in 2030, finding that human health benefits due to improved air quality can offset 26–1050% of the cost of carbon polices. Other studies also investigate the co-benefits of climate policy on food security, energy savings, and other health co-benefits of active transportation (walking, biking) and changes in diet (Capps et al 2016, Chuwah et al 2015, Friel et al 2009, Jakob 2006, McCollum et al 2013, Wilkinson et al 2009, Woodcock et al 2009), but they are not the focus of our study.
Previous co-benefits studies have been limited by only considering the co-benefits of regional or local climate policies on regional air quality and human health, neglecting (i.) the co-benefits of those actions for other nations or regions, and (ii.) the co-benefits gained domestically from global actions where one country’s actions are coordinated with reductions internationally. Both PM2.5 and O3 have long enough lifetimes in the atmosphere to transport intercontinentally, suggesting that emissions from one source region can affect air quality and human health on multiple receptor regions (Anenberg et al 2009, 2014, Liu et al 2009, TF HTAP 2010). For O3, the health benefits of O3 precursor reductions may even be greater outside of the source region than within due to the greater population over several receptor regions (Duncan et al 2008, Anenberg et al 2009, West et al 2009). PM2.5 has a much shorter lifetime than O3, but the mortality impacts of intercontinental transport of PM2.5 is comparable to that of ozone due to the stronger effects of PM2.5 on mortality (Anenberg et al 2014). To address these limitations, West et al (2013, referred to as WEST2013 hereafter) were the first to use a global chemical transport model (CTM) to address the co-benefits of global GHG mitigation on air quality and human health. WEST2013 were also the first to estimate co-benefits via two mechanisms: reduced co-emitted air pollutants, and slowing climate change and its effects on air quality. They found that global GHG mitigation could avoid 2.2±0.8 million premature deaths in 2100 due to the improved air quality, accounting for both PM2.5 and O3 mortality. The co-benefits from the first mechanism of reduced co-emitted air pollutants are much greater than those from the second mechanism of slowing climate change and its effect on air quality. The monetized co-benefits for health were estimated at $50–$380/tCO2, globally averaged, higher than previous estimates (Nemet et al 2010).
WEST2013 applied a global CTM (horizontally 2°×2.5°) to study the co-benefits. We increased the horizontal resolution using a limited area model framework to further investigate the co-benefits for US air quality in 2050 at much finer resolution (Zhang et al 2016). Here we use the simulations performed by Zhang et al (2016) and focus on quantifying the co-benefits of global GHG reductions for avoided air pollution-related mortality in the continental US in 2050. We study the total co-benefits through the two mechanisms, following WEST2013 and Zhang et al (2016), and separate the co-benefits of GHG mitigation in the US versus the contributions from foreign countries. By embedding this study within the previous global study of WEST2013, we are the first to investigate the co-benefits of foreign GHG mitigation for US air quality and human health. Previous studies have also investigated the effects of air pollution from specific emission sectors on premature mortality, both globally (Lelieveld et al 2015, Morita et al 2014, Yim et al 2015, Silva et al 2016b) and regionally (Caiazzo et al 2013, Fann et al 2012, 2013). Here we conduct three new sensitivity simulations to quantify the air quality and health co-benefits of GHG reductions in three US emission sectors: industry, residential and energy.
2. Methods
2.1. Air quality changes in the US in 2050 at fine scale
Air quality changes in the US under different GHG scenarios centered on 2050 were downscaled from WEST2013 by Zhang et al (2016). Meteorological fields from the NOAA Geophysical Fluid Dynamics Laboratory (GFDL) atmospheric model AM3 (Donner et al 2011, Naik et al 2013), used by WEST2013, was first downscaled to the regional scale over the Continental US domain to a 36-km horizontal resolution using the Weather Research Forecast model (WRF, v3.4.1, Skamarock and Klemp, 2008). The WRF configuration applies spectral nudging to maintain the large-scale atmospheric circulation resolved by global model (Otte et al 2012, Bowden et al 2012,2013). Further information on the WRF configuration can be found in Zhang et al (2016). GFDL-AM3 was downscaled using WRF for two periods, a historical period (2000–2003; here considered 2000), and a future period (2049–2052; here considered 2050) for the Representative Concentration Pathway 4.5 (RCP4.5) and RCP8.5 scenarios with one year of spin-up. Global anthropogenic emissions from RCP4.5 and its reference scenario (REF) were directly processed to the regional scale using the Sparse Matrix Operator Kernel Emissions (SMOKE, v3.5, Houyoux et al 2000) program. Dynamical chemical boundary conditions were acquired from the global CTM outputs of WEST2013. The Community Multiscale Air Quality model (CMAQ, v5.0.1, Byun and Schere, 2006), with the CB05 chemical mechanism with updated toluene reactions and the latest aerosol module (AE6), was used to simulate air pollutant concentrations (i.e., PM2.5 and O3) in 2000 and 2050. Most of the CMAQ simulations used in this study (table 1) were completed by Zhang et al (2016), but three new sensitivity simulations are performed here to quantify the co-benefits of GHG mitigation from domestic emission sectors in the US. The CMAQ simulations from Zhang et al (2016) and the three additional sensitivity simulations are run for 40 consecutive months, with the first four months as spin-up, and the results are presented as three-year averages.
Table 1.
Simulations used for health impact assessment in this study, conducted by Zhang et al (2016), and the three additional sector simulations for this study. Boundary conditions are from the MOZART-4 (MZ4) simulations of WEST2013. Global methane (CH4) background concentrations are fixed in CMAQ, consistent with the RCPs and WEST2013. All the simulations are run for three consecutive years, with four months spin-up.
| Years | Scenario | Emissions | Meteorology | BCs | CH4 |
|---|---|---|---|---|---|
| 2000 | S_2000 | 2000 | 2000 | MZ4 2000 | 1766 ppbv |
| 2050 | S_REF | REF | RCP8.5 | MZ4 REF | 2267 ppbv |
| S_RCP45 | RCP4.5 | RCP4.5 | MZ4 RCP4.5 | 1833 ppbv | |
| S_Emis | RCP4.5 | RCP8.5 | MZ4 e45m85 | 1833 ppbv | |
| S_Dom | aRCP4.5 for US | RCP8.5 | MZ4 REF | 2267 ppbv | |
| S_indUS | bRCP4.5 for US Industry | RCP8.5 | MZ4 REF | 2267 ppbv | |
| S_resUS | bRCP4.5 for US Residential | RCP8.5 | MZ4 REF | 2267 ppbv | |
| S_eneUS | bRCP4.5 for US Energy | RCP8.5 | MZ4 REF | 2267 ppbv |
apply emissions from RCP4.5 in US and from REF in the parts of Canada and Mexico within the domain.
only one sector of emissions from RCP4.5 (e.g., industry, residential and energy) are used, and emissions in other sectors over the US are from REF, as are emissions over Canada and Mexico in the domain.
The total co-benefits from global GHG mitigation are obtained by comparing scenarios S_RCP45 and S_REF (Table 1). As discussed by WEST2013 and Zhang et al (2016), RCP4.5 was developed based upon REF, which is a self-consistent representation of future energy and land use development, with regionally specific air pollutants emissions, developed consistently with the assumed future development to 2100 but without considering climate policy (Smith et al 2011). Relative to REF, RCP4.5 is created by applying a global carbon policy spanning all world regions and emission sectors (Thomson et al 2011); the only difference between these two scenarios is therefore the carbon policy. These self-consistent scenarios therefore uniquely isolate the effects of GHG mitigation (RCP8.5 is used as a proxy for REF meteorology, since no climate model simulated REF). The total co-benefits from global GHG mitigation are obtained by comparing scenarios S_RCP45 and S_REF (Table 1). As discussed by Zhang et al (2016), the sensitivity run S_Emis applies emissions from RCP4.5 and meteorology from RCP8.5. To separate the total co-benefits from the two mechanisms, we use S_Emis minus S_REF to give the co-benefits from co-emitted air pollutant reductions, and S_RCP45 minus S_Emis for the co-benefits from slowing climate change. The sensitivity simulation S_Dom applies GHG mitigation from the RCP4.5 scenario in the US only, so the co-benefits of domestic GHG mitigation are estimated as S_Dom minus S_REF, and foreign co-benefits as S_RCP45 minus S_Dom.
In addition, we simulate three more scenarios to identify the co-benefits from actions to reduce GHG emissions in individual sectors domestically. We choose to simulate reductions in the industry (S_indUS, manufacturing industries, industrial process emissions other than solvents, construction, mining, and agricultural machinery), residential and commercial buildings (S_resUS, primarly from cooking, heating and hot water), and energy sectors (S_eneUS, from electric power generation and energy extraction and transformation), because air pollutant emission reductions in RCP4.5 in 2050 are greatest from these sectors in the US. Although ground transportation is the largest contributor for most air pollutants in the US in 2000 and 2050, we did not select transportation as little air pollutants reductions are seen from this sector in 2050. The air pollutant emission reductions from the three sectors selected here account for more than 98% of the total SO2 and NOx reductions in RCP4.5 relative to REF in the US in 2050, 80% of the CO reductions, and more than 50% of the EC and OC reductions. However, these three sectors only account for 11% of the total non-methane volatile organic compound (NMVOC) decreases (Supporting info table S2).
2.2. Human health analysis
We use the environmental Benefits Mapping and Analysis Program–Community Edition (BenMAP-CE, v1.08) (US EPA 2014) to calculate the avoided human mortality associated with future surface air quality changes for both PM2.5 and O3. BenMAP-CE calculates the relationship between air pollution and certain health effects, using a health impact function (HIF) from epidemiological studies. The HIFs for PM2.5 and O3 used in this study are based on a log-linear relationship between relative risk (RR) and air pollutant concentrations defined by epidemiology studies (Jerrett et al 2009, Krewski et al 2009), which are also used by WEST2013. RR is used to calculate attributable fraction (AF), the fraction of the disease burden attributable to the risk factor, which is defined as:
| (1) |
where β is the concentration–response factor (CRF; i.e., the estimated slope of the log-linear relation between concentration and mortality) and ΔX is the change in air pollutant concentration between two scenarios. AF is multiplied by the baseline mortality rate (y0), and the exposed population (Pop) to yield an estimate of excess deaths attributable to changes in air pollution (ΔMort):
| (2) |
We present results for all-cause mortality from the PM2.5 changes, rather than cardiopulmonary disease (CPD) and lung cancer (LC), as all-cause mortality is the most comprehensive estimate of PM-related mortality appropriate for the US. However, we also estimate the PM-related mortality from CPD and LC to compare with the results of WEST2013. We also quantify the premature mortality from respiratory disease (RESP) associated with O3 changes. The 90% confidence intervals (CI) presented in this study are calculated using a full Monte-Carlo analysis inside BenMAP-CE considering only uncertainty in the HIF.
BenMAP-CE uses county-level baseline mortality rates for the present day and projected to 2050 at five-year intervals, including RESP for O3, and all-cause, CPD, and LC for PM2.5 (RTI International 2015). Overall, the projected baseline mortality rates within BenMAP-CE decrease from 2005 to 2050. However, the baseline mortality rates used by WEST2013 are projected to increase in 2050 in the US, derived from the International Futures (IFs, version 6.54, Hughes et al 2011) under the UNEPGEO Base Case scenario. For population, BenMAP-CE includes the future population projection at county level in the US until 2040 only (totalling 403 million, Woods and Poole 2012), but our study is focused on 2050 (the RCP4.5 projected total population is 384 million in 2050, Clark et al 2007). To be consistent with WEST2013, we run BenMAP-CE with baseline mortality rates in 2005 and the population projection in 2040 (aged 30 and above), and then post-process the BenMAP-CE outputs by multiplying adjustment ratios to match the US population and US average baseline rates of WEST2013 (supporting information table S1). By doing so, we assume that future baseline mortality rates increase at a uniform national ratio in each county without age, gender or ethnic variations, and that the spatial distribution of population in 2050 of RCP4.5 is the same as that in 2040 projected by Woods and Poole (2012).
3. Results
The total US PM2.5 concentration co-benefits in 2050 from global GHG mitigation (−0.47 μg m−3 for three-year US annual average) are greatest in the East and California (CA), and less in the West (figure 1a). For O3, we calculate the three-year average of the 6-month ozone-season average of 1-hr daily maximum O3, to be consistent with Jerrett et al (2009), and the total US O3 co-benefits in 2050 from global GHG mitigation (−2.96 ppbv for three-year US ozone-season average) are fairly uniform over the US domain (figure 1b), slightly higher over the Western US than the East. The population-weighted average (for the 2050 exposed population age 30 and older) for the PM2.5 co-benefit (−0.84 μg m−3 for US average) is almost twice the simple average (table 2), as PM2.5 has a short lifetime and is therefore distributed locally to regionally (Punger and West 2013). Population weighting has less of an impact on the O3 estimates as the longer lifetime of O3 produces a more uniform spatial distribution.
Figure 1.
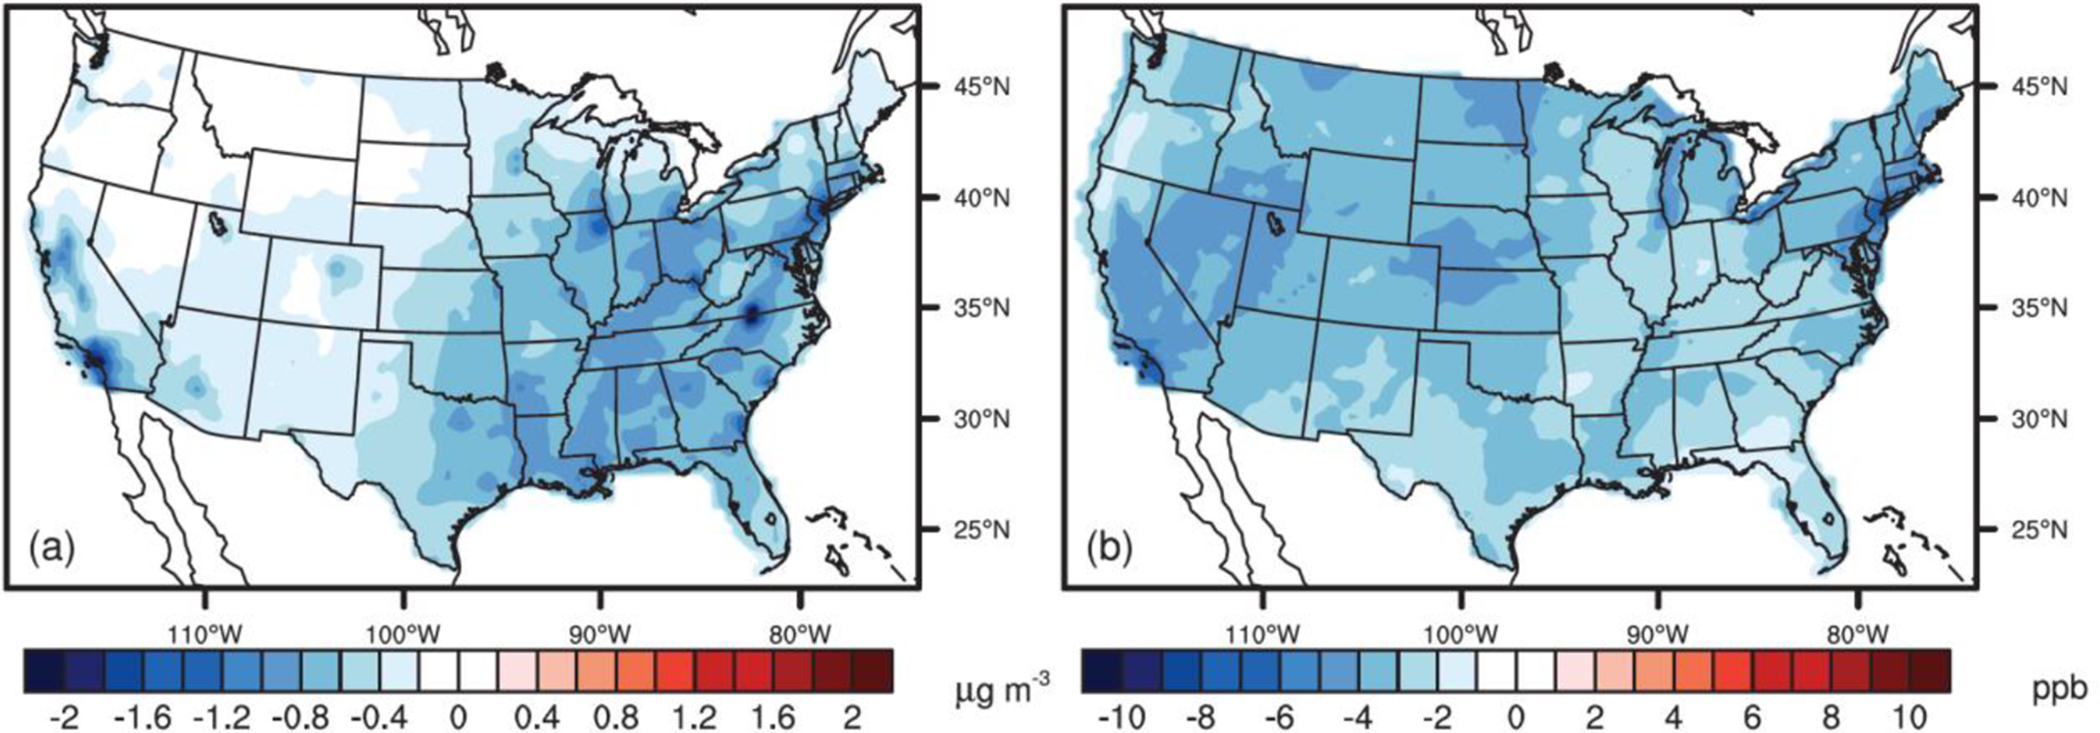
Total air quality co-benefits (S_RCP45-S_REF) in 2050 for (a) annual average PM2.5, and (b) 6-month ozone-season average of 1-hr daily maximum of O3. Results are presented as three-year averages. Negative values (blue) indicate air quality improvements.
Table 2.
Co-benefits for air quality changes in the continental US in 2050 from global, domestic and sectoral GHG mitigation. For PM2.5 (μg m−3) we use the three-year average, and for O3 (ppbv), we calculate the 6-month ozone season of 1-hr daily maximum, and then average over three years. Co-benefits are estimated using RCP4.5 minus REF. Negative values indicate air quality improvements.
| PM2.5 | O3 | ||||
|---|---|---|---|---|---|
| Simple Avg | Pop-Weighted Avg | Simple Avg | Pop-Weighted Avg | ||
| Emission | −0.45 | −0.82 | −2.75 | −2.89 | |
| Climate | −0.02 | −0.02 | −0.21 | −0.13 | |
| Total | −0.47 | −0.84 | −2.96 | −3.02 | |
| Domestic | −0.35 | −0.71 | −0.80 | −1.07 | |
| Foreign | −0.12 | −0.13 | −2.16 | −1.95 | |
| Industry | −0.057 | −0.11 | −0.22 | −0.20 | |
| Domestic | Residential | −0.058 | −0.15 | −0.11 | −0.058 |
| Energy | −0.046 | −0.089 | −0.13 | −0.14 | |
For the human health benefits from the global GHG mitigation, our results show that 16000 (90% CI: 11700–20300) premature deaths will be avoided annually in the US in 2050 due to PM2.5 decreases (table 3). The states with the most avoided deaths are CA (2500 deaths, CI: 1800–3200), New York (NY, 1300 deaths, CI: 1000–1700) and Texas (TX, 1200 deaths, CI: 800–1500) (Supporting info figure S1), with each state having large population and large PM2.5 decreases (figure 1, supporting info table S4). For O3, the total avoided deaths in the US are 8000 (CI: 3600–12400), 50% fewer than PM2.5, and also highest in CA (1400, CI: 600–2200), NY (500, CI: 200–800) and TX (500, CI: 200–700). The spatial patterns of both PM2.5 and O3 related avoided premature mortality are shown in figure 2. We further quantify the human health co-benefits from global GHG mitigation by calculating the avoided mortality per capita (MPC, the avoided deaths per million people age 30 and older) in 2050, for both PM2.5 and O3 (supporting info figure S2, table S4). The MPC for PM2.5 is much higher in the East than in the West (except for CA), with much greater variation than for O3, consistent with the finding that the total concentration co-benefits vary locally to regionally for PM2.5, and are more spatially uniform for O3 (figure 1). Relative to the present, air quality improves and premature mortality decreases in the future under REF, due to the large projected emission reductions of conventional air pollutants (Silva et al 2016a, Smith et al 2011, West et al 2013, Zhang et al 2016).
Table 3.
Estimated total co-benefits for avoided premature mortality in 2050 from PM2.5-related all-cause mortality and O3-related respiratory mortality (deaths yr−1). The values in parenthesis are 90% confidence intervals (CI). Co-benefits are estimated using RCP4.5 minus REF. Positive values indicate fewer deaths.
| PM2.5 | O3 | ||
|---|---|---|---|
| Emission | 15800 | 7600 | |
| (11500–20000) | (3400–11700) | ||
| Climate | 300 | 500 | |
| (200–400) | (200–700) | ||
| Total | 16000 | 8000 | |
| (11700–20300) | (3600–12400) | ||
| Domestic | 13600 | 3000 | |
| (9900–17300) | (1300–4700) | ||
| Foreign | 2400 | 5000 | |
| (1800–3100) | (2200–7800) | ||
| Industry | 2100 | 500 | |
| (1500–2700) | (200–800) | ||
| Domestic | Residential | 2800 | 200 |
| (2000–3600) | (100–300) | ||
| Energy | 1700 | 300 | |
| (1200–2200) | (100–500) |
Figure 2.
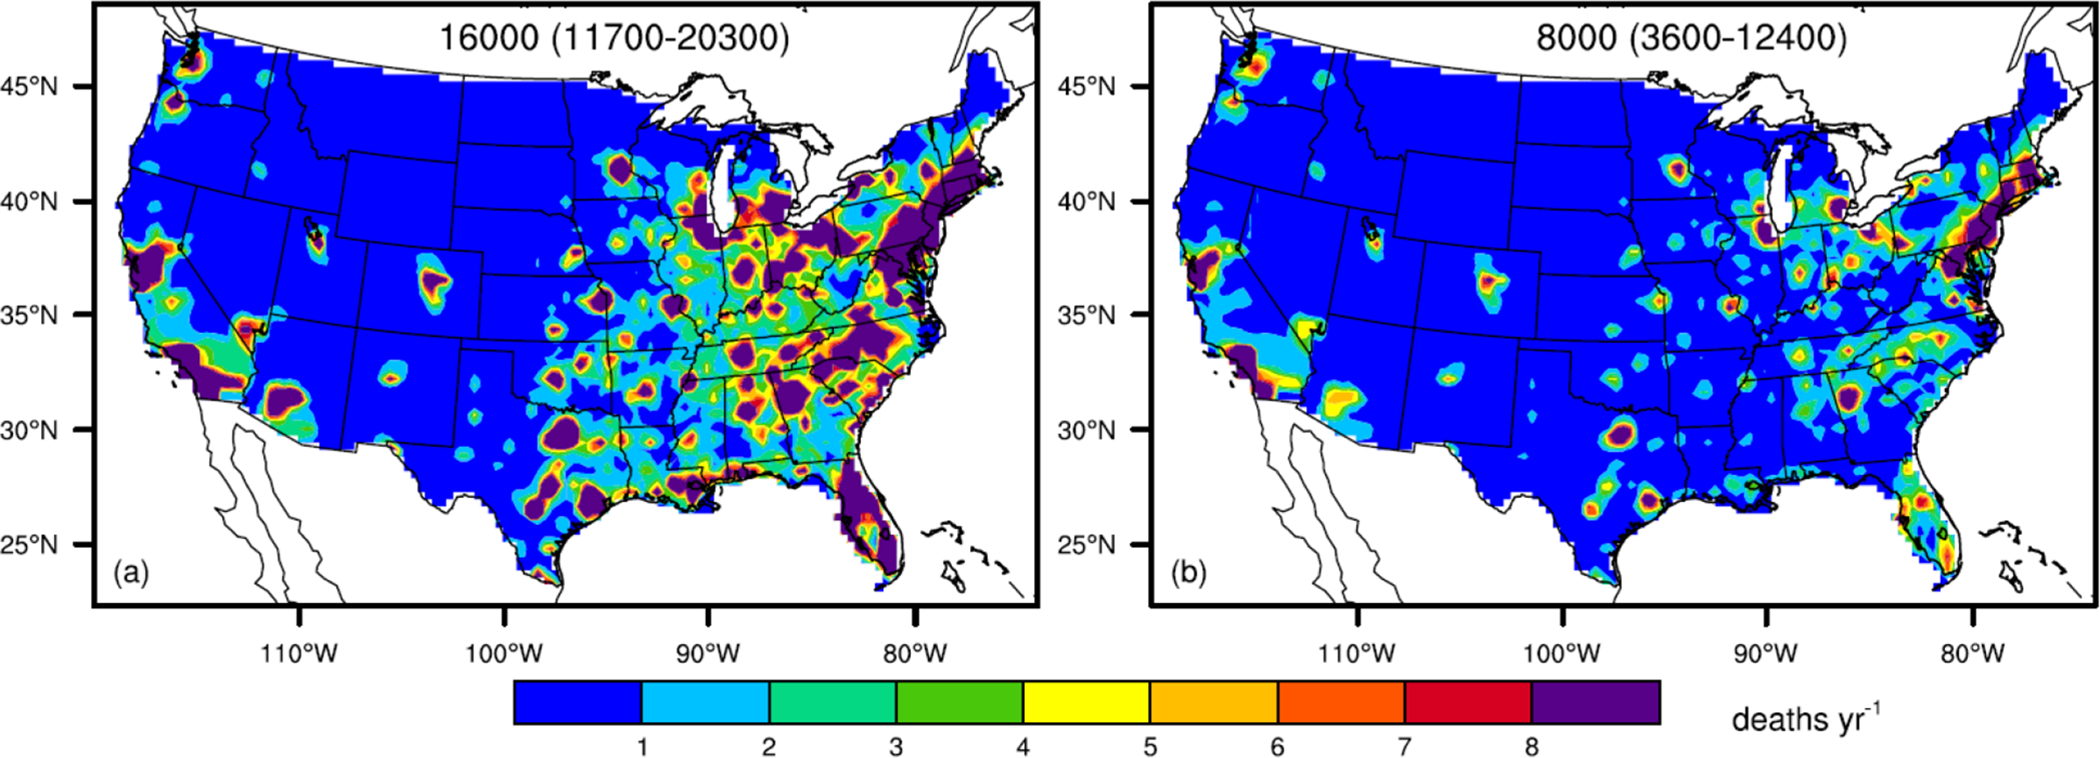
Total co-benefits (S_RCP45-S_REF) for avoided premature mortality (deaths yr−1) in the US in 2050, for (a) PM2.5 (all-cause mortality), and (b) O3 (respiratory mortality). Total avoided deaths and 90% confidence intervals are shown at the top of each panel. Positive values indicate fewer deaths.
We then compare the health results in this study with WEST2013 for the avoided deaths from 2000 to 2050 under the REF (S_REF-S_2000) and RCP4.5 (S_RCP45-S_2000) scenarios, and the total co-benefits in 2050 (S_RCP45-S_REF). Zhang et al (2016) concluded that future PM2.5 changes are greater using the regional CMAQ model simulations than those in WEST2013 for both REF (S_REF-S_2000) and RCP4.5 (S_RCP45-S_2000) scenarios, while the future O3 changes in 2050 were comparable between CMAQ and WEST2013. When quantifying human health impacts, figure 3 shows that the avoided premature mortality for PM2.5 for both REF and RCP4.5 relative to S_2000 are higher in this study than WEST2013, especially for CPD, which is consistent with the greater reductions in PM2.5 predicted here. The avoided premature mortality for O3 for both REF and RCP4.5 relative to S_2000 are comparable between this study and WEST2013. The total co-benefits for the population-weighted air quality changes are higher for WEST2013 (4.56 ppbv for O3 and 1.30 μg m−3 for PM2.5, Figure S26 and S29 in WEST2013) than our estimations using the regional model (3.02 ppbv for O3 and 0.84 μg m−3 for PM2.5, Table 3), but the estimated total co-benefits for avoided mortality are similar (Fig.3 in this paper). The fact that the total co-benefits for avoided deaths are comparable between this study and WEST2013, even though air quality changes are different, may be in part due to the use of county-level baseline mortality rates here vs. the national average of WEST2013. Note that the total avoided deaths from the sum of CPD (24300 deaths yr−1) and LC (3200 deaths yr−1) is larger than the co-benefits calculated for all-cause mortality, as the RRs for CPD (1.13, 95%CI:1.1–1.16) and LC (1.14, 95%CI:1.06–1.23) are greater than that for all-cause mortality (1.06, 95%CI:1.04–1.08) (Krewski et al 2009).
Figure 3.
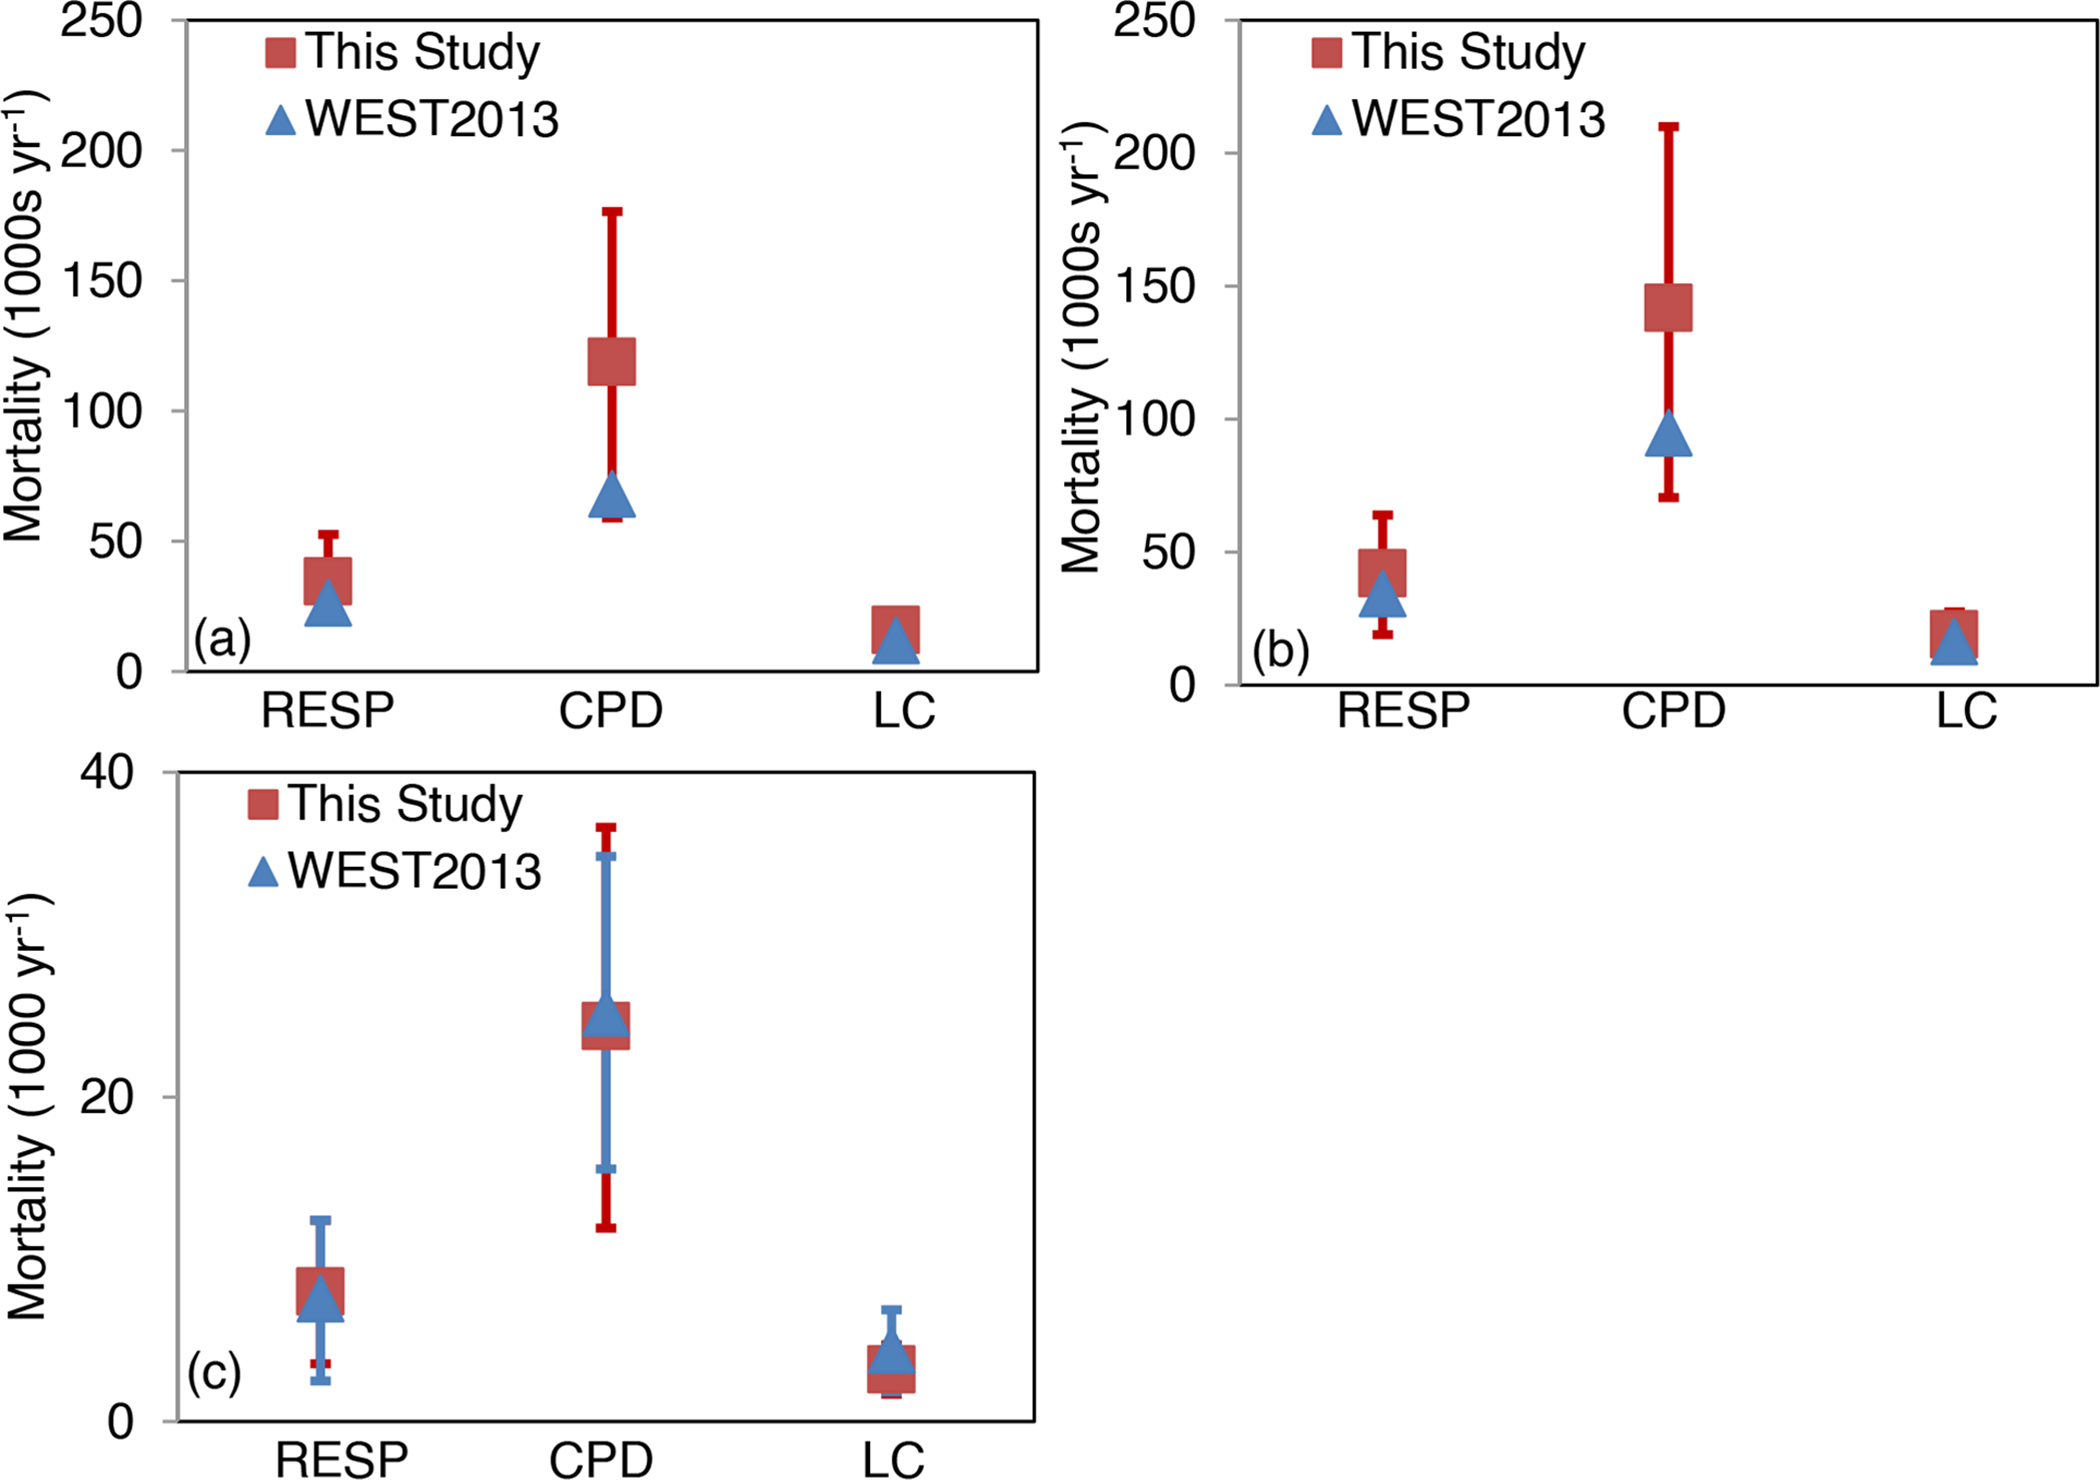
Comparisons between this study (red) and WEST2013 (blue) of the avoided human mortality in the US (1000 deaths yr−1) from air quality changes in 2050 compared with 2000, for (a) REF scenario, (b) RCP4.5 scenario, and (c) the total co-benefits in 2050. The red lines represent the 90% confidence intervals (CI) for this study, and blue lines are 95% CI for WEST2013. RESP indicates mortality from O3-related respiratory deaths, CPD for PM2.5-related cardiopulmonary deaths, and LC for PM2.5-related lung cancer.
We then separate the total co-benefits into the two mechanisms. The co-benefit of reductions in co-emitted air pollutants (the “emission co-benefit”) accounts for 98% of the total co-benefits (three-year population-weighted average of −0.84 μg m−3, table 2) for PM2.5, and 96% of the total (three-year population-weighted average of −3.02 ppb) for O3, consistent with WEST2013 and Zhang et al (2016). When calculating the co-benefits for human health, the emission co-benefit also dominates the total co-benefits, with 15800 (CI: 11500–20000) avoided deaths for PM2.5 (98% of the total), and 7600 (CI: 3400–11700) for O3 (94% of the total) (table 3; figure 4). The difference between the total co-benefit and the emission co-benefit is accounted for by the effect of slowing climate change and its effects on air quality (the “climate co-benefit”). Notice that the climate co-benefit is negative in some locations, e.g. the Northern states for PM2.5, and Southeast for O3, where slowing climate change can cause concentrations and air pollution-related deaths to decrease as a result of more precipitation and lower temperature (see figure 1 in Zhang et al 2016). For the climate co-benefits, we only simulate three years, which may reflect climate variability in addition to climate change (Deser et al 2012). However, since we estimate that the emission co-benefits are much greater than the climate co-benefits, we conclude that more years of simulations would not affect this conclusion.
Figure 4.
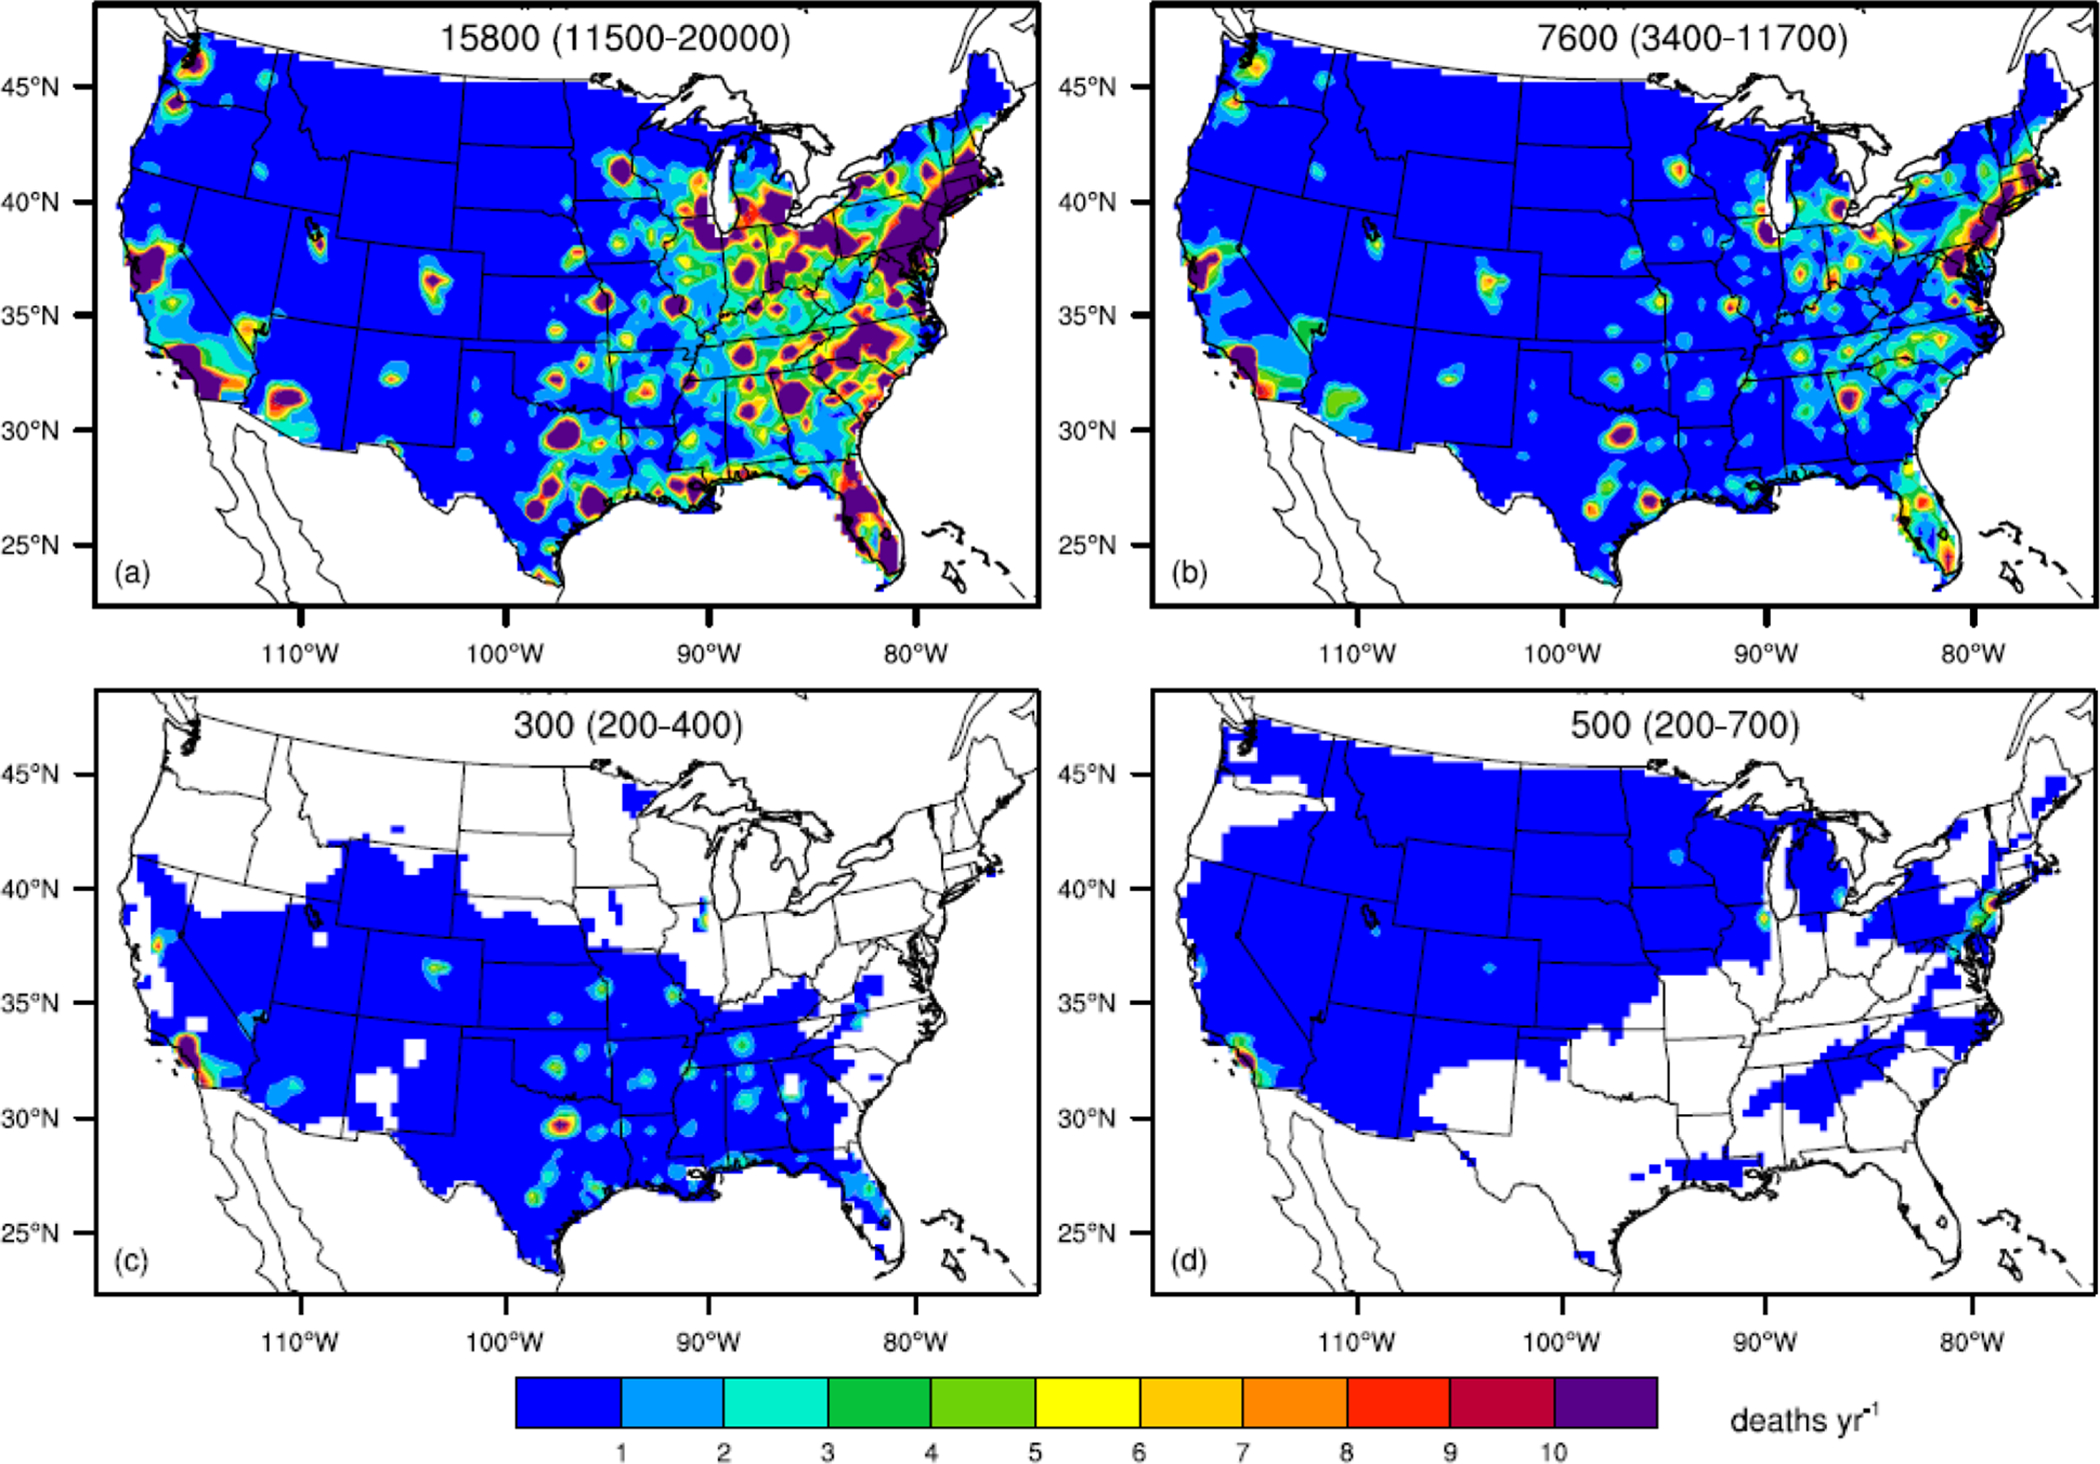
The emission co-benefits (a, b) and climate co-benefits (c, d) for avoided human mortality in 2050 (deaths yr−1) from PM2.5 (a, c) and O3 (b, d). White in panels c and d indicates increased mortality attributed to slowing climate change, from increases in air pollutant concentrations. Total avoided deaths and 90% confidence intervals are shown at the top of each panel. Positive values indicate fewer deaths.
GHG reductions from foreign countries account for 2400 avoided deaths (CI: 1800–3100) for PM2.5-related all-cause mortality, and 5000 (CI: 2200–7800) deaths for O3-related RESP, which are 15% and 62% of the total deaths for PM2.5 and O3 (table 3). Foreign GHG mitigation likewise contributes 15% (−0.13 μg m−3 for the three-year US population-weighted average) of the total air quality co-benefits for PM2.5, and 65% (−1.95 ppbv) of the total co-benefits for O3 (6-month ozone season of 1-hr daily maximum), emphasizing that PM2.5 is more influenced by emission reductions in US, while O3 is more influenced by the global methane reductions and intercontinental air pollutant transport (Zhang et al 2016). Foreign co-benefits for both PM2.5- and O3-related mortality are centred in urban areas (figure 5), where population density is high, even though foreign GHG mitigation reduces surface O3 pretty uniformly in the US (see supporting information figure S3). The contributions from domestic GHG mitigation on population-weighted average PM2.5 (85% of the total) and O3 (35%) are higher than those for the simple average (74% for PM2.5 and 27% for O3 in table 2), as air quality improvements from domestic GHG mitigation occur in densely-populated areas. CA has the largest human health benefits from foreign GHG mitigation, with 400 deaths (CI: 300–500) avoided from PM2.5-related all-cause mortality, and 800 deaths (CI: 400–1300) avoided from O3. We have calculated total, domestic, and foreign mortality co-benefits for each state (see supporting information tables S4 through S6). In quantifying the domestic co-benefits, we neglect the effect of US GHG mitigation on global climate change, and assume that global and regional climate will be controlled by foreign GHG emissions, which introduces a small error into our results. We also attribute the global methane concentration change to the effect of foreign GHG reductions, as US emissions are relatively small (6–10% of global emissions).
Figure 5.
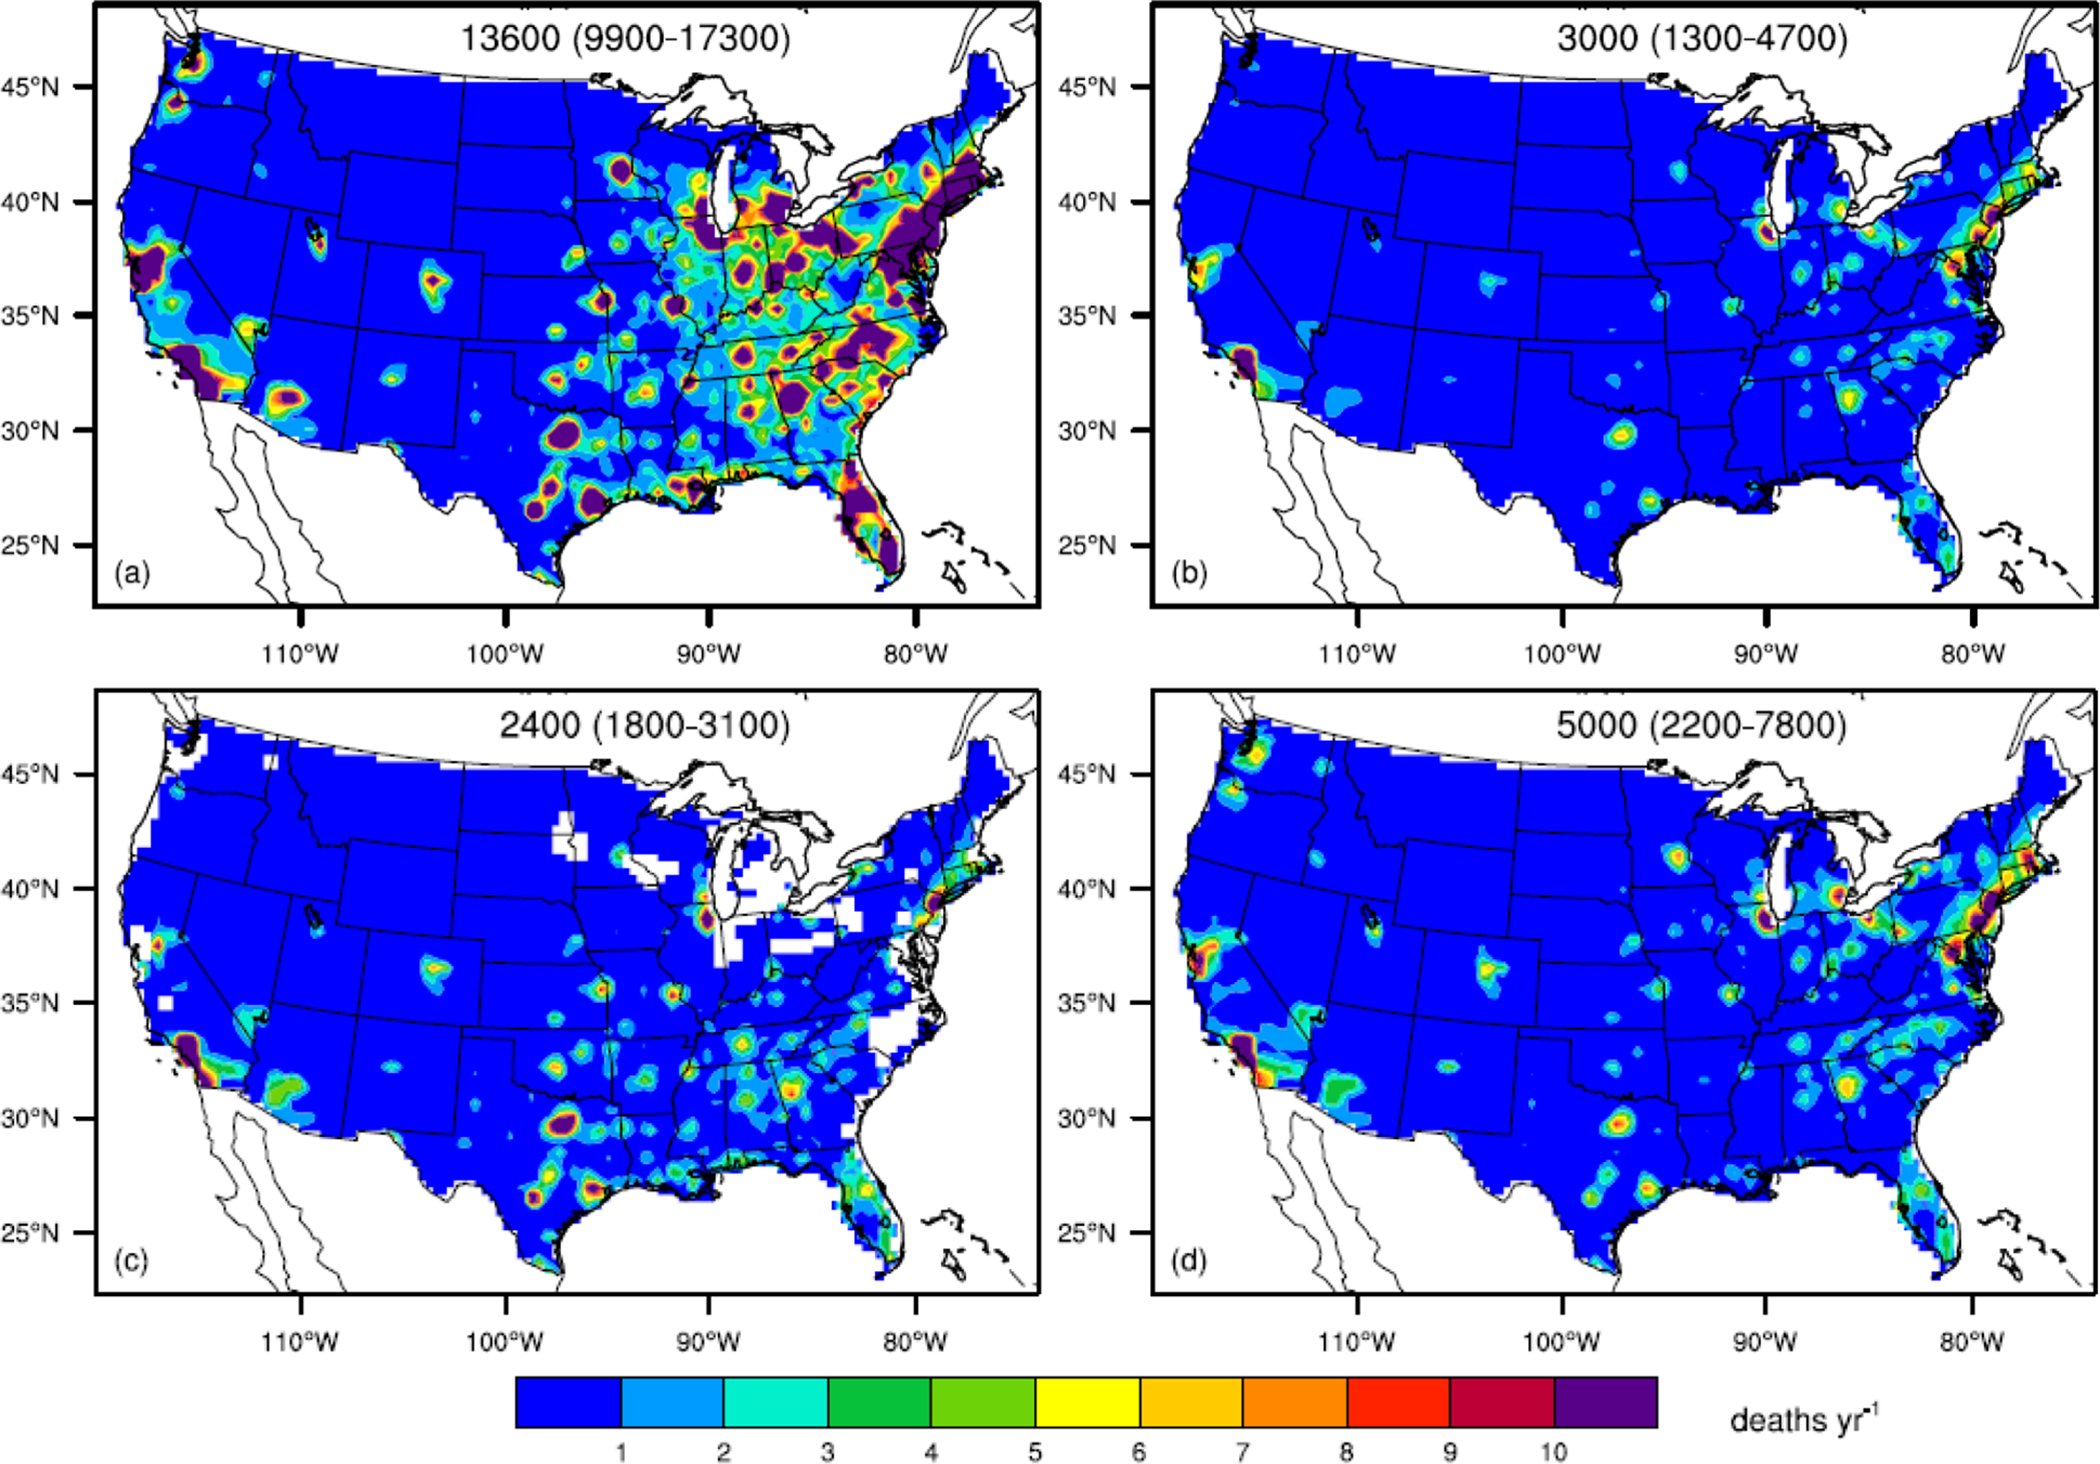
Domestic (a, b) and foreign co-benefits (c, d) for avoided all-cause mortality from PM2.5 (a, c) and respiratory disease from O3 (b, d) in the US in 2050. Total avoided deaths and 90% confidence intervals are shown at the top of each panel. Positive values indicate fewer deaths.
Among emission sectors, the residential sector has the largest co-benefits for PM2.5-related human health, avoiding 2800 deaths (CI: 2000–3600), accounting for 21% of the total domestic co-benefits for PM2.5, followed by industry (2100, CI: 1500–2700) and energy (1700, CI: 1300–2200). Residential also has the largest change in the population-weighted annual average PM2.5 (−0.15 μg m−3), even though its simple annual average change is comparable to that from the industry sector, demonstrating that residential emissions have a greater influence near where people live. GHG mitigation from industry has the largest effect on O3-related human health, avoiding 500 deaths (200–800) or 17% of the total domestic co-benefits for O3, followed by energy (300, CI:100–500), and residential (200, CI:100–300). The total air quality co-benefits for O3 are also highest in industry (population-weighted average of −0.20 ppb and simple average of −0.22 ppbv). These three sectors together account for 50% of the total avoided PM2.5-related deaths from domestic GHG reductions and 33% of the total avoided O3-related deaths, even though the sectors account for a larger fraction of emissions of most pollutants, possibly reflecting the smaller NMVOC emissions decreases from these sectors in RCP4.5. These findings of greater avoided deaths for residential GHG reductions suggest that residential sources might be targeted in policy efforts. Future research should attempt to evaluate air quality and health co-benefits for more specific GHG mitigation measures, including for other sources such as transportation, so that these co-benefits can be evaluated alongside the cost of GHG mitigation.
The total co-benefits of avoided premature mortality are monetized using high ($9.81 million) and low ($3.25 million) values of a statistical life (VSLs) for the US in 2050, as estimated by WEST2013 (in 2005 US$) based on projected income growth. Adding avoided mortality from O3 and PM2.5, and dividing monetized benefits by US CO2 reductions in 2050, we estimate monetized co-benefits in 2050 of $137 ($87 to $187) per ton CO2 reduced at a high VSL, and $45 ($29 to $62) per ton CO2 reduced at a low VSL, very similar to the 2050 estimates of WEST2013 for the US. As for WEST2013, these monetized estimates do not account for avoided deaths outside of the US. These benefits at high VSL exceed the full range of GHG marginal abatement cost estimates from 13 energy-economic models (West et al 2013), and at low VSL are greater than the median cost. Of these total co-benefits, foreign GHG reductions are responsible for monetized benefits of $42 ($23 to $62) per ton CO2 at high VSL, and $14 ($8 to $21) at low VSL, which is 31% of the total monetized benefits.
4. Conclusions
We quantify the co-benefits of global GHG mitigation under the RCP4.5 scenario on US air quality and human health in 2050 using dynamical downscaling. We find that 16000 (11700–20300) deaths yr−1 will be avoided for PM2.5-related all-cause mortality, and 8000 (3600–12400) deaths yr−1 will be avoided for O3-related respiratory mortality. When separating the total co-benefits into two mechanisms, the emission co-benefits have a larger impact than the climate co-benefits for both PM2.5 and O3, accounting for 98% and 94% of the total avoided deaths. Foreign GHG mitigation contributes 15% of the total PM2.5-related and 62% of the total O3-related deaths. Among the three domestic emission sectors with the greatest reductions in air pollutants under RCP4.5, residential has the highest co-benefits for PM2.5-related mortality, leading to a reduction of 2800 deaths, and industry has the highest co-benefits for O3, avoiding 500 deaths in the US. Monetized co-benefits of the GHG mitigation, accounting for avoided deaths from reductions in both PM2.5 and O3, are $137 ($87 to $187) per ton CO2 at a high VSL and $45 ($29 to $62) at a low VSL. Of these co-benefits, 31% come from the influence of foreign GHG reductions. These benefits likely exceed the marginal costs of GHG reductions in 2050.
Significant uncertainties exist in our results. For PM2.5, we compare the uncertainty for the future concentration change under RCP4.5 of −2.92±2.3% μg m−3 (−2.79±22.0% μg m−3 for the PM25 estimated as a sum of species) based on the spread of ACCMIP models (Silva et al 2013, Zhang et al 2016), and the uncertainty for the CRF is 0.0058±32.8%. For O3, the uncertainty for the future concentration change under RCP4.5 is −5.87±48.8% ppbv, and the uncertainty for the CRF is 0.0039±69.2%. Therefore, the uncertainty in the CRF likely contributes more to the overall uncertainty than the uncertainty in modeled concentration changes, although, for ozone, concentration uncertainty is of similar magnitude to the CRF uncertainty. When quantifying the avoided deaths from improved air quality, we only account for adults above 30. Additional uncertainty arises from downscaling from the global to the regional scale chemistry model, including the conversion of chemical mechanisms in the models, particularly from the addition of new inorganic species for primary PM2.5 (Zhang et al 2016). Different components of PM2.5 may have different effects on human health, like black carbon particles (Li et al 2015, Zanobetti and Schwartz 2009). However, we consider all of the components of PM2.5 to have equal toxicity. Only a single modelling system (AM3-WRF-SMOKE-CMAQ) is used in this study, and as pointed out previously (Post et al 2012, Silva et al 2013), results may differ among different models and ensembles of models can better characterize the range of results. Similarly, increasing the number of years simulated by the models used here can reduce uncertainty related to inter-annual variability (Deser et al 2012). Our conclusions are specific to the REF and GHG mitigation (RCP4.5) scenarios we choose, including their simulation of future emission pathways, which depend on economic drivers and air pollution control policies, and would differ for other scenarios. For example, the new Shared Socio-economic Pathways 4 (SSP4) have different climate policy assumptions considering economic, institutional and technological limitations (Rao et al 2017), and different emission reductions for co-emitted air pollutants in 2050 (supporting information table S4). We only account for the co-benefits from air quality changes due to the GHG mitigation, neglecting other impacts of climate change on health, like heat-waves, elevated temperatures, and infectious disease (Smith et al 2014). Despite these uncertainties, both those quantified and unquantified, our major conclusion that global GHG mitigation can have significant co-benefits for air quality and avoided mortality in the US is unlikely to be altered.
Future studies should estimate co-benefits at both the global and regional scales with finer-resolution air quality model simulations. Uncertainties could be reduced by improving emission estimates for multiple species, the chemical and aerosol mechanisms (CB05 and AE6), and using multi-year simulations and ensemble model experiments (Rao et al 2016). Future air pollutant reference-case emission trajectories are also uncertain (e.g., Rao et al 2017), and use of multiple future scenarios would also be valuable. Future studies should also evaluate benefits beyond health, such as for agriculture and energy. Previous studies have shown that using coarse resolution models tends to underestimate mortality near urban areas for PM2.5 (Punger and West 2013, Li et al 2015). Improving horizontal resolution in future studies can produce more robust estimates of health benefits, and may cause estimates to increase.
Previous studies have estimated co-benefits of GHG mitigation mainly on local, national, or continental scales (Bell et al 2008, Cifuentes et al 2001, Nemet et al 2010). These studies have presumed that most co-benefits are realized on those scales, and that the contributions of foreign GHG mitigation to total co-benefits would be small. Here we show that the US can gain significantly greater co-benefits for air quality and human health, especially for ozone, when coordinating its GHG emission reductions with concurrent reductions in other nations to combat global climate change. Similar results would also be expected for foreign countries, which will likely also benefit from GHG mitigation in other countries. Previous studies, which only estimate co-benefits from regional or local GHG mitigation may significantly underestimate the full co-benefits of coordinated global actions to mitigate climate.
Supplementary Material
5. Acknowledgements
This work was funded by the US Environmental Protection Agency STAR grant #834285, National Institute of Environmental Health Sciences grant #1 R21 ES022600-01, and NASA Health Air Quality Applied Sciences Team #NNX16AQ80G. The contents are solely the responsibility of the grantee and do not necessarily represent the official views of the US EPA or other funding sources. We also thank the three anonymous reviewers for their thoughtful comments and suggestions which make the paper more complete.
References
- Anenberg SC, West JJ, Fiore AM, Jaffe DA, Prather M, Bergmann D, Cuvelier K and Dentener FJ 2009. Intercontinental Impacts of Ozone Pollution on Human Mortality Environ. Sci. Technol 43 6482–7 [DOI] [PubMed] [Google Scholar]
- Anenberg SC, West JJ, Yu H, Chin M, Schulz M, Bergmann D, Bey I, Bian H, Diehl T, Fiore AM, Hess P, Marmer E, Montanaro V, Park R, Shindell D, Takemura T and Dentener F 2014. Impacts of intercontinental transport of anthropogenic fine particulate matter on human mortality Air Qual. Atmos. Heal 7 369–79 [Google Scholar]
- Bell ML, Goldberg R, Hogrefe C, Kinney PL, Knowlton K, Lynn B, Rosenthal J, Rosenzweig C and Patz JA 2007. Climate change, ambient ozone, and health in 50 US cities Clim. Change 82 61–76 [Google Scholar]
- Bell ML, Davis DL, Cifuentes LA, Krupnick AJ, Morgenstern RD and Thurston GD 2008. Ancillary human health benefits of improved air quality resulting from climate change mitigation Environ. Health 7 41. [DOI] [PMC free article] [PubMed] [Google Scholar]
- Bowden JH, Otte TL, Nolte CG and Otte MJ 2012. Examining Interior Grid Nudging Techniques Using Two-Way Nesting in the WRF Model for Regional Climate Modeling J. Clim 25 2805–23 [Google Scholar]
- Bowden JH, Nolte CG and Otte TL 2013. Simulating the impact of the large-scale circulation on the 2-m temperature and precipitation climatology Clim. Dyn 40 1903–20 [Google Scholar]
- Byun D and Schere KL 2006. Review of the Governing Equations, Computational Algorithms, and Other Components of the Models-3 Community Multiscale Air Quality (CMAQ) Modeling System Appl. Mech. Rev 59 51 [Google Scholar]
- Caiazzo F, Ashok A, Waitz IA, Yim SHL and Barrett SRH 2013. Air pollution and early deaths in the United States. Part I: Quantifying the impact of major sectors in 2005 Atmos. Environ 79 198–208 [Google Scholar]
- Capps SL, Driscoll CT, Fakhraei H, Templer PH, Craig KJ, Milford JB and Lambert KF 2016. Estimating potential productivity cobenefits for crops and trees from reduced ozone with U.S. coal power plant carbon standards J. Geophys. Res 121 14,679–14,90 [Google Scholar]
- Clarke LE, Edmonds JA, Jacoby HD, Pitcher HM, Reilly JM and Richels RG 2007. Scenarios of Greenhouse Gas Emissions and Atmospheric Concentrations Program 2011 164 [Google Scholar]
- Cifuentes L, Borja-aburto VH, Gouveia N, Thurston G and Davis DL 2001. Hidden Health Benefits of Greenhouse Gas Mitigation Science 293 1257–9 [DOI] [PubMed] [Google Scholar]
- Chuwah C, Noije TV, Vuuren D P. v, Stehfest E, Hazeleger W 2015. Global impacts of surface ozone changes on crop yields and land use Atmos. Environ 106 11–23 [Google Scholar]
- Deser C, Knutti R, Solomon S and Phillips AS 2012. Communication of the Role of Natural Variability in Future North American Climate Nat. Clim. Chang 2 1–19 [Google Scholar]
- Donner LJ, Wyman BL, Hemler RS, Horowitz LW, Ming Y, Zhao M, Golaz JC, Ginoux P, Lin SJ, Schwarzkopf MD, Austin J, Alaka G, Cooke WF, Delworth TL, Freidenreich SM, Gordon CT, Griffies SM, Held IM, Hurlin WJ, Klein SA, Knutson TR, Langenhorst AR, Lee HC, Lin Y, Magi BI, Malyshev SL, Milly PCD, Naik V, Nath MJ, Pincus R, Ploshay JJ, Ramaswamy V, Seman CJ, Shevliakova E, Sirutis JJ, Stern WF, Stouffer RJ, Wilson RJ, Winton M, Wittenberg AT and Zeng F 2011. The dynamical core, physical parameterizations, and basic simulation characteristics of the atmospheric component AM3 of the GFDL global coupled model CM3 J. Clim 24 3484–519 [Google Scholar]
- Driscoll CT, Buonocore JJ, Levy JI, Lambert KF, Burtraw D, Reid SB, Fakhraei H and Schwartz J 2015. US power plant carbon standards and clean air and health co-benefits Nat. Clim. Chang 5 535–40 [Google Scholar]
- Duncan BN, West JJ, Yoshida Y, Fiore AM and Ziemke JR 2008. The influence of European pollution on ozone in the Near East and northern Africa Atmos. Chem. Phys 8 2267–83 [Google Scholar]
- Fang Y, Mauzerall DL, Liu J, Fiore AM and Horowitz LW 2013. Impacts of 21st century climate change on global air pollution-related premature mortality Clim. Change 121 239–53 [Google Scholar]
- Fann N, Baker KR and Fulcher CM 2012. Characterizing the PM2.5-related health benefits of emission reductions for 17 industrial, area and mobile emission sectors across the U.S. Environ. Int 49 141–51 [DOI] [PubMed] [Google Scholar]
- Fann N, Fulcher CM and Baker K 2013. The recent and future health burden of air pollution apportioned across U.S. sectors Environ. Sci. Technol 47 3580–9 [DOI] [PubMed] [Google Scholar]
- Fann N, Nolte CG, Dolwick P, Spero TL, Brown AC, Phillips S and Anenberg S 2015. The geographic distribution and economic value of climate change-related ozone health impacts in the United States in 2030 J. Air Waste Manage. Assoc 65 570–80 [DOI] [PubMed] [Google Scholar]
- Fiore AM, Naik V, Spracklen DV, Steiner A, Unger N, Prather M, Bergmann D, Cameron-Smith PJ, Cionni I, Collins WJ, Dalsøren S, Eyring V, Folberth GA, Ginoux P, Horowitz LW, Josse B, Lamarque J-F, MacKenzie IA, Nagashima T, O’Connor FM, Righi M, Rumbold ST, Shindell DT, Skeie RB, Sudo K, Szopa S, Takemura T and Zeng G 2012. Global air quality and climate. Chem. Soc. Rev 41 6663–83 [DOI] [PubMed] [Google Scholar]
- Fiore AM, Naik V and Leibensperger EM 2015. Air Quality and Climate Connections J. Air Waste Manage. Assoc 65 645–85 [DOI] [PubMed] [Google Scholar]
- Friel S, Dangour AD, Garnett T, Lock K, Chalabi Z, Roberts I, Butler A, Butler CD, Waage J, McMichael AJ and Haines A 2009. Public health benefits of strategies to reduce greenhouse-gas emissions: food and agriculture The Lancet 374 2016–25 [DOI] [PubMed] [Google Scholar]
- Houyoux MR, Vukovich JM, Coats CJ, Wheeler NJM and Kasibhatla PS 2000. Emission inventory development and processing for the Seasonal Model for Regional Air Quality (SMRAQ) project J. Geophys. Res 105 9079 [Google Scholar]
- Hughes BB, Kuhn R, Peterson CM, Rothman DS, Solórzano JR, Mathers CD and Dickson JR 2011. Projections of global health outcomes from 2005 to 2060 using the International Futures integrated forecasting model Bull. World Health Organ 89 478–86 [DOI] [PMC free article] [PubMed] [Google Scholar]
- Jiang X, Hong C, Zheng Y, Zheng B, Guan D, Gouldson A, Zhang Q and He K 2015. To what extent can China’s near-term air pollution control policy protect air quality and human health? A case study of the Pearl River Delta region Environ. Res. Lett 10 104006 [Google Scholar]
- Jerrett M, Burnett RT, Pope CA, Ito K, Thurston G, Krewski D, Shi Y, Calle E and Thun M 2009. Long-term ozone exposure and mortality N. Engl. J. Med 360 1085–95 [DOI] [PMC free article] [PubMed] [Google Scholar]
- Jacob DJ and Winner DA 2009. Effect of climate change on air quality Atmos. Environ 43 51–63 [Google Scholar]
- Jakob M 2006. Marginal costs and co-benefits of energy efficiency investments Energy Policy 34 172–87 [Google Scholar]
- Krewski D, Jerrett M, Burnett RT, Ma R, Hughes E, Shi Y, Turner MC, Pope III CA, Thurston G, Calle EE, Thun MJ, Beckerman B, DeLuca P, Finkelstein N, Ito K, Moore DK, Newbold KB, Ramsay T, Ross Z, Shin H and Tempalski B 2009. Extended follow-up and spatial analysis of the American Cancer Society study linking particulate air pollution and mortality Res Rep Heal. Eff Inst 140 5–36 [PubMed] [Google Scholar]
- Kim Y-M, Zhou Y, Gao Y, Fu JS, Johnson BA, Huang C and Liu Y 2015. Spatially resolved estimation of ozone-related mortality in the United States under two Representative Concentration Pathways (RCPs) and their uncertainty. Clim. Change 128 71–84 [DOI] [PMC free article] [PubMed] [Google Scholar]
- Laden F, Schwartz J, Speizer FE and Dockery DW 2006. Reduction in fine particulate air pollution and mortality: Extended follow-up of the Harvard Six Cities study Am. J. Respir. Crit. Care Med 173 667–72 [DOI] [PMC free article] [PubMed] [Google Scholar]
- Lepeule J, Laden F, Dockery D and Schwartz J 2012. Chronic exposure to fine particles and mortality: An extended follow-up of the Harvard six cities study from 1974 to 2009 Environ. Health Perspect 120 965–70 [DOI] [PMC free article] [PubMed] [Google Scholar]
- Lelieveld J, Evans JS, Fnais M, Giannadaki D and Pozzer A 2015. The contribution of outdoor air pollution sources to premature mortality on a global scale Nature 525 367–71 [DOI] [PubMed] [Google Scholar]
- Li Y, Henze DK, Jack D and Kinney PL 2015. The influence of air quality model resolution on health impact assessment for fine particulate matter and its components Air Qual. Atmos. Heal 9 51–68 [DOI] [PMC free article] [PubMed] [Google Scholar]
- Li Y, Henze DK, Jack D, Henderson BH and Kinney PL 2016. Assessing public health burden associated with exposure to ambient black carbon in the United States Sci. Total Environ 539 515–25 [DOI] [PMC free article] [PubMed] [Google Scholar]
- Liu J, Mauzerall DL and Horowitz LW 2009. Evaluating inter-continental transport of fine aerosols:(2) Global health impact Atmos. Environ 43 4339–47 [Google Scholar]
- Markandya A, Armstrong BG, Hales S, Chiabai A, Criqui P, Mima S, Tonne C and Wilkinson P 2009. Public health benefits of strategies to reduce greenhouse-gas emissions: low-carbon electricity generation The Lancet 374 2006–15 [DOI] [PubMed] [Google Scholar]
- McCollum DL, Krey V, Riahi K, Kolp P, Grubler A, Makowski M and Nakicenovic N 2013. Climate policies can help resolve energy security and air pollution challenges Climatic Change 119 479–94 [Google Scholar]
- Morita H, Yang S, Unger N and Kinney PL 2014. Global health impacts of future aviation emissions under alternative control scenarios Environ. Sci. Technol 48 14659–67 [DOI] [PMC free article] [PubMed] [Google Scholar]
- Naik V, Horowitz LW, Fiore AM, Ginoux P, Mao J, Aghedo AM and Levy H 2013. Impact of preindustrial to present-day changes in short-lived pollutant emissions on atmospheric composition and climate forcing J. Geophys. Res. Atmos 118 8086–110 [Google Scholar]
- Nemet GF, Holloway T and Meier P 2010. Implications of incorporating air-quality co-benefits into climate change policymaking Environ. Res. Lett 5 014007 [Google Scholar]
- Otte TL, Nolte CG, Otte MJ and Bowden JH 2012. Does Nudging Squelch the Extremes in Regional Climate Modeling? J. Clim 25 7046–66 [Google Scholar]
- Plachinski SD, Holloway T, Meier PJ, Nemet GF, Rrushaj A, Oberman JT, Duran PL and Voigt CL 2014. Quantifying the emissions and air quality co-benefits of lower-carbon electricity production Atmos. Environ 94 180–91 [Google Scholar]
- Post ES, Grambsch A, Weaver C, Morefield P, Huang J, Leung LY, Nolte CG, Adams P, Liang XZ, Zhu JH and Mahoney H 2012. Variation in estimated ozone-related health impacts of climate change due to modeling choices and assumptions Environ. Health Perspect 120 1559–64 [DOI] [PMC free article] [PubMed] [Google Scholar]
- Punger EM and West JJ 2013. The effect of grid resolution on estimates of the burden of ozone and fine particulate matter on premature mortality in the USA Air Qual. Atmos. Heal 6 563–73 [DOI] [PMC free article] [PubMed] [Google Scholar]
- Rao S, Klimont Z, Leitao J, Riahi K, van Dingenen R, Reis LA, Calvin K, Dentener F, Drouet L, Fujimori S, Harmsen M, Luderer G, Heyes C, Strefler J, Tavoni M and van Vuuren DP 2016. A multi-model assessment of the co-benefits of climate mitigation for global air quality Environ. Res. Lett 11 124013 [Google Scholar]
- Rao S, Klimont Z, Smith SJ, Van Dingenen R, Dentener F, Bouwman L, Riahi K, Amann M, Bodirsky BL, van Vuuren DP, Aleluia Reis L, Calvin K, Drouet L, Fricko O, Fujimori S, Gernaat D, Havlik P, Harmsen M, Hasegawa T, Heyes C, Hilaire J, Luderer G, Masui T, Stehfest E, Strefler J, van derSluis S and Tavoni M 2017. Future air pollution in the Shared Socio-economic Pathways Global Environmental Change 42 346–58 [Google Scholar]
- RTI International 2015. BenMAP-CE: Environmental Benefits Mapping and Analysis Program-Community Edition, User’s Manual Appendices Available from RTI International, http://www2.epa.gov/benmap/manual-and-appendices-benmap-ce, [1 December 2015]
- Selin NE, Wu S, Nam KM, Reilly JM, Paltsev S, Prinn RG and Webster MD 2009. Global health and economic impacts of future ozone pollution Environ. Res. Lett 4 044014 [Google Scholar]
- Smith KR, Woodward A, Campbell-Lendrum D, Chadee DD, Honda Y, Liu Q, Olwoch JM, Revich B, and Sauerborn R 2014. Human health: impacts, adaptation, and co-benefits. In: Climate Change 2014: Impacts, Adaptation, and Vulnerability. Part A: Global and Sectoral Aspects. Contribution of Working Group II to the Fifth Assessment Report of the Intergovernmental Panel on Climate Change Cambridge University Press, Cambridge, United Kingdom and New York, NY, USA, pp. 709–754. [Google Scholar]
- Smith SJ, West JJ, Kyle P 2011. Economically consistent long-term scenarios for air pollutant and greenhouse gas emissions Clim. Chang 108 619–627 [Google Scholar]
- Skamarock WC and Klemp JB 2008. A time-split nonhydrostatic atmospheric model for weather research and forecasting applications J. Comput. Phys 227 3465–85 [Google Scholar]
- Silva RA, West JJ, Zhang Y, Anenberg SC, Lamarque J-F, Shindell DT, Collins WJ, Dalsoren S, Faluvegi G, Folberth G, Horowitz LW, Nagashima T, Naik V, Rumbold S, Skeie R, Sudo K, Takemura T, Bergmann D, Cameron-Smith P, Cionni I, Doherty RM, Eyring V, Josse B, MacKenzie IA, Plummer D, Righi M, Stevenson DS, Strode S, Szopa S and Zeng G 2013. Global premature mortality due to anthropogenic outdoor air pollution and the contribution of past climate change Environ. Res. Lett 8 34005 [Google Scholar]
- Silva RA, West JJ, Lamarque JF, Shindell DT, Collins WJ, Dalsoren S, Faluvegi G, Folberth G, Horowitz LW, Nagashima T, Naik V, Rumbold ST, Sudo K, Takemura T, Bergmann D, Cameron-Smith P, Cionni I, Doherty RM, Eyring V, Josse B, MacKenzie IA, Plummer D, Righi M, Stevenson DS, Strode S, Szopa S and Zengast G 2016a. The effect of future ambient air pollution on human premature mortality to 2100 using output from the ACCMIP model ensemble Atmos. Chem. Phys 16 9847–62 [DOI] [PMC free article] [PubMed] [Google Scholar]
- Silva RA, Adelman Z, Fry MM and West JJ 2016b. The Impact of Individual Anthropogenic Emissions Sectors on the Global Burden of Human Mortality due to Ambient Air Pollution Environ. Health Perspect 1776 1776–84 [DOI] [PMC free article] [PubMed] [Google Scholar]
- Sun J, Fu JS, Huang K and Gao Y 2015. Estimation of future PM2.5- and ozone-related mortality over the continental United States in a changing climate: An application of high-resolution dynamical downscaling technique J. Air Waste Manage. Assoc 65 611–23 [DOI] [PubMed] [Google Scholar]
- Tagaris E, Liao K-J, DeLucia AJ, Deck L, Amar P and Russell AG 2009. Potential Impact of Climate Change on Air Pollution-Related Human Health Effects Environ. Sci. Technol 43 4979–88 [DOI] [PubMed] [Google Scholar]
- Thompson TM, Rausch S, Saari RK and Selin NE 2014. A systems approach to evaluating the air quality co-benefits of US carbon policies Nat. Clim. Chang 4 917–23 [Google Scholar]
- Thomson AM, Calvin KV, Smith SJ, Kyle GP, Volke A, Patel P, Delgado-Arias S, Bond-Lamberty B, Wise MA, Clarke LE and Edmonds JA 2011. RCP4.5: A pathway for stabilization of radiative forcing by 2100 Clim. Change 109 77–94 [Google Scholar]
- Trail MA, Tsimpidi AP, Liu P, Tsigaridis K, Hu Y, Rudokas JR, Miller PJ, Nenes A and Russell AG 2015. Impacts of Potential CO2-Reduction Policies on Air Quality in the United States Environ. Sci. Technol 49 5133–41 [DOI] [PubMed] [Google Scholar]
- US Environmental Protection Agency 2009. Final Report: Integrated Science Assessment for Particulate Matter U.S. Environmental Protection Agency, Washington, DC, EPA/600/R-08/139F, 2009. [PubMed] [Google Scholar]
- US Environmental Protection Agency 2013. Final Report: Integrated Science Assessment of Ozone and Related Photochemical Oxidants US Environmental Protection Agency, Washington, DC, EPA/600/R-10/076F, 2013. [Google Scholar]
- US Environmental Protection Agency 2014. Environmental Benefits Mapping and Analysis Program—Community Edition (BenMAP-CE) (Research Triangle Park, NC. http://www2.epa.gov/benmap) [Google Scholar]
- Weaver CP, Cooter E, Gilliam R, Gilliland a., Grambsch a., Grano D, Hemming B, Hunt SW, Nolte C, Winner D a., Liang X-Z, Zhu J, Caughey M, Kunkel K, Lin J-T, Tao Z, Williams a., Wuebbles DJ, Adams PJ, Dawson JP, Amar P, He S, Avise J, Chen J, Cohen RC, Goldstein a. H, Harley R a., Steiner a. L, Tonse S, Guenther a., Lamarque J-F, Wiedinmyer C, Gustafson WI, Leung LR, Hogrefe C, Huang H-C, Jacob DJ, Mickley LJ, Wu S, Kinney PL, Lamb B, Larkin NK, McKenzie D, Liao K-J, Manomaiphiboon K, Russell a. G, Tagaris E, Lynn BH, Mass C, Salathé E, O’neill SM, Pandis SN, Racherla PN, Rosenzweig C and Woo J-H 2009. A Preliminary Synthesis of Modeled Climate Change Impacts on U.S. Regional Ozone Concentrations Bull. Am. Meteorol. Soc 90 1843–63 [Google Scholar]
- West JJ, Fiore AM, Horowitz LW and Mauzerall DL 2006. Global health benefits of mitigating ozone pollution with methane emission controls. Proc. Natl. Acad. Sci. U. S. A 103 3988–93 [DOI] [PMC free article] [PubMed] [Google Scholar]
- West JJ, Szopa S and Hauglustaine DA 2007. Human mortality effects of future concentrations of tropospheric ozone Comptes Rendus Geosci 339 775–83 [Google Scholar]
- West JJ, Naik V, Horowitz LW and Fiore AM 2009. Effect of regional precursor emission controls on long-range ozone transport – Part 2: steady-state changes in ozone air quality and impacts on human mortality Atmos. Chem. Phys 9 6095–107 [Google Scholar]
- West JJ, Smith SJ, Silva RA, Naik V, Zhang Y, Adelman Z, Fry MM, Anenberg S, Horowitz LW and Lamarque J-F 2013. Co-benefits of Global Greenhouse Gas Mitigation for Future Air Quality and Human Health Nat. Clim. Chang 3 885–9 [DOI] [PMC free article] [PubMed] [Google Scholar]
- Wilkinson P, Smith KR, Davies M, Adair H, Armstrong BG, Barrett M, Bruce N, Haines A, Hamilton I, Oreszczyn T, Ridley I, Tonne C and Chalabi Z 2009. Public health benefits of strategies to reduce greenhouse-gas emissions: household energy The Lancet 374 1917–29 [DOI] [PubMed] [Google Scholar]
- Woodcock J, Edwards P, Tonne C, Armstrong BG, Ashiru O, Banister D, Beevers S, Chalabi Z, Chowdhury Z, Cohen A, Franco OH, Haines A, Hickman R, Lindsay G, Mittal I, Mohan D, Tiwari G, Woodward A and Roberts I 2009. Public health benefits of strategies to reduce greenhouse-gas emissions: urban land transport The Lancet 374 1930–43 [DOI] [PubMed] [Google Scholar]
- Woods and Poole Economics Inc 2012. Complete Demographic Database Washington, DC:W&P Economics Inc. [Google Scholar]
- Yim SHL, Lee GL, Lee IH, Allroggen F, Ashok A, Caiazzo F, Eastham SD, Malina R and Barrett SRH 2015. Global, regional and local health impacts of civil aviation emissions Environ. Res. Lett 10 034001 [Google Scholar]
- Zanobetti A and Schwartz J 2009. The effect of fine and coarse particulate air pollution on mortality: a national analysis. Environ. Health Perspect 117 898–903 [DOI] [PMC free article] [PubMed] [Google Scholar]
- Zhang Y, Bowden JH, Adelman Z, Naik V, Horowitz LW, Smith SJ and West JJ 2016. Co-benefits of global and regional greenhouse gas mitigation on US air quality in 2050 Atmos. Chem. Phys 16 9533–48 [DOI] [PMC free article] [PubMed] [Google Scholar]
Associated Data
This section collects any data citations, data availability statements, or supplementary materials included in this article.