Abstract
In December, 2019 in Wuhan city of China, a novel coronavirus (SARS-CoV-2) has garnered global attention due to its rapid transmission. World Health Organization (WHO) termed the infection as Coronavirus Disease 2019 (COVID-19) after phylogenic studies with SARS-CoV. The virus causes severe respiratory infections with dry cough, high fever, body ache and fatigue. The virus is primarily transmitted among people through respiratory droplets from COVID-19 infected person. WHO declared this COVID-19 outbreak a pandemic and since February, 2020 affected countries have locked down their cities, industries and restricted the movement of their citizens to minimize the spread of the virus. In spite of the negative aspects of coronavirus on the globe, the coronavirus crises brought a positive impact on the natural environment. Countries where the movement of citizens was seized to stop the spread of coronavirus infection have experienced a noticeable decline in pollution and greenhouse gases emission. Recent research also indicated that this COVID-19-induced lockdown has reduced the environmental pollution drastically worldwide. In this review, we have discussed some important positive impacts of coronavirus on environmental quality by compiling the recently published data from research articles, NASA (National Aeronautics and Space Administration) and ESA (European Space Agency).
Keywords: COVID-19, Air pollution, NO2 emission, Carbon emission, Ozone layer, Water quality
Introduction
An acute respiratory infection of unknown origin was first reported in December, 2019, in Wuhan, China (Singhal 2020), called novel coronavirus infected pneumonia (NCIP) (Wang et al. 2020). Later on the pathogen was identified as a novel enveloped RNA ß-coronavirus, through the use of unbiased sequencing (Zahra et al. 2020), which was of similar phylogeny to SARS-CoV (Lai et al. 2020). On January 12, 2020, WHO named this new virus as the 2019 novel coronavirus (2019-nCoV) (Lu et al. 2020a, b). On January 30, 2020, WHO announced this virus as a global pandemic (Zhang et al. 2020). On February 11, 2020, WHO named the novel disease as Corona Virus Disease 2019 (COVID-19). The Coronavirus Study Group (CSG) named this virus as severe acute respiratory syndrome coronavirus 2 (SARS-CoV-2) (Gorbalenya et al. 2020).
The SARS-CoV-2 can affect the respiratory tract including nose, mouth, throat, sinuses and lungs (Wölfel et al. 2020). Human-to-human and human-to-animal transmissions have been presumed for this virus (Graham and Baric 2010). Respiratory droplets of the infected person are the most likely tools of transmission. These droplets carry the virus into the air and can enter into a host body through nose and mouth. The virus causes inflammation in lungs which damage the pulmonary cells by initiating an inflammatory reaction. Vomiting, diarrhea, fatigue and high fever may develop with severe inflammation (Dong et al. 2020). Inflammatory fluid produced as a result of inflammation fill the lungs, resulting in coughing and difficulty in breathing by reducing the function of alveoli. The oxygen level in the blood may drop while other organs such as kidneys or the heart might be affected in severe cases (Geier and Geier 2020; Inciardi et al. 2020).
The origin of this infection was Wuhan city from where it spreads to the rest of the world (Lu et al. 2020a, b). This disease has pretended a significant threat to the health and economy of the world. Thousands of people have already been died from this infection while millions are still facing the illness. According to WHO, till 16th of May, 2020 around 4.62 million active cases and more than 0.3 million deaths have been reported due to COVID-19 worldwide. The current reports suggest that the vast majority of deaths from the virus were of people who were suffering from other health issues like kidney problems, heart problems and diabetes etc. (Li et al. 2020; Palmer 2020; Richardson et al. 2020). COVID-19 is the second largest pandemic of the twenty-first century and has led to the largest quarantine in human history after the Middle East Respiratory Syndrome (MERS) (Zowalaty and Järhult 2020). Bustling cities have turned into ghost towns, public squares, where communities were converging for centuries are almost empty, and millions of people are under lockdown all over the world.
The quarantine imposed due to COVID-19 is unprecedented in human history as all the markets are shutdown, places of worships are closed, public gathering is banned, travel restrictions have been imposed, construction work halted and economy as well as stock exchange crashed worldwide. But from climate perspective the coronavirus pandemic brings about many positive aspects which the world is witnessing during the lockdown. Drastic quarantine measures implemented by the government authorities across the world resulted in a significant change in environment which is a good sign for the deadly global environmental crises, e.g. emission of greenhouse gases and ozone layer depletion. In this review we have highlighted some positive aspects of COVID-19-induced lockdown on the environment and suggested some strategies to prevent reversion of air and water pollution.
Positive impacts/aspects of COVID-19 pandemic
Humanity retreats indoors and the non-human natural world rumbles out liberated. Notoriously dirty, the waterways and rivers in the world look cleaner, the air fresher, the smog gone, the haze dispersed and the wildlife has filled the open spaces, coronavirus lockdowns across the world seem to have a number of positive effects on the environment. Millions of the people have been cooped up indoors but the natural world outside has continued to rumble on and the natural world is benefiting from our absence. Here, we have discussed some important positive impacts of the COVID-19-induced lockdown on environmental quality by compiling the recently published data from research articles, NASA (National Aeronautics and Space Administration) and ESA (European Space Agency).
Air quality and climate
The World Health Organization (WHO) estimated that the outdoor air pollution kills 7 million people each year worldwide and more than 80% urban population is exposed to unhealthy air (WHO 2020). Since people stayed home, these last few months have paved significant improvement in air quality, especially in hard-hit areas like Wuhan, as well as in northern Italy and a number of metropolitan areas throughout the USA. In China, emissions of harmful gases and other pollutants dropped 25% at the start of the year 2020 and the quality of air improved up to 11.4% with respect to start of the last year, in 337 cities across China. WHO estimated that this change has saved 50,000 lives in China (CNN 2020). It is shocking to realize that millions of people die every year because of polluted air, smog and soot which are considered to be slow killers.
A particulate matter (PM) called PM2.5 which is one of the most dangerous pollutants. It is included in the group-I carcinogens. The 2.5 refers to the particulate size (in microns), or about one thirtieth of the width of a human hair (Xu and Ren 2019). PM2.5 is so small that it can travel from lungs to blood stream which will not only cause respiratory problems but also heart attack and can also cause early deaths. The World Health Organization (WHO) has estimated that every year, worldwide, more than 4 million deaths occurred due to PM2.5, causing heart diseases, strokes, lung cancer, chronic lung diseases and respiratory infections (WHO 2019). The baseline of PM2.5 in many cities in the world is above one hundred, measured in micrograms per cubic meter. After COVID-19-induced lockdown, the level of PM2.5 has decreased drastically and thousands of lives have been protected from its worse impacts. Table 1 shows the analysis of IQAir about PM2.5 levels in some of the most polluted cities in the world during the period of COVID-19-induced lockdown (IQAir 2020).
Table 1.
PM2.5 levels in some of the most polluted cities of the world during the period of COVID-19-induced lockdown
| City | Average PM2.5 during lockdown 2020 (µg/m3) |
Reduction Compared to 2019 |
Average reduction compared to prior 4 years |
Lockdown period, 2020 |
|---|---|---|---|---|
| Delhi, India | 32.8 | − 60% | − 55% | March 23–April 13 |
| London, UK | 16.2 | − 9% | + 6% | March 23–April 13 |
| Los Angeles, US | 5.5 | − 31% | − 51% | March 23–April 13 |
| Madrid, Spain | 6.4 | − 11% | + 2% | March 23–April 13 |
| New York City, US | 4.4 | − 25% | − 29% | March 23–April 13 |
| São Paulo, Brazil | 10.1 | − 32% | − 26% | March 23 − April 13 |
| Seoul, South Korea | 24.1 | − 54% | − 32% | Feb 26–March 18 |
| Wuhan, China | 35.1 | − 44% | − 50% | Feb 3–Feb 24 |
| Lahore, Pakistan | 25 | − 63% | − 59% | March 23–April 13 |
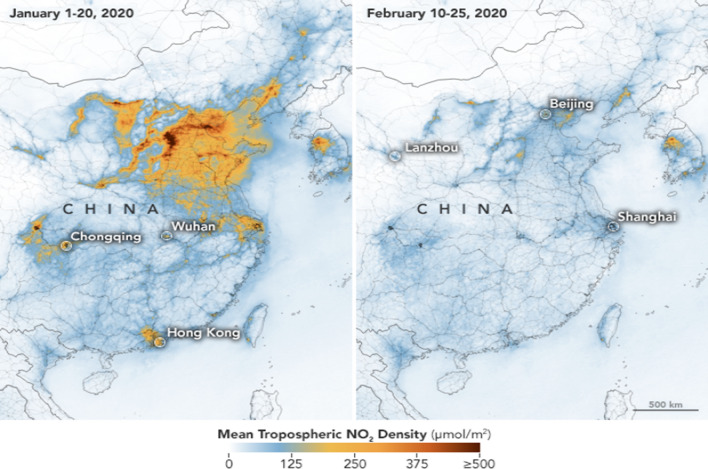
Nitrogen dioxide (NO2) is a toxic gas that is emitted from the engines of automobiles and factories. The World Health Organization stated that if the concentration of this gas exceeds 200 µg/m3, then it can cause inflammation in respiratory track which ultimately leads to asthma. Now, due to current lockdown the transport is restricted and factories are closed, hence, in cities all over the world the concentration of NO2 in air has dropped drastically (from 5.6 µg/m3 to 0.2 µg/m3) (Otmani et al. 2020). Using Ozone Monitoring Instrument (OMI), NASA and ESA have monitored the abrupt decrease in NO2 concentration during the initial quarantine phase of COVID-19 in China. This decrease in concentration of NO2 began in China and slowly it was observed in the rest of the world. The decrease in NO2 concentration was significant in China because the pandemic of COVID-19 happened in the same time when they were celebrating lunar year (Spring Festival) in China, when all the factories, transport and businesses were already closed followed by COVID-19-induced lockdown. Figure 1 shows NO2 levels in the air of China before and after lockdown, where NO2 emission is reduced up to 20–30% from February 10 to 25 (ESA 2020). Lockdown in Pakistan has brought a drastic decrease in pollution level across the country. Using TROPOMI- Sentinel-5P satellite, researchers have analyzed the NO2 level in many cities of Pakistan. Figure 2 shows the concentration of NO2 in few most polluted cities of Pakistan before and after the lockdown (1st March to 15th April) (CREA 2020).
Fig. 1.
NO2 emissions in China before and after lockdown. (ESA 2020)
Fig. 2.
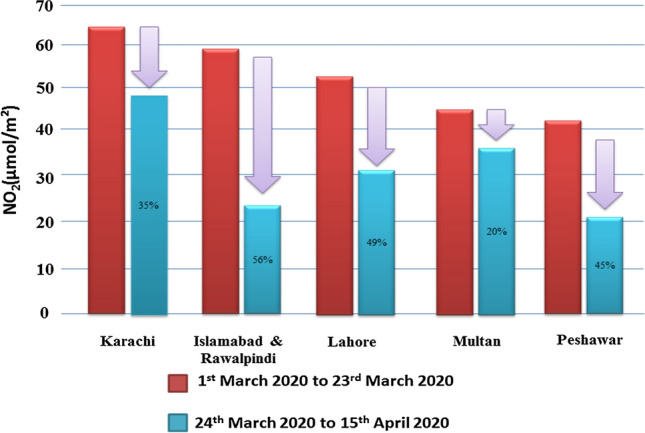
Approx. reductions in NO2 levels across main cities in Pakistan (1st March–15th April)
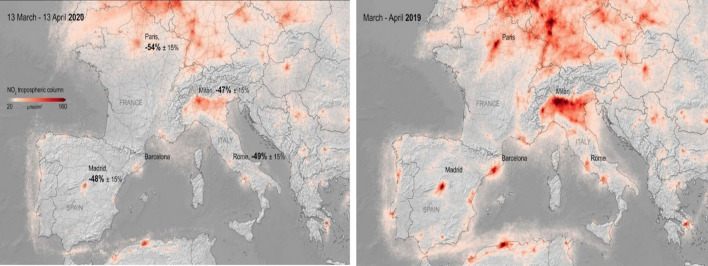
Recent data from the Copernicus Sentinel-5P satellite shows that NO2 concentrations reduced by 45–50% compared to the same period last year in some important cities of Europe (Fig. 3).
Fig. 3.
The concentrations of nitrogen dioxide over Europe from 13 March till 13 April 2020, compared to the average concentrations from March–April, 2019
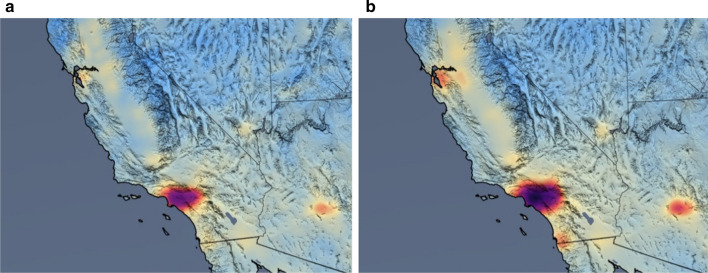
Data from the Ozone Monitoring Instrument (OMI) on board NASA's Aura Satellite shows that air pollution decreases over Southwest US Cities. The data shows that NO2 levels have been decreased 31% over Los Angeles, 22% over San Francisco Bay Area, 25% over San Diego and Tijuana, 16% over Phoenix and 10% over Las Vegas with respect to previous year’s data (OMI 2020). Figure 4 shows satellite estimates of NO2 over major cities of USA. Figure 4a shows the mean NO2 concentration of 150-day period from 2015 through 2019, while Fig. 4b shows the mean of the only 30-day period during 2020.
Fig. 4.
Satellite estimates of NO2 over major cities of Southwest USA
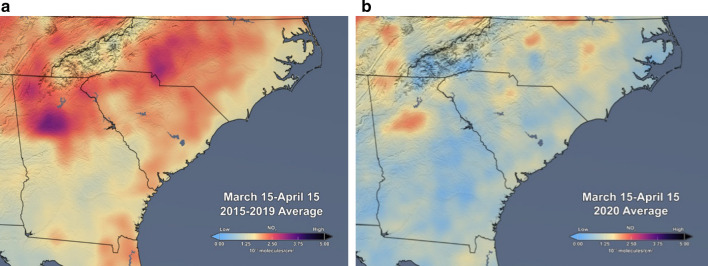
Figure 5 represents the concentration of NO2 over southeast USA. Figure 5a shows average of Tropospheric NO2 level, during March 15 to April 15, every year from 2015 to 2019, while Fig. 5b shows the average of Tropospheric NO2 level, during March 15 to April 15, 2020.
Fig. 5.
Satellite estimates of NO2 over Southeast USA
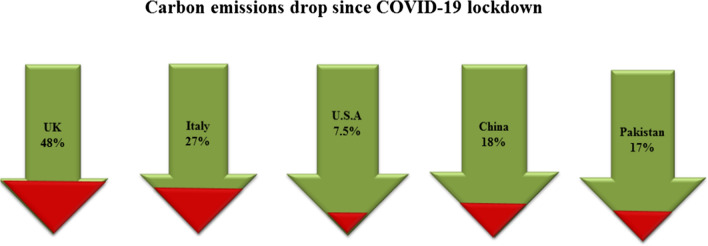
The carbon dioxide (CO2) emission is responsible for the climate change. The transportation sector, industries and electricity have a huge contribution in carbon dioxide emission. Due to coronavirus lockdown the emission of CO2 has decreased worldwide (Fig. 6) (NASA 2020). The experts are predicting this to be the biggest decline in anthropogenic CO2 emissions after World War-II. During the period of lockdown, global air traffic reduced by 60% which have led to a temporary dip in CO2 emissions from their pre-crisis levels. Due to COVID-19 lockdown, CO2 emissions in China have minimized by around 200 million metric tons. Scientists estimated that this reduction may have saved at least 77,000 lives (CAT 2020). Scientists in Europe have observed a similar effect in northern Italy while a 5–10% reduction in CO2 emission have been reported by the scientists at Columbia University, New York within a week (14–20 March, 2020).
Fig. 6.
Decrease in carbon emissions after COVID-19 lockdown
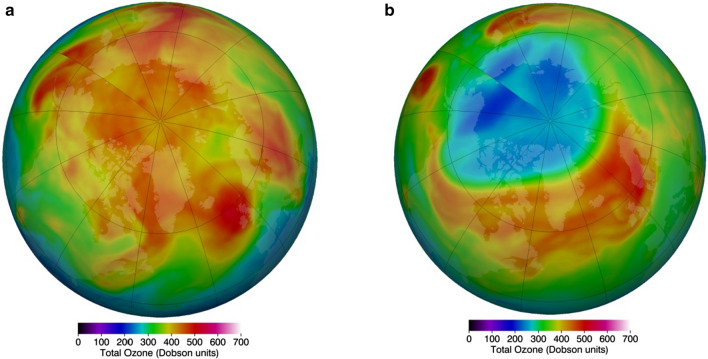
Researchers at NASA reported that ozone concentration above Arctic regions of the globe decreased by around 240 Dobson units on March 12, 2020 as compared to ozone concentration in March 12, 2019. Such low levels are very rare and happen about once per decade. NASA reported a comparatively higher concentration of ozone over Arctic regions in March 12, 2019 (Fig. 7a) in comparison with low level of ozone concentration in March 12, 2020 (Fig. 7b). Yellow and red colors show the highest concentration of ozone, while the light and dark blue colors depict low levels (Fig. 7) (NASA 2020). However, during the lockdown period (March and April, 2020) an unprecedented healing of ozone hole was observed which is reported by Copernicus Atmosphere Monitoring Service (CAMS) as well as Bassim et al. 2020.
Fig. 7.
The concentration of ozone over Arctic regions in March 12, 2019 (a) in comparison with March 12, 2020 (b)
The Ongoing COVID-19 lockdown across the world is showing a direct relation between air pollution levels and economic activities such as industrial activities, transportation and energy production along with the small-scale interferences at city levels. This suggests that clean energy-based system has to be adopted as the corona outbreak ends.
Water quality and aquatic life
Reports are indicating that during COVID-19-induced lockdown not only the air quality but water quality in rivers and water bodies is also improving. The stoppage of discharging industrial effluents and other wastes into water led to an apparent positive effect on water quality. India’s holiest river Ganga has been one of the most polluted rivers in the world. Waste from domestic and industrial setups along the banks of this river cost the government in millions without any success. According to the real-time water analysis of the Central Pollution Control Board of India (CPCB) and reports of Dr. Mishra, an IIT professor in Banaras Hindu University, a 40–50% improvement has been observed in the water quality of the Ganga River (CPCB 2020). The parameters monitored online were dissolved oxygen (more than 6 mg/L), biochemical oxygen demand (less than 2 mg/L), total coliform levels (5000 per 100 ml) and pH (range between 6.5 and 8.5). Indian Institute of Technology, Roorkee, has reported that the water of Ganga River has become fit for drinking after decades. Not just the Ganga but its sister river the Yamuna has been improved as well, as dissolved oxygen (DO) has been recorded 2.3–4.8 mg/L in Yamuna which was considered null in 2019. Lockdown has been able to achieve what the governments could not for decades. Data from the Central Pollution Control Board (CPCB) and Uttar Pradesh Pollution Control Board (UPPCB) of India reveals that the biological oxygen demand (BOD) of the rivers Ganga and Yamuna has decreased in their most polluted stretches (CPCB 2020; UPPCB 2020). In Venice the water are looking clearer after the two months of COVID-19 lockdown and aquatic life is now visible which hasn’t been seen for many years in the cities.
Clean rivers and other water bodies have a significant positive effect on the aquatic life. Many species are returning to their natural habitats since induction of the lockdown. The closure of factories and commercial establishments has dipped the pollution level across the globe. Not only the land animals returning but even the sea creatures seem to enjoy this break from the noise and water pollution. With many cruisers suspended, the tourism subdued while all other marine activities being suspended, consequently, the aquatic species are taking controls in their hands. Marine scientists have already started investigating the effects of lockdown on marine life. Commercial fishing industries have been hit hard due to the closure of main buyers, the restaurants and hotels. The social distancing at sea has caused the fishing vessels to be anchored at ports. Carlos Duarte, a research chair at the Red Sea Research Center (RSRC) in Saudi Arabia, said COVID-19 lockdown between February and June or July will accelerate the recovery of fish stocks and other marine organisms, as it already showed spectacular recovery after the 1st and 2nd world wars, and this accidental lockdown will help us to grasp conservation aims faster. Sound travels much farther and faster in water than a so-called imagine plight of the aquatic life. The noise pollution from shipping and powerful blasts from the seismic air gun tests, used to locate the deposits of gas and oil in the deep oceans, must be traumatizing for marine life. Noise levels from shipping traffic are generally 20–200 Hz and disturb the aquatic life which is decreased by six decibels with a significant reduction below 150 Hz (GeoNoise 2020). The study of humpback whales and other marine life by Michelle Fournette, a marine ecologist at Cornell, said that the removal of just the cruise ships would bring about an instant massive change in the amount of ocean noise. The study states that the ambient noise from nautical traffic increases stress-hormone levels in marine creatures, which in turn can affect their reproductive success (Rolland et al. 2012). A study examining the feces of the right whales reveals that limited movement in the water was directly proportional to lowering of stress hormones in these species. In addition, this lockdown is also providing a flawless condition for olive ridley turtles in the beaches. Turtles are less disturbed by tourists during this lockdown. The decreased human interruption this year would give these turtles enough time to incubate and hatch in peace. Since the beaches are people free that resulted in no accidental crushing of eggs, less garbage and plastics disposal to the marine environment. The indigestion and entanglement due to the plastic and marine debris which are the leading causes of injuries to sea creatures will be wiped out during this lockdown. Not just the oceans but even the rivers and other water bodies are clearing out indicating lesser toxic and harmful materials entrance to the water bodies.
There have been visible positive signs of this lockdown but few weeks or months of lockdown will not be enough to eradicate or reverse the damage caused during many years. Data gathered by several studies can be utilized for devising better environmental policies. The lockdown gives us hope that there is a possibility of minimizing the unnecessary human interferences and letting these wonderful creatures back in their space and habitats. If the governments construct sewage treatment plants in the right manner and make strong regulations for the companies and industries to treat their wastes accordingly, then the lockdown induced ecofriendly impact on aquatic life can be long lasting.
Slow moving life
Mobility has been wedged all over the world during COVID-19 lockdown. All modes of mobility like public transport, micro-mobility and individual auto commuting have seen a melodramatic diminution across the globe. Public transport has been reduced in many countries and up to 95% decline in users has been reported by many transport authorities.
COVID-19 Community Mobility Reports (Table 2), which use anonymous, aggregated geolocation data from mobile phones to chart movement trends over several weeks, provide perceptions into changes in mobility patterns. These reports illustrate the trends in movements in most busy places including workplaces, markets, parks, places of residence, entertaining venues and pharmacies, etc. The data collected from the mobile phones of people by this community depicts that people have reduced their movement after the COVID-19 pandemic (COVID-19 Community Mobility Reports—Google). Decreased mobility has been observed across the globe especially in countries such as Italy, USA, Germany, UK, Canada, China, India and Saudi Arabia.
Table 2.
COVID-19 community mobility reports of different countries
| Location | Retail and recreation | Grocery and pharmacy | Parks, public beaches |
|---|---|---|---|
| Pakistan | − 59% | − 41% | − 34% |
| Italy | − 78% | − 37% | − 37% |
| USA | − 34% | − 4% | + 28% |
| UK | − 78% | − 30% | − 18% |
| Spain | − 84% | − 31% | − 43% |
| India | − 85% | − 44% | − 64% |
| Saudi Arabia | − 60% | − 34% | − 65% |
| Bangladesh | − 72% | − 52% | − 36% |
| Germany | − 46% | + 3% | − 18% |
According to data from TomTom Traffic Index (TTTI), which provides detailed insights on live and historic road crowding levels in cities around the world, traffic levels have greatly been reduced in this ongoing pandemic. In 25 largest cities of UK, congestion levels have dropped from 73 to 16% on April 22, when compared to pre-pandemic levels. In India, according to All India Motor Transport Congress (AIMTC) daily movement of trucks has been reduced to less than 10% of normal levels (TomTom Traffic Index 2020).
According to the data collected by INRIX, a transportation data company, travel levels have been dropped by 48% in USA, whereas the city of New York experienced the largest drop (63%) in passenger travelling.. The road traffic of Barcelona city (Spain) has shrunken by 80% since the COVID-19 lockdown. In Italy, one of the most infected countries in the world and as the first nation to announce lockdown, traffic levels have been reduced by 65% (INRIX 2020).
Reduced road transport and fewer air travels across the globe considerably decreased fuel consumption. According to the data collected from a Norwegian energy consultancy, Rystad Energy, the demand for oil, gas and diesel could be decreased by 9.4 percent over 2020 (Rystad Energy 2020). However, this pandemic is a great opportunity for us to learn that how urban traffic and transportation can be monitored to reduce the expenditure of fuel, its consumption and maintain a healthy environment.
Lessons from COVID-19-induced lockdown
COVID-19 pandemic is the first and foremost a global health emergency with severe consequences on health and economy, but it has also brought positive environmental effects that may serve as an example and inspiration for future behavioral changes that would help us to bring positive changes in environment. The current global pandemic has forced us to introspect and imagine a different world. The lockdowns show that a world with cleaner air is possible. The ongoing pandemic across the world is showing a direct relation between pollution levels and bigger economic activities such as industrial activities, transportation and energy production along with the small-scale interferences at city levels. This tells us that clean energy-based system has to be adopted as the corona outbreak ends. Without pollution control, the waste products from consumption, heating, agriculture, mining, manufacturing, transportation and other human activities, will degrade the environment. Therefore, proper strategies should be adopted to control environmental degradation. The lockdown gives us hope that there is a possibility of minimizing the unnecessary human interferences in environment. To bring positive changes in the environment, governments and individuals should adopt the following suggested strategies:
Inspection and maintenance of vehicles
Efficient public transport system
Improving traffic managements
Using eco-friendly products
Minimizing the use of Chlorofluorocarbons (CFCs)
Adopting renewable energy sources
Promoting reusing and recycling of wastes
Decreasing the use of pesticides
Using minimum required amount of water
Plantation of trees
Avoiding deforestation
Treatment of sewage and removing solid, suspended and inorganic materials from it, before it enters the environment
Use of Ecosan toilets where no water is required and human excreta is converted into natural fertilizers
Conclusion
COVID-19 originated from Wuhan city of China and then spread almost all over the world. WHO declared this COVID-19 outbreak a pandemic and since February, 2020 affected countries have halted their factories, transport, vehicles and aviation to minimize the spread of the virus. Following social distancing, lockdown and restricted human interaction with nature proved to be a blessing for nature and environment during the crises. There are positive indications from all over the world that COVID-19-induced lockdown is improving environmental conditions including air and water quality and causes a significant concurrent reduction in PM2.5, NO2 and CO concentration which resulted in a significant increase in O3 concentration. This recovery of lost environment is an indicator that the environmental degradation caused by human is reversible. In a period of just 2–3 months, recovery of nature is being witnessed by everyone. This is a signal for us to understand and react. Government and policy makers must take necessary steps so that this healing process does not become a temporary one. There is a need for rigorous study on the effect of implementation of such short term lockdown as an alternative measure for pollution reduction and its effect on economy.
Acknowledgements
We would like to express our deep and sincere gratitude to Dr. Sikandar Khan, Department of Biotechnology, Shaheed Benazir Bhutto University Sheringal, Pakistan, for his generous guidance and intellectual support.
Author contributions
The authors declare that this work was done by the authors named in this article and all liabilities pertaining to claims relating to the content of this article will be borne by them. I.K. conceived the study. S.S.S. and I.K. drafted the manuscript. D.S. and S.S.S. revised the manuscript. All the authors read and approved the manuscript.
Compliance with ethical standards
Conflict of interest
The authors declare that they have no conflict of interests.
References
- CAT-Climate Action Tracker (2020) Climate of China. https://climateactiontracker.org/countries/china/. Accessed 3 May 2020
- CNN-Cable News Network (2020) China's coronavirus lockdown curbs deadly pollution, likely saving the lives of tens of thousands, says researcher. https://edition.cnn.com/2020/03/17/health/china-air-pollution-coronavirus-deaths-intl/index.html. Accessed 13 May 2020.
- COVID-19 Community Mobility Reports (2020). https://www.google.com/covid19/mobility/. Accessed 2 May 2020
- CPCB- Central Pollution Control Board (2020) Water Quality. https://cpcb.nic.in/water-pollution/. Accessed 6 July 2020
- CREA- Centre for Research on Energy and Clean Air (2020) Air Quality before and after national lockdown during Coronavirus disease (COVID-19) outbreak across Pakistan. https://energyandcleanair.org/air-quality-before-and-after-national-lockdown-during-coronavirus-disease-covid-19-outbreak-across-pakistan. Accessed 9 May 2020
- Dong X, Cao YY, Lu XX, et al. Eleven faces of coronavirus disease 2019. Allergy. 2020 doi: 10.1111/ALL.14289. [DOI] [PMC free article] [PubMed] [Google Scholar]
- ESA- European Space Agency (2020) COVID-19: nitrogen dioxide over China. https://www.esa.int/Applications/Observing_the_Earth/Copernicus/Sentinel-5P/COVID-19_nitrogen_dioxide_over_China. Accessed 5 May 2020
- Geier MR, Geier DA. Respiratory conditions in coronavirus disease 2019 (COVID-19): important considerations regarding novel treatment strategies to reduce mortality. Med Hypotheses. 2020;140:109760. doi: 10.1016/j.mehy.2020.109760. [DOI] [PMC free article] [PubMed] [Google Scholar]
- GeoNoise (2020) Coronavirus Lockdown Gives Animals A Rare Break from Noise Pollution.https://www.geonoise.com/coronavirus-lockdown-gives-animals-a-rare-break-from-noise-pollution/. Accessed 30 March 2020
- Gorbalenya AE, Baker SC, Baric RS, et al. The species severe acute respiratory syndrome-related coronavirus: classifying 2019-NCoV and naming It SARS-CoV-2. Nat Microbiol. 2020;5:536–544. doi: 10.1038/s41564-020-0695-z. [DOI] [PMC free article] [PubMed] [Google Scholar]
- Graham RL, Baric RS. Recombination, reservoirs, and the modular spike: mechanisms of coronavirus cross-species transmission. J Virol. 2010;84:3134–3146. doi: 10.1128/JVI.01394-09. [DOI] [PMC free article] [PubMed] [Google Scholar]
- Hashim BM, Al-Naseri SK, Al-Maliki A, et al. Impact of COVID-19 lockdown on NO2, O3, PM2.5 and PM10 concentrations and assessing air quality changes in Baghdad Iraq. Sci Total Environ. 2020 doi: 10.1016/j.scitotenv.2020.141978. [DOI] [PMC free article] [PubMed] [Google Scholar]
- Inciardi RM, Lupi L, Zaccone G, et al. Cardiac involvement in a patient with coronavirus disease 2019 (COVID-19) JAMA Cardiol. 2020;2019:1–6. doi: 10.1001/jamacardio.2020.1096. [DOI] [PMC free article] [PubMed] [Google Scholar]
- INRIX. 2020. https://inrix.com/. Accessed 5 May 2020
- IQAir, 2020. https://www.iqair.com/us/. Accessed 6 July 2020
- Lai CC, Shih TP, Ko WC, et al. Severe acute respiratory syndrome coronavirus 2 (SARS-CoV-2) and coronavirus disease-2019 (COVID-19): the epidemic and the challenges. Int J Antimicrob Agents. 2020;55:105924. doi: 10.1016/j.ijantimicag.2020.105924. [DOI] [PMC free article] [PubMed] [Google Scholar]
- Li JW, Han TW, Woodward M, et al. The impact of 2019 novel coronavirus on heart injury: a systemic review and meta-analysis. Prog Cardiovasc Dis. 2020 doi: 10.1016/j.pcad.2020.04.008. [DOI] [PMC free article] [PubMed] [Google Scholar]
- Lu H, Stratton CW, Tang YW. Outbreak of pneumonia of unknown etiology in Wuhan, China: the mystery and the miracle. J Med Virol. 2020;92:401–402. doi: 10.1002/jmv.25678. [DOI] [PMC free article] [PubMed] [Google Scholar]
- Lu R, Zhao X, Li J, Niu P, et al. Genomic characterisation and epidemiology of 2019 novel coronavirus: implications for virus origins and receptor binding. Lancet. 2020;395:565–574. doi: 10.1016/S0140-6736(20)30251-8. [DOI] [PMC free article] [PubMed] [Google Scholar]
- NASA-National Aeronautics and Space Administration (2020) NASA Satellite Offers Urban Carbon Dioxide Insights. https://climate.nasa.gov/news/2957/nasa-satellite-offers-urban-carbon-dioxide-insights/. Accessed 13 May 2020
- OMI-Ozone Monitoring Instrument (2020) Daily OMI tropospheric NO2 (air pollution) measurements over The Netherlands and Western Europe. https://projects.knmi.nl/omi/research/. Accessed May 7 2020
- Otmani A, Benchrif A, Tahri A et al (2020) Impact of Covid-19 lockdown on PM10, SO2 and NO2 concentrations in Salé City (Morocco). Sci.Tot. Environ. 735: 139541. https:// doi.org10.1016/j.scitotenv.2020.139541 [DOI] [PMC free article] [PubMed]
- Nicholas P. COVID-19 and the vulnerability of kidney patients. J Kidney Care. 2020;5:94–95. doi: 10.12968/jokc.2020.5.2.94. [DOI] [Google Scholar]
- Products as an emerging therapeutic regime: a review. biomedica 36:201–205.
- Richardson S, Hirsch JS, Narasimhan M, Crawford JM, et al. Presenting characteristics, comorbidities, and outcomes among 5700 patients hospitalized with COVID-19 in the New York City area. JAMA J Am Med Assoc. 2020;10022:1–8. doi: 10.1001/jama.2020.6775. [DOI] [PMC free article] [PubMed] [Google Scholar]
- Rolland RM, Parks SE, Hunt KE, et al. Evidence that ship noise increases stress in right whales. Proc R Soc B. 2012;279:2363–2368. doi: 10.1098/rspb.2011.2429. [DOI] [PMC free article] [PubMed] [Google Scholar]
- Romano TA, Keogh MJ, Kelly C, et al. Anthropogenic sound and marine mammal health: Measures of the nervous and immune systems before and after intense sound exposure. Can J Fish AquatSci. 2004;61:1124–1134. doi: 10.1139/f04-055. [DOI] [Google Scholar]
- Rystad Energy (2020) COVID-19 demand update: Oil seen down 9.4%, jet fuel down 31%, road fuel down 9.4% in 2020. https://www.rystadenergy.com/newsevents/news/press-releases/covid-19-demand-update-oil-seen-down-9point4-jet-fuel-down-31-road-fuel-down-9point4-in-2020/. Accessed 5 May 2020
- Singhal T. A review of coronavirus disease-2019 (COVID-19) Indian J Pediatr. 2020;87:281–286. doi: 10.1007/s12098-020-03263-6. [DOI] [PMC free article] [PubMed] [Google Scholar]
- TomTom Traffic Index (2020). https://www.tomtom.com/en_gb/traffic-index/. Accessed 2 May 2020
- UPPCB-Uttar Pradesh Pollution Control Board (2020) River Water Quality. https://www.uppcb.com/river_quality.htm. Accessed 6 July 2020
- Wang D, Hu B, Hu C, et al. Clinical characteristics of 138 hospitalized patients with 2019 novel coronavirus-infected pneumonia in Wuhan, China. JAMA J Am Med Assoc. 2020;323:1061–1069. doi: 10.1001/jama.2020.1585. [DOI] [PMC free article] [PubMed] [Google Scholar]
- WHO- World Health Organization (2019) Air pollution. https://www9.who.int/airpollution/en/. Accessed 15 May 2020
- WHO-World Health Organization (2020) Air pollution. https://www.who.int/health-topics/air-pollution. Accessed 15 May 2020
- Wölfel R, Corman VM, Guggemos W, et al. Virological assessment of hospitalized patients with COVID-2019. Nature. 2020 doi: 10.1038/s41586-020-2196-x. [DOI] [PubMed] [Google Scholar]
- Xu Z, Ren W. Application of a hybrid model based on echo state network and improved particle swarm optimization in PM2.5 concentration forecasting: a case study of Beijing, China. Sustainability. 2019 doi: 10.3390/su11113096. [DOI] [Google Scholar]
- Zahra FT, Saleem S, Imran M et al (2020) The SARS-CoV-2 pandemic and the role of honey and its products as an emerging therapeutic regime: a review. Biomedica (36), COVID 19-S2.
- Zhang D, Hu M, Ji Q. Financial markets under the global pandemic of COVID-19. Finance Res Lett. 2020 doi: 10.1016/j.frl.2020.101528. [DOI] [PMC free article] [PubMed] [Google Scholar]
- Zowalaty MEE, Järhult JD. From SARS to COVID-19: a previously unknown SARS- related coronavirus (SARS-CoV-2) of pandemic potential infecting humans-call for a one health approach. One Health. 2020 doi: 10.1016/j.onehlt.2020.100124. [DOI] [PMC free article] [PubMed] [Google Scholar]


