. 2020 Nov 3;9:e60266. doi: 10.7554/eLife.60266

Figure 3. Developmental time course and trajectory inference reveal details of lineage dynamics and commitment in trophoblast.

(A) UMAP projection of all nuclei captured at each gestational age. (B) Quantification of the proportion of each cluster captured at each developmental time point. (C) RNA velocity vectors of the trophoblast nuclei at each time point. Arrows show the estimated magnitude and direction of each nucleus in pseudotime. (D) The magnitude of velocity vectors shown in D summarized as violin plots, with nuclei split by cluster identity and developmental time point. (E) Violin plots showing the log2 fold change of differentially expressed genes between nuclei from S-TGC at E9.5 vs. each other timepoint. (F) Immunofluorescence staining of LEPR (top) and PODXL (bottom) in the placental labyrinth at each developmental timepoint at 63x. Insets, magnification of area surrounding a S-TGC indicated by dotted line, DAPI stain removed to highlight protein expression.

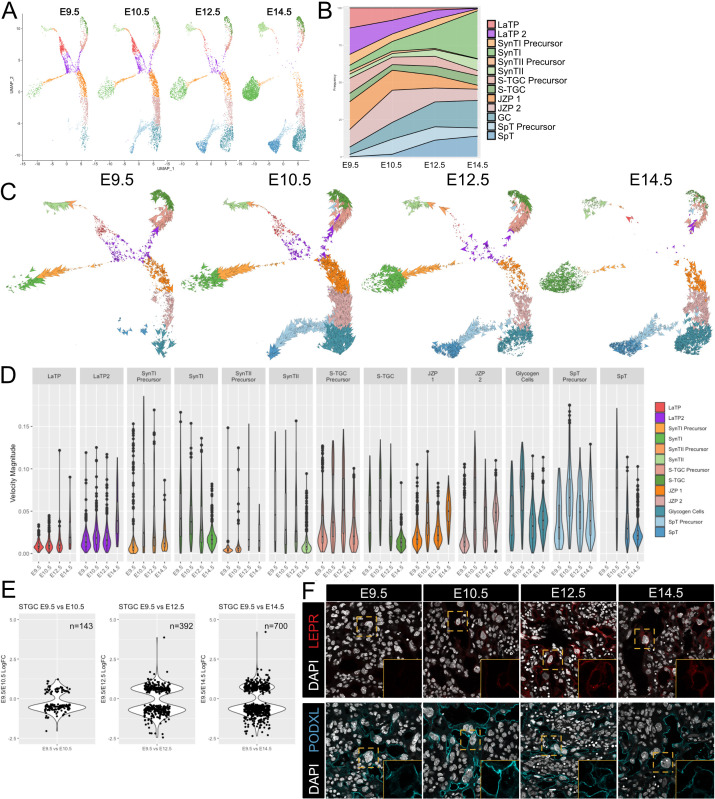
Figure 3—source data 1. Average RNA velocity magnitude split by developmental stage and cluster (Figure 3D).
Figure 3—source data 2. S-TGC Differential Expression (E9.5 v E10.5).
Figure 3—source data 3. S-TGC Differential Expression (E9.5 v E12.5).
Figure 3—source data 4. S-TGC Differential Expression (E9.5 v E14.5).

Figure 3.

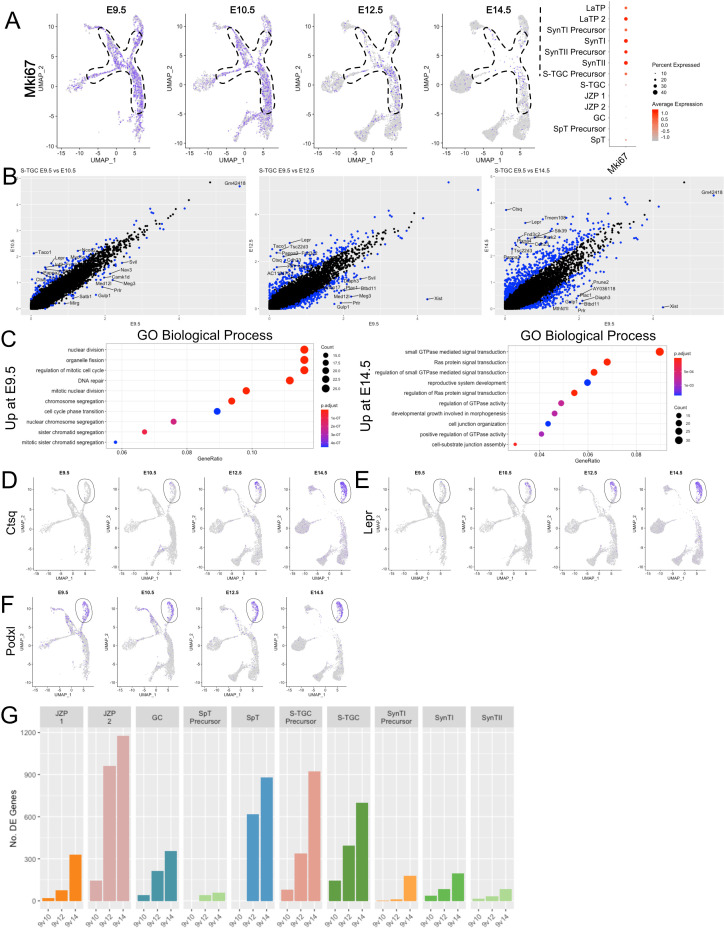
Figure 3—figure supplement 1. Analysis of S-TGC across developmental time reveals a switch from proliferation to maturation.

Figure 3—figure supplement 1.

(A) Expression of Mki67 projected in UMAP space at each time point (left). The dotted line outlines the progenitor populations LaTP, LaTP2, SynTI Precursor, SynTII Precursor, and JZP 1/2. Quantification, shown as a dot blot representing percent cells expressing (increasing with dot size) and average expression (increasing with red color) of Mki67 in each cell population combined across all timepoints (right). (B) Scatter plot of differential expression (log2 fold change) in S-TGC nuclei comparing expression at E9.5 on the x-axis with E10.5 (left), E12.5 (middle), and E14.5 (right). Each dot represents a gene and significantly differentially expressed genes are colored blue (adj. p-value<0.05, 100 permutations). The top 10 differentially expressed genes by log2FC in either direction are labeled. (C) Gene Ontology (Biological Process) of genes upregulated at E14.5 vs E9.5 (left) and genes upregulated at E9.5 vs E14.5 (right) (adj. p-value<0.05, logFC >0.5). GeneRatio is the of the number of genes in the given ontology divided by the number of genes found in any ontology (Yu, 2018) . (D–F) Expression of Ctsq (D), Lepr (E), Podxl (F) across trophoblast cells represented on UMAP plot at each developmental time point. The S-TGC population is circled by a solid line. (G) The number of differentially expressed genes (y-axis) between each timepoint for each cluster (with greater than 50 nuclei captured at each timepoint).
Figure 3—figure supplement 1—source data 1. S-TGC Gene Ontology results by developmental stage.