. 2020 Nov 3;9:e60266. doi: 10.7554/eLife.60266

Figure 4. Defining distinct roles of the trophoblast subtypes at the gas exchange interface.

(A) Schematic showing the relative location of the cell types at the gas and nutrient exchange interface of the labyrinth – S-TGC, SynTI, SynTII, (sometimes referred to as trophoblast layer I, II, and III, respectively) and the fetal endothelium (top). Immunofluorescence staining resolving expression in each pair of neighboring cell types – Endothelial/SynTII, SynTII/SynTI, and SynTI/S-TGC in E12.5 mouse placenta sections. (B) Heatmap of all differentially expressed genes by log fold change in SynTI, SynTII, and S-TGC clusters. (C–E) Network diagrams showing the top 5 Gene Ontology (Biological Process) enriched in marker genes (adj. p-value<0.05, logFC >0.5) in each cluster (Yu G. 2018). Gene ontology categories are nodes and associated marker genes are annotated. Adjusted p-values for enrichment are listed in the table insets.

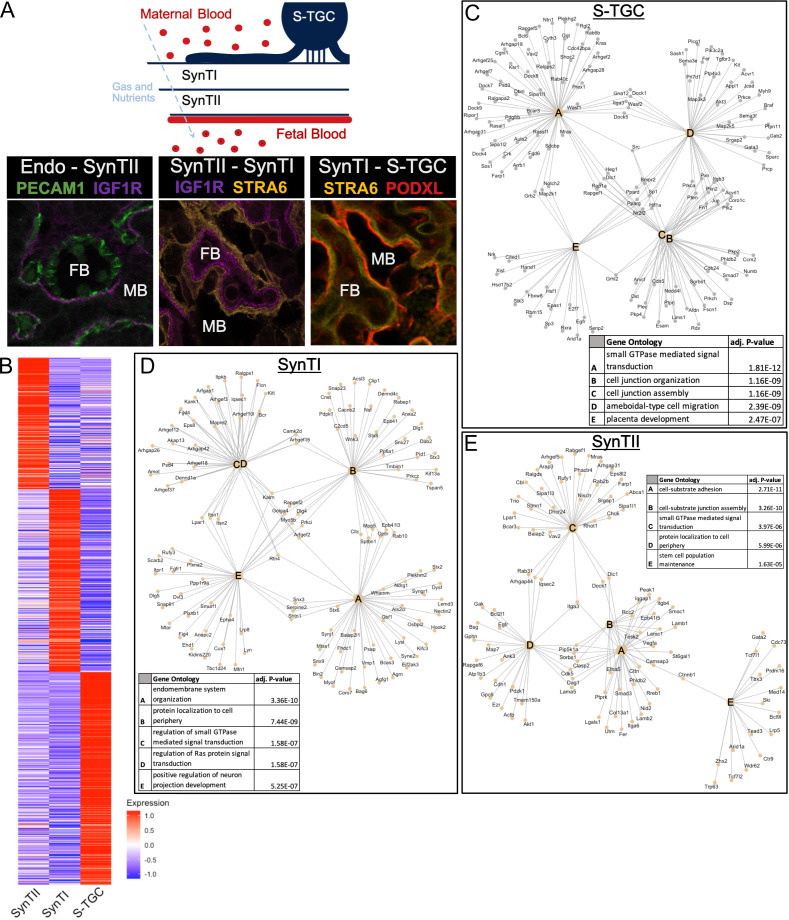
Figure 4—source data 1. Differential expression between interface clusters (SynTI, SynTII, and S-TGC).
Figure 4—source data 2. Gene Ontology results for differentially expressed genes between interface clusters (SynTI, SynTII, and S-TGC).

Figure 4.

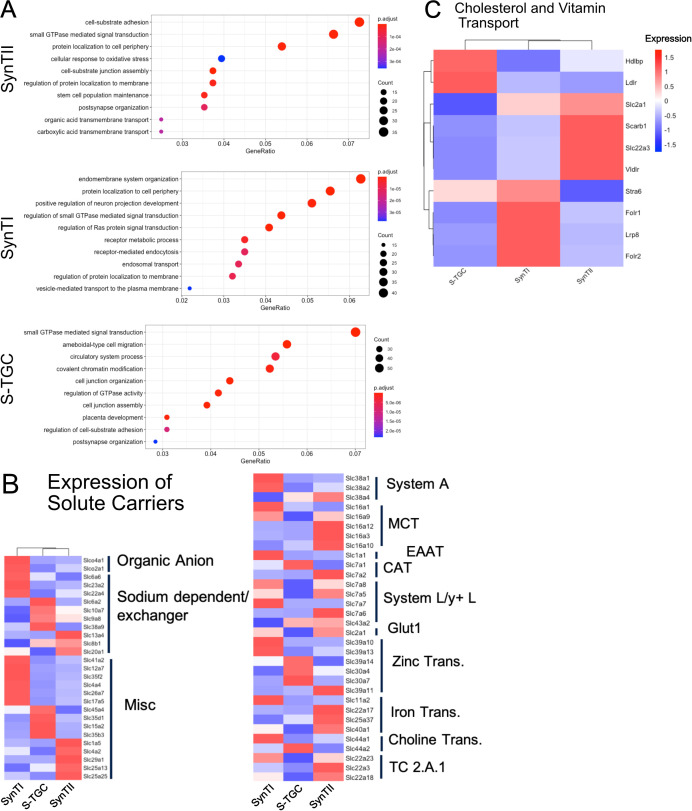
Figure 4—figure supplement 1. Gene ontology (biological process) of differentially expressed genes SynTII (top), SynTI (middle), S-TGC (bottom).

Figure 4—figure supplement 1.

Significantly differentially expressed genes are defined by adj. p-value<0.05 and logFC >0.5. GeneRatio is the of the number of genes found the given ontology divided by the number of genes found in any ontology category. (B) Heatmap of scaled expression all solute transporters showing differential expression (adj. p-value<0.05) in SynTI, SynTII, S-TGC compared to all other trophoblast clusters. Genes are organized and annotated by class of transporter. (C) Heatmap of scaled expression of select genes involved in vitamin and cholesterol transport.