Abstract
Computer-aided diagnosis (CAD) methods such as Chest X-rays (CXR)-based method is one of the cheapest alternative options to diagnose the early stage of COVID-19 disease compared to other alternatives such as Polymerase Chain Reaction (PCR), Computed Tomography (CT) scan, and so on. To this end, there have been few works proposed to diagnose COVID-19 by using CXR-based methods. However, they have limited performance as they ignore the spatial relationships between the region of interests (ROIs) in CXR images, which could identify the likely regions of COVID-19’s effect in the human lungs. In this paper, we propose a novel attention-based deep learning model using the attention module with VGG-16. By using the attention module, we capture the spatial relationship between the ROIs in CXR images. In the meantime, by using an appropriate convolution layer (4th pooling layer) of the VGG-16 model in addition to the attention module, we design a novel deep learning model to perform fine-tuning in the classification process. To evaluate the performance of our method, we conduct extensive experiments by using three COVID-19 CXR image datasets. The experiment and analysis demonstrate the stable and promising performance of our proposed method compared to the state-of-the-art methods. The promising classification performance of our proposed method indicates that it is suitable for CXR image classification in COVID-19 diagnosis.
Keywords: Chest x-rays, Classification, COVID-19, Deep learning, SARS-CoV2
Introduction
COVID-19 disease, which is triggered by Severe Acute Respiratory Syndrome Coronavirus 2 (SARS CoV-2) [1–3], has been posing a severe threat to humanity by widespread community transmission and increasing death rate daily. It is believed to have originated from Wuhan city of China [4]. Now, it has been spread all over the world [5–7] and infected around 13,471,862 people with 581,561 deaths.1 The spread of virus for the infection is also related to the geographic region of the corresponding country [8]. To identify the infection of this disease in the human body, medical professionals have been using the Polymerase Chain Reaction (PCR) method widely, which is not only expensive but also an arduous task. Nonetheless, it is time-consuming whereas faster results are more likely to save the lives of people. Thus, researchers are trying to find the cheapest and quickest Computer-Aided Diagnosis (CAD) methods such as Chest X-Ray (CXR) [9–11], Computed Tomography (CT) [12, 13], and so on. Besides, World Health Organization (WHO)2 has encouraged people for chest imaging to the patients who are not hospitalized but having mild symptoms. Among the CAD methods, the CXR-based method is one of the cheapest and quickest approaches for the early diagnosis of such disease.
CXR-based methods for COVID-19 diagnosis are proposed in [9, 13–15]. These methods are mostly based on the pre-trained deep learning models that outperform the traditional computer vision-based methods (also called hand-crafted features extraction methods) [16]. Moreover, the deep learning-based methods extract features at a higher order. Consequently, it has a breakthrough performance in image analysis, especially for CXR images. As a result, deep learning-based methods have been widely adopted in the literature for CXR image analysis, especially for COVID-19 diagnosis.
Existing CXR-based methods for COVID-19 diagnosis have three major limitations. Firstly, they do not perform well as some of them require a separate classifier after the feature extraction step, which is a demanding task. Secondly, the spatial relationship between the region of interests (ROIs) in images has been ignored in the literature, though they help to improve the performance of CXR images more accurately. Finally, existing deep learning-based methods require a higher number of training parameters, which not only yield a computation burden in the classification but also lead to over-fitting problems because of the limited availability of COVID-19 CXR images.
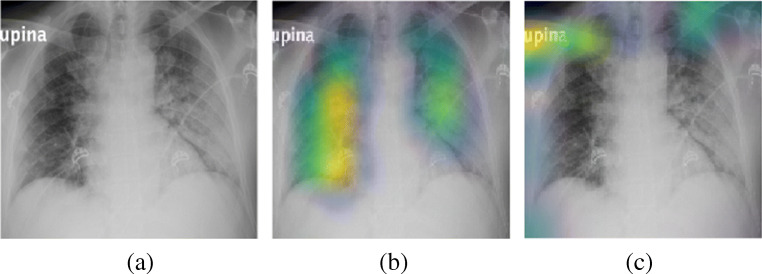
To address these limitations, we propose a novel deep learning model using an appropriate layer of the VGG-16 [17] and the attention module [18]. We choose pooling layer as an appropriate layer, which not only has a higher discriminability for CXR images but also faster in deep learning model training task [19]. Kumar et al. [19] also mentions that deep learning models are applicable to different domains, including human health, medicine, etc. Given such importance and applicability, we train our deep learning model in an end-to-end approach. Therefore, it does not require an additional classifier for the classification purpose. Furthermore, with the help of the attention module as a deep learning layer, we capture the spatial relationship between the ROIs during the training process to better discriminate CXR images (see details for the visualization example of ROIs in Fig. 1). Moreover, our model requires lower number of parameters as it leverages the appropriate layer (4th pooling layer) of the VGG-16 model. Specifically, this pooling layer captures the invaluable interesting information of CXR images, which helps to identify and diagnose most of the lungs-related diseases like COVID-19 swiftly.
Fig. 1.
Visualization example for COVID-19 CXR image (a), extracted ROI (in yellow color) by Grad-Cam [20] for Convolution Module (b), and Attention Module (c)
The main contributions of our proposed method are as follows:
We propose a novel deep learning model by the combination of the VGG-16 and the attention module, which is one of the most appropriate models for CXR image classification. Since our proposed model leverages both attention and convolution module (4th pooling layer) together on VGG-16, it can capture more likely deteriorated regions in both local and global levels of CXR images.
For better discrimination of CXR images, we use the attention module to capture the relationship between ROIs of CXR images.
Our proposed method requires a lower number of parameters as we use the 4th pooling layer.
The proposed deep learning model can be trained in an end-to-end fashion which does not require a separate classifier for training and testing
We evaluate our model on three COVID-19 CXR datasets. Also, we also perform a qualitative and quantitative study of our method using CXR images. The evaluation results demonstrate that our model outperforms the state-of-the-art methods.
The paper is organized as follows. In Section 2, we review the existing methods related to the CXR image classification, including COVID-19 disease. We explain our proposed method in Section 3. Section 4 elaborates the experimental settings, implementation, results and discussion, comparison, and different analyses. Finally, Section 5 concludes the paper with future works.
Related works
Deep learning (DL) models are very popular nowadays in various image representation and classification tasks ranging from scene images to health images [9, 21, 22]. DL models are a larger artificial neural network (ANN) that are inspired by the structure and function of the human brain. They are categorized into two types: Non pre-trained DL models and Pre-trained DL models. Non pre-trained DL models need to be trained from scratch which needs a massive amount of datasets and prone to over-fitting. In contrast, pre-trained DL models are already trained with the public image datasets such as ImageNet [23], Places [24], and avoid over-fitting in most cases. Due to the extraction of semantic features at a higher-order from those pre-trained models, the performance of such models are higher in most domains [16, 21] compared to the traditional computer methods such as Generalized Search Tree (GIST)-color [25], GIST [26], Scale Invariant Feature Transform [27], Histogram of Gradient [28], and Spatial Pyramid Matching [29].
In this section, we review some of the recent deep learning-based methods [9–11, 14, 15, 22, 30–32] that have been used widely to perform CXR image analysis including COVID-19 disease. We divide these methods into two specific categories, such as Section 2.1 Single deep learning-based algorithms and Section 2.2 Combined deep-learning based algorithms.
Single deep learning-based algorithms
To perform CXR image analysis for different diseases including COVID-19, there have been several recent works. Firstly, Stephen et al. [30] proposed a DL model to detect pneumonia. For this, they trained a DL model from scratch using a collection of CXR images. In the meantime, researchers further realized the ability of such pre-trained models in X-ray image analysis tasks and wanted to explore further to analyze the strengths of various DL models. For example, Loey et al. [11] used transfer learning approach on AlexNet [33], GoogleNet [34], and ResNet-18 [35] to represent and classify CXR images for COVID-19 diagnosis. They used the COVID-19 dataset consisting of four categories (COVID, Normal, Pneumonia Bacterial, and Pneumonia Viral). Also, they used the Generative Adversarial Network (GAN) [36] to increase the number of images for training that helps to avoid over-fitting in the experiment. Similarly, Khan et al. [9] proposed a novel DL model based on Xception [37]. For this, they fine-tuned the Xception model and trained using COVID-19 CXR images for classification purposes. Moreover, Ozturk et al. [10] proposed a novel DL model to represent and classify COVID-19 CXR images classification based on DarkNet-19 [38] model, which has been primarily used for object detection. Luz et al. [14] proposed a new DL model based on EfficientNet [39] model, which is the recent pre-trained deep learning model. They fine-tuned their model using COVID-19 CXR images for classification purposes. Furthermore, Panwar et al. [15] proposed a novel model, called nCOVnet, based on the VGG-16 model that provided prominent accuracy on COVID-19 CXR images classification for two classes. Recently, Civit-Masot et al. [40] also employed VGG-16 model to design a model for COVID-19 diagnosis. Their result shows that such model produces high sensitivity and specificity in identifying the COVID-19 disease. This further unveils that the VGG-16 model is still popular in CXR image analysis tasks for COVID-19.
Although existing methods based on a single DL model provide a significant performance boost in CXR image analysis, they still ignore the spatial relationship between ROIs, which is one of the important discriminating clues in the CXR image analysis task.
Combined deep learning-based algorithms
The use of a single DL model alone might not carry out sufficient discriminating information for CXR images classification. Given the appearance of such weaknesses, researchers used more than one DL model to form a combined model, which is also called the ensemble model and the learning approach is called ensemble learning. For example, Zhou et al. [41] combined multiple Artificial Neural Networks (ANNs) to identify lung cancer cells. Similarly, Sasaki et al. [31] designed an ensemble model to detect the abnormality detection in CXR images. Furthermore, Li et al. [42] used more than two CNNs (Convolution Neural Networks) to minimize the false-positive rate in lung nodules of CXR images. Similarly, Islam et al. [43] proposed an ensemble model, which was obtained by aggregating different pre-trained DL models to detect the abnormality in lung nodule of CXR images. Recently, Chouhan et al. [22] proposed a model, which aggregates the outputs of five pre-trained models such as AlexNet, DenseNet-121, ResNet-18, Inception-V3, and GoogleNet, to detect pneumonia using the transfer learning approach on the CXR images.
However, ensemble models still have two weaknesses. Firstly, it is prone to the over-fitting problem in most cases because of the limited amount of CXR images in the medical domain. Secondly, the ensemble model is computationally expensive as it has to extract patterns using million of parameters during the training step. This also leads to tuning the hyper-parameters carefully, which is a challenging task itself.
Proposed method
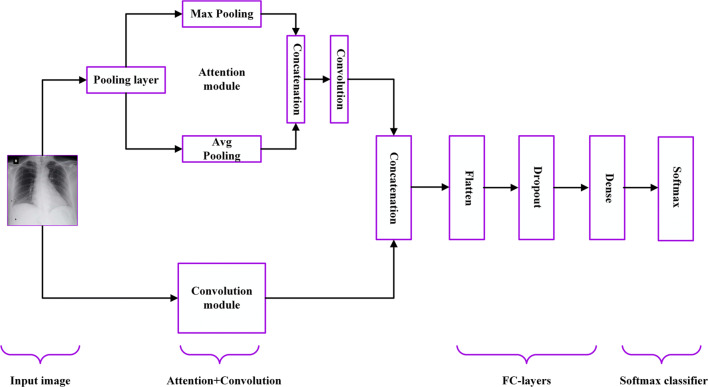
Our proposed method is based on the well-established pre-trained DL model (VGG-16) and the attention module. We prefer to use the VGG-16 model (see detailed description in Table 1) for two reasons. Firstly, it extracts the features at low-level by using its smaller kernel size, which is appropriate for CXR images with a lower number of layers compared to its another counterpart VGG-19 model. Secondly, it has a better feature extraction ability for the classification of COVID-19 CXR images as shown in [15]. We use a fine-tuning approach, which is one of the transfer learning techniques. To work with the VGG-16 model for the fine-tuning process, we use the pre-trained weight of ImageNet [23]. It helps to overcome the over-fitting problem as we have limited amount of COVID-19 CXR images for training purpose. Our proposed method (also called Attention-based VGG-16) consists of four main building blocks such as Attention module, Convolution module, FC-layers, and Softmax classifier. The overall block diagram of the proposed model is shown in Fig. 2. We explain each building block in the next subsections.
Table 1.
Detailed parameters of original VGG-16 model [17]
| Input size | Output size | Layer | Stride | Kernel |
|---|---|---|---|---|
| 224× 224 × 3 | 224 × 224 × 64 | conv1-64 | 1 | 3 × 3 |
| 224× 224 × 64 | 224 × 224 × 64 | conv1-64 | 1 | 3 × 3 |
| 224× 224 × 64 | 112 × 112 × 64 | maxpool | 2 | 2 × 2 |
| 112×112 × 64 | 112 × 112 × 128 | conv2-128 | 1 | 3 × 3 |
| 112× 112 × 128 | 112 × 112 × 128 | conv2-128 | 1 | 3 × 3 |
| 112× 112 × 128 | 56 × 56 × 128 | maxpool | 2 | 2 × 2 |
| 56× 56 × 128 | 56 × 56 × 256 | conv3-256 | 1 | 3 × 3 |
| 56× 56 × 256 | 56 × 56 × 256 | conv3-256 | 1 | 3 × 3 |
| 56× 56 × 256 | 56 × 56 × 256 | conv3-256 | 1 | 3 × 3 |
| 56× 56 × 256 | 28 × 28 × 256 | maxpool | 2 | 2 × 2 |
| 28× 28 × 256 | 28 × 28 × 512 | conv4-512 | 1 | 3 × 3 |
| 28× 28 × 512 | 28 × 28 × 512 | conv4-512 | 1 | 3 × 3 |
| 28× 28 × 512 | 28 × 28 × 512 | conv4-512 | 1 | 3 × 3 |
| 28× 28 × 512 | 14 × 14 × 512 | maxpool | 2 | 2 × 2 |
| 14× 14 × 512 | 14 × 14 × 512 | conv5-512 | 1 | 3 × 3 |
| 14× 14 × 512 | 14 × 14 × 512 | conv5-512 | 1 | 3 × 3 |
| 14× 14 × 512 | 14 × 14 × 512 | conv5-512 | 1 | 3 × 3 |
| 14× 14 × 512 | 7 × 7× 512 | maxpool | 2 | 2 × 2 |
| 1× 1 × 25088 | 1 × 1 × 4096 | fc | – | 1× 1 |
| 1× 1 × 4096 | 1 × 1 × 4096 | fc | – | 1 × 1 |
| 1× 1 × 4096 | 1 × 1 × 1000 | fc | – | 1 × 1 |
Fig. 2.
Block diagram of the proposed deep learning model (Attention-based VGG-16) for COVID-19 Chest X-ray (CXR) image classification
Attention module
We use this module to capture the spatial relationship of visual clues in the COVID-19 CXR images. For this, we follow the spatial attention concept proposed by Woo et al. [18]. We perform both max pooling and average pooling on the input tensor, which is 4th pooling layer of the VGG-16 model in our method. After that, these two resultant tensors (max pooled 2D tensor and average pooled 2D tensor) are concatenated to each other to perform a convolution of filter size (f ) of 7 × 7 using Sigmoid function (σ). The high-level diagram of the attention module is shown in Fig. 2. The concatenated resultant tensor (Ms(F)) is defined as
| 1 |
where, and represents the 2D tensors achieved by average pooling and max pooling operation on the input tensor F, respectively. Here, H and W denote the height and width of the tensor, respectively.
Convolution module
We use the convolution module in our method, which is the 4th pooling layer of the VGG-16 model. The scale-invariant convolution module captures the interesting clues of the image. The interesting clues are extracted from the mid-level layer (4th pooling) that is more appropriate to CXR images. However, the features from other layers (higher or lower) are not appropriate to CXR images because such images are neither more general nor more specific. Thus, we first input the 4th pooling layer to the attention module. After that, the result of that module is concatenated with 4th pooling layer itself.
Fully connected (FC)-layers
To represent the concatenated features achieved from attention and convolution block into one-dimensional (1D) features, we use fully connected layers. It consists of three layers such as flatten, dropout, and dense as shown in Fig. 2. In our method, we fix dropout to 0.5 and set the dense layer to 256.
Softmax classifier
To classify the features extracted from the FC-layers, we use the softmax layer. For the softmax layer which is the last dense layer, the unit number depends on the number of categories (e.g., three for dataset having three categories, four for the dataset with four categories, etc.). The softmax layer outputs the multinomial distribution of the probability scores based on the classification performed. The output of this distribution is
| 2 |
where b and c represents the probabilities that are retrieved from the softmax layer and one of the classes of the dataset used in our proposed method, respectively. The detailed architecture of our proposed model is presented in Table 2.
Table 2.
Details of our proposed model’s architecture. Here, the units in the final dense layer (softmax layer) varies from one dataset to another depending on the number of categories
| Layer (type) | Output shape |
|---|---|
| VGG-16 (Model) | 9 × 9 × 512 |
| Lamda_layer (Avg pooling) | 9 × 9 × 1 |
| Lamda_layer (Max pooling) | 9 × 9 × 1 |
| Concat_layer | 9 × 9 × 2 |
| Conv_layer | 9 × 9 × 1 |
| Concat_layer | 9 × 9 × 513 |
| Flatten | 41,553 |
| Dropout | 41,553 |
| Dense | 256 |
| Dense | 4 |
| Total Parameters: 18,273,957 | |
| Trainable Parameters: 18,273,957 | |
| Non-trainable Parameters: 0 |
Experiments and analysis
Datasets
To perform extensive experiments using our method, we use three COVID-19 CXR image datasets [9, 10] that are publicly available.
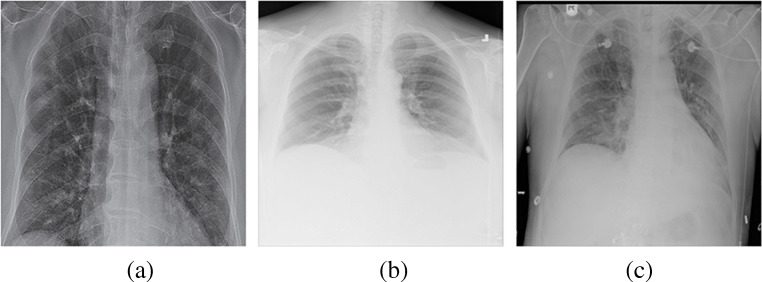
Dataset 1 contains three categories: Covid-19, No_findings, and Pneumonia as shown in Fig. 3. Each category contains at least 125 images. For the evaluation, we split the images into a 7:3 ratio for the train/test set per category. To report in the table, we randomly prepare five different train/test sets and report the average accuracy. As the dataset contains the No_findings category, it has several challenging and ambiguous images.
Fig. 3.
Example images from Dataset 1 (D1) for three categories such as Covid (a), No_findings (b), and Pneumonia (c)
Dataset 2 contains four categories: Covid, Normal, Pneumonia Bacteria, Pneumonia Viral as shown in Fig. 4. Each category contains at least 320 images. For the evaluation, we split the images into a 7:3 ratio for the train/test set per category. To report in the table, we design randomly five different sets and average the value of accuracy.
Fig. 4.
Example images from Dataset 2 (D2) for four categories such as Covid (a), Normal (b), Pneumonia Bacteria (c), and Pneumonia Viral (d)
Dataset 3 contains five categories: Covid, Normal, No_findings, Pneumonia Bacteria, and Pneumonia Viral. To design this dataset, we combine the No_finding category of Dataset 1 with all the categories of Dataset 2. No_findings is a new category in Dataset 2. Thus, we combine it with Dataset 2 to design Dataset 3. Here, each category contains at least 320 images. Similar to other datasets, for Dataset 3, we split the images into a 7:3 ratio for the train/test set per category and perform 5 runs which are then averaged to report in the table. Further details of all datasets is provided in Table 3.
Table 3.
Datasets description
Implementation
To implement our proposed method, we used Keras [44] in Python [45]. To train our deep learning model using end to end mode, we leveraged the softmax layer as a classifier in the experiment. Similarly, for fine-tuning purposes in our model, we loaded pre-trained ImageNet weight and trained from the initial layer with CXR images. Here, the initial layer is defined as the first layer of the VGG-16 model. The detailed parameters which include basic settings for training in addition to offline augmentation, required to implement our method are listed in Table 4. Additionally, to prevent from over-fitting, we fixed the learning rate decay in every 4 steps at the rate of 0.4 based on the initial learning rate with Adam optimizer. Meanwhile, we implemented our method on a computer with NVIDIA GeForce GTX 1050 GPU and 4GB GDDR5 VRAM.
Table 4.
Parameters setting details in our method
| Experimental parameters | Setting |
|---|---|
| Image size | 150 × 150 |
| Batch size | 12 |
| Epoch | 60 |
| Optimizer | Adam |
| Learning rate (LR) | 0.0001 |
| Loss | Categorical cross entropy |
| Validation spit | 0.2 |
| Shear_range | 0.25 |
| Zoom_range | 0.1 |
| Channel_shift_range | 20 |
| Horizontal_flip | True |
| Vertical_flip | True |
| Rotation_range | 50 |
| Rescale | 1/255 |
| Height_shift_range | 0.2 |
| Width_shift_range | 0.2 |
Results and discussion
Since our method uses a fine-tuning approach, we compare our method with some of the fine-tuned models based on some pre-trained deep learning models (Table 6). To implement fine-tuning on top of other pre-trained models, we use some similar settings as used in our method (see details in Table 4). Moreover, to achieve the optimal accuracy from the existing methods, we perform additional hyper-parameters tuning during the training. The details of such optimal parameters are presented in Table 5. Additionally, we also compare our model with three state-of-the-art models that have used COVID-19 CXR images for classification tasks (Table 7). In Table 6, we present the results of D1, D2, and D3 in column 2, 3, and 4, respectively. While looking at the results in column 2 for D1, we observe that our method outperforms all fine-tuned pre-trained models. Specifically, our method, which yields 79.58% accuracy, has at least 10% higher than the second-best method (Incep.-ResnetV2) that has an accuracy of 68.10% on D1. Similarly, while looking at the results in column 3 for D2, we notice that our method again outperforms all fine-tuned pre-trained models. To this end, our method, which provides 85.43% accuracy, has at least 1.5% higher accuracy compared to the second-best contender method (Incep.-ResnetV2), with the accuracy of 83.93% on D2. Moreover, we observe that our method surpasses the existing methods while looking at the results in column 4 for D3. Specifically, our method, which imparts 87.49% accuracy, has at least 3.14% higher than the second-best method (Incep.-ResnetV2) that has an accuracy of 84.35% on D3. Furthermore, the second-best method has the highest number of training parameters (57 millions), which is over 3 times higher than ours. Higher number of training parameters burden the deep learning model in training steps. Also, while implementing our method using VGG-19 on all three datasets, we notice that our method outperforms all the pre-trained models on D1, D2, and D3. This justifies the better efficacy of our method with VGG-19 model as well.
Table 6.
Comparison with other fine-tuned models based on pre-trained deep learning models using average classification accuracy (%) and training parameters (in millions) on three datasets (D1, D2, and D3). Bold emphasis indicate the best results
| Method | D1(%) | D2(%) | D3(%) | Params |
|---|---|---|---|---|
| Incep.-V3, 2016 [46] | 65.55 | 83.44 | 80.95 | 26 |
| ResNet50, 2016 [35] | 62.24 | 74.15 | 67.58 | 36.6 |
| DenseNet121, 2017 [47] | 64.61 | 80.40 | 75.86 | 11 |
| Incep.-ResnetV2, 2017 [48] | 68.10 | 83.93 | 84.35 | 57 |
| MobileNet, 2017 [49] | 67.33 | 82.35 | 84.16 | 7 |
| EfficientNetB0, 2019 [39] | 56.03 | 81.82 | 72.87 | 12 |
| Ours (VGG-16) | 79.58 | 85.43 | 87.49 | 18 |
| Ours (VGG-19) | 74.84 | 82.83 | 85.00 | 21.2 |
Table 5.
Optimal parameter settings for the existing methods with batch size of 10
| Method | LR | Epochs | FC-layers | Dropout | Optimizer |
|---|---|---|---|---|---|
| Incep.-V3, | 0.0001 | 40 | 256 | 0.5 | Adam |
| 2016 [46] | |||||
| ResNet50, | 0.0001 | 60 | 256 | 0.5 | Adam |
| 2016 [35] | |||||
| DenseNet121, | 0.0001 | 40 | 256 | 0.5 | Adam |
| 2017 [47] | |||||
| Incep.-ResnetV2, | 0.0001 | 40 | 256 | 0.5 | Adam |
| 2017 [48] | |||||
| MobileNet, | 0.0001 | 40 | 256 | 0.5 | Adam |
| 2017 [49] | |||||
| EfficientNetB0, | 0.0001 | 40 | 256 | 0.4 | Adam |
| 2019 [39] | |||||
| CoroNet, | 0.0001 | 40 | 256 | 0.5 | Adam |
| 2020 [9] | |||||
| Luz et al., | 0.0001 | 40 | 256 | 0.5 | Adam |
| 2020 [14] | |||||
| nCOVnet, | 0.0001 | 40 | 256 | 0.5 | Adam |
| 2020 [15] | |||||
Table 7.
Comparison with recent state-of-the art methods on three datasets (D1, D2, and D2) using average classification accuracy (%) and training parameters (in millions). Bold emphasis indicate the best results
Furthermore, in Table 7, we present the results in column 2, 3, and 4 for D1, D2, and D3, respectively. While looking at the results of datasets (D1, D2, and D3), we notice that our method has excellent performance compared to three recent contender methods (CoroNet [9], Luz et al. [14], and nCOVnet [15]). Also, it is interesting to see that our method is stable in each dataset compared to Luz et al. [14] and nCOVnet [15] that have a lower number of parameters than ours. Moreover, our method consumes the third least number of parameters yet stable classification performance on different datasets.
To sum up, we speculate that the performance of our model is stable and consistent on three COVID-19 CXR image datasets because of three main reasons. First, our model leverages a smaller size of the filter of the VGG-16 model, which is appropriate to capture interesting regions of CXR images. Second, the 4th pooling layer used in our method is more appropriate to CXR images because CXR images are neither more specific nor more general compared to ImageNet [23], which has been used to pre-train the VGG-16 model. Third, we can capture the more interesting regions of CXR images that bolster the performance while working with the convolution block.
Convergence analysis
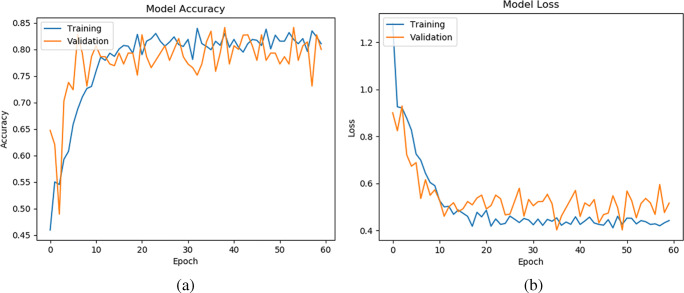
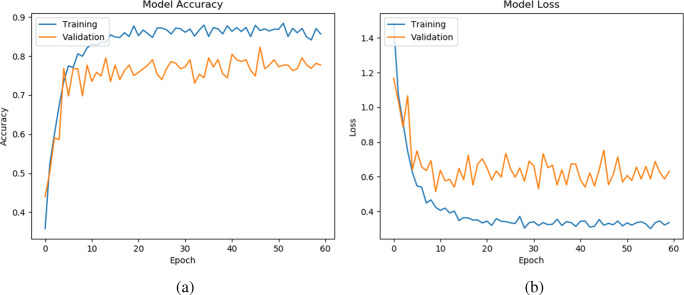
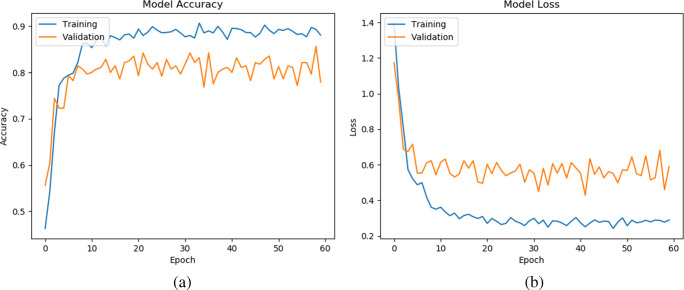
In this subsection, we study the convergence analysis of our method on three datasets (D1, D2, and D2), which are shown in Figs. 5, 6, and 7, respectively. To see the stability of the learning pattern, we increased the epoch from 40 to 60 in our model. Note that, we present the representative model accuracy/loss plot of one set from each dataset. From Figs. 5, 6, and 7, we observe that the gap between training and validation accuracy/loss on D1 is lower than on D2 and D3. Furthermore, we also observe that our method has converged and shown best-fit on all datasets. Hence, this result provides an ability to generalize the prediction of CXR images during classification.
Fig. 5.
Model accuracy (a) and loss (b) per epoch of our proposed model on the second set of D1
Fig. 6.
Model accuracy (a) and loss (b) per epoch of our proposed model on the second set of D2
Fig. 7.
Model accuracy (a) and loss (b) per epoch of our proposed model on the second set of D3
Class-wise analysis
In this subsection, we perform the class-wise analysis of our proposed method for all datasets (D1, D2, and D3). For this, we use precision (3), recall (4), and f-score (5) for each class on the corresponding dataset, defined as follows:
| 3 |
| 4 |
| 5 |
where f_p, t_p, and f_n denote false positive, true positive, and false negative, respectively. The results are listed in Tables 8 and 9, 10 for D1, D2, and D3, respectively. To report in the table, we average precision, recall, and f-score of all five sets on the corresponding dataset. While observing three tables for three datasets, our method produces the highest precision for Covid class on two datasets, whereas this class has second-best precision on third dataset. In the meantime, our method also imparts significant performance for other classes in terms of recall and f-score on all datasets.
Table 8.
Class-wise analysis on D1 using average Precision, Recall, and F-score. Bold emphasis indicate the best results
| Class | Precision | Recall | F-score |
|---|---|---|---|
| Covid-19 | 0.91 | 0.77 | 0.83 |
| No_findings | 0.90 | 0.68 | 0.77 |
| Pneumonia | 0.71 | 0.90 | 0.79 |
Table 9.
Class-wise analysis on D2 using average Precision, Recall, and F-score. Bold emphasis indicate the best results
| Class | Precision | Recall | F-score |
|---|---|---|---|
| Covid | 0.92 | 0.95 | 0.93 |
| Normal | 0.89 | 0.95 | 0.92 |
| Pneumonia Bacteria | 0.76 | 0.87 | 0.81 |
| Pneumonia Viral | 0.84 | 0.64 | 0.72 |
Table 10.
Class-wise analysis on D3 using average Precision, Recall, and F-score. Bold emphasis indicate the best results
| Class | Precision | Recall | F-score |
|---|---|---|---|
| Covid | 0.89 | 0.92 | 0.90 |
| No_findings | 0.96 | 0.96 | 0.96 |
| Normal | 0.86 | 0.96 | 0.90 |
| Pneumonia Bacteria | 0.79 | 0.83 | 0.81 |
| Pneumonia Viral | 0.84 | 0.66 | 0.74 |
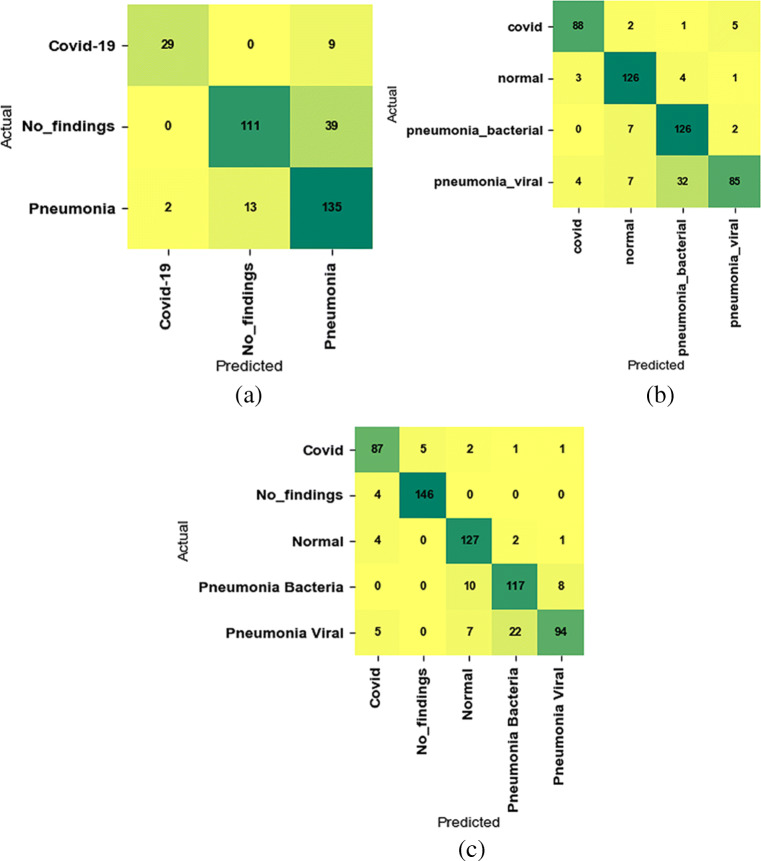
Furthermore, we also utilize the confusion matrix to figure out the distribution of predicted images in different classes, which have been shown in Fig. 8 for D1, D2, and D3. While looking at the three confusion matrix in the figure closely, we notice that our method has classified the images into the corresponding class at a higher rate on the corresponding dataset.
Fig. 8.
Confusion matrix on the second testing split of D1 (a), second testing split of D2 (b), and second testing split of D3 (c)
Qualitative analysis
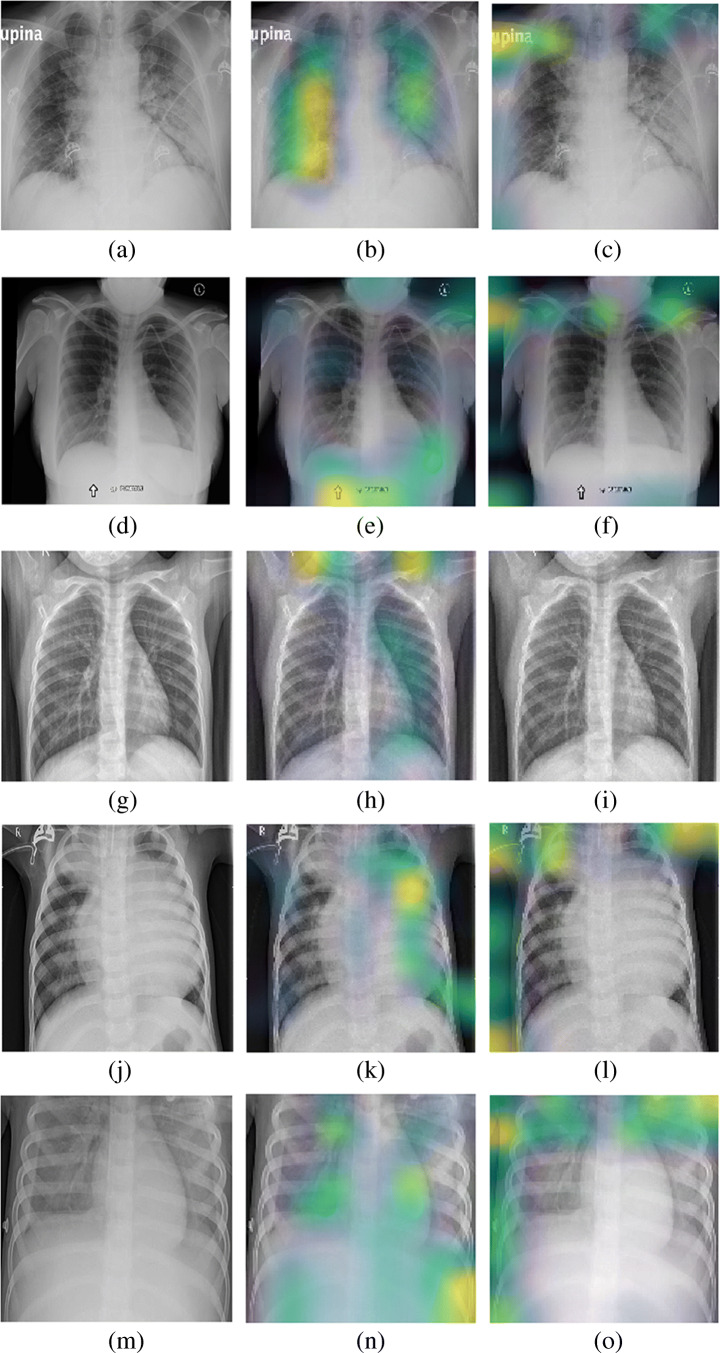
In this subsection, we analyze the visual maps produced by convolution and attention module for five different diseases (covid, no_findings, normal, pneumonia bacteria, and pneumonia viral). For this, we utilize one of the sets (Set 1) from dataset D3. Here, we utilize D3 for the qualitative analysis because this dataset has a higher number of categories compared to the remaining datasets used in our work. The visualization maps are presented in Fig. 9. By observing the visualization maps for five different diseases, we notice that the convolution and attention modules impart the complementary information that indicates that both information is equally important for their better separation. Specifically, we observe that the attention map highlights the defects in the upper region of the lungs mostly, which can be seen in the figure for covid, no_findings, pneumonia bacteria, and pneumonia viral disease. Since the attention module identifies the local salient regions, we believe that it has detected the local salient regions deteriorated by covid and other diseases in the top regions of the lungs. Nevertheless, the convolution map identifies the defects in the lower and middle regions of the lungs. Since the convolution module highlights defects in the global region unlike the attention module, we conjecture that it has detected the salient regions in multiple parts (lower and middle) of the lungs for the potential defects. Meanwhile, we notice that normal images do not have heatmap by both convolution and attention module. This is obvious because such images are clear and easily separable for the classification.
Fig. 9.
Each row contains the original CXR image, its convolution map and its attention map for the corresponding disease. The first row lists for covid, second rows lists for no_findings, third row lists for normal, forth row lists for pneumonia bacteria, and fifth row lists for pneumonia viral
Ablative analysis
In this subsection, we perform an ablative analysis of our method on D1. For this, we study the contribution of the attention module, convolution module, and their combination in our method. To study the contribution of each module, we utilize the average classification accuracy and computational complexity, which are listed in Table 11. By observing the table for average classification accuracy, we notice that the combination of both modules (attention and convolution) outperforms each module. As a result, we speculate that, although the attention module is not good while using alone, it is attributed to bolster the classification performance while working jointly with the convolution module.
Table 11.
Ablative analysis of components on D1 using average classification accuracy and computation complexity, where l, c, s, and k represents the corresponding layer of deep learning, number of input channels, and spatial size of output feature map, respectively. Bold emphasis indicate the best results
| Component | Accuracy (%) | Computational complexity |
|---|---|---|
| VGG-16 with attention module | 45.20 | |
| VGG-16 | 75.25 | |
| VGG-16 with both attention and convolution module (proposed model) | 79.58 | + |
Meanwhile, we analyze the complexity of each module (convolution, attention) that has been used in our method. Let l, c, s, and k represent the corresponding layer of deep learning, number of input channels, spatial size of the filter, and spatial size of the output feature map, respectively. First, the convolution module of layer l consumes complexity. Note that the VGG-16 model contains a stack of convolution layers itself and without it, we can not perform classification tasks. Thus, VGG-16 without additional convolution and attention also imparts a similar complexity. Second, the attention module, which consists of max pooling and average pooling followed by convolution operation, imparts complexity. Importantly, the attention module has a lower complexity than the convolution module because it primarily needs pooling operations. Last, our combined modules (attention module and convolution module) impart the combined complexity of the convolution and attention module. Note that such computational complexities are similar to other datasets as well.
Conclusion
In this paper, we proposed a novel deep learning model using attention module on top of VGG-16, called attention-based VGG-16, to classify the COVID-19 CXR images. We evaluated our method on three COVID-19 CXR datasets. The evaluation results indicate that our method is not only efficient in terms of classification accuracy but also training parameters. From this result, we can conclude that our proposed method is more appropriate for COVID-19 CXR image classification.
However, the performance of our proposed method could be further improved by the following two techniques. First, our method does not utilize offline data augmentation techniques in the experiment. Thus, the use of extensive augmentation techniques such as GAN or Convolution Auto-encoder before training could improve the performance further. This also helps to increase the number of CXR images, which results in mitigating the overfitting problem during the training step. Second, the use of other pre-trained deep learning models having a smaller filter size could improve the performance of CXR images. This is because a smaller filter size helps extract more discriminating ROIs of CXR images.
Biographies
Chiranjibi Sitaula
is currently pursuing the Ph.D. degree at the School of Information Technology, Deakin University, Geelong, VIC, Australia. He received the M. Sc. and B. Sc. degrees in Computer Science from Tribhuvan University, Nepal, in 2014 and 2009, respectively. He worked in industry and academia in Nepal for a number of years before joining Deakin University for PhD degree. He has published research articles in top-tier conferences and journals in the field of deep learning and machine learning. His current research interests include image feature extraction, deep learning, and machine learning.

Mohammad Belayet Hossain
received the B.Sc. Eng. degree in electrical and electronic engineering from the Khulna University of Engineering and Technology, Khulna, Bangladesh, in 2010, and the M.Sc. degree in biomedical engineering from the University of Malaya, Kuala Lumpur, Malaysia, in 2014. He is currently pursuing the Ph.D. degree at the School of Information Technology, Deakin University, Geelong, VIC, Australia. His current research interests include image processing, smart meter privacy, and energy storage application in smart grid.

Funding
There are no financial supports to complete this work.
Compliance with Ethical Standards
Conflicts of interest
We would like to confirm that there are no known conflict of interests exist.
Footnotes
https://www.worldometers.info/coronavirus/ (accessed date: 15/07/ 2020)
https://www.who.int/publications/i/item/use-of-chest-imaging-in-COVID-19 (accessed date: 21/07/2020)
This article belongs to the Topical Collection: Artificial Intelligence Applications for COVID-19, Detection, Control, Prediction, and Diagnosis
Availability of data and materials
The datasets are publicly available.
Code availability
The source code of our proposed method can be found at:[online] Available: https://bitbucket.org/chirudeakin/covidattention/src/master/
Publisher’s note
Springer Nature remains neutral with regard to jurisdictional claims in published maps and institutional affiliations.
Contributor Information
Chiranjibi Sitaula, Email: csitaul@deakin.edu.au.
Mohammad Belayet Hossain, Email: mbhossai@deakin.edu.au.
References
- 1.Lai C-C, Shih T-P, Ko W-C, Tang H-J, Hsueh P-R. Severe acute respiratory syndrome coronavirus 2 (SARS-CoV-2) and corona virus disease-2019 (COVID-19): the epidemic and the challenges. Int J Antimicrob Agents. 2020;55:105924. doi: 10.1016/j.ijantimicag.2020.105924. [DOI] [PMC free article] [PubMed] [Google Scholar]
- 2.Li J, Li JJ, Xie X, Cai X, Huang J, Tian X, Zhu H. Game consumption and the 2019 novel coronavirus. Lancet Infect Dis. 2020;20(3):275–276. doi: 10.1016/S1473-3099(20)30063-3. [DOI] [PMC free article] [PubMed] [Google Scholar]
- 3.Sharfstein JM, Becker SJ, Mello MM. Diagnostic testing for the novel coronavirus. JAMA. 2020;323(15):1437–1438. doi: 10.1001/jama.2020.3864. [DOI] [PubMed] [Google Scholar]
- 4.Singhal T. A review of coronavirus disease-2019 (COVID-19) Indian J Pediatr. 2020;87:1–6. doi: 10.1007/s12098-019-03135-8. [DOI] [PMC free article] [PubMed] [Google Scholar]
- 5.Holshue M L, DeBolt C, Lindquist S, Lofy K H, Wiesman J, Bruce H, Spitters C, Ericson K, Wilkerson S, Tural A et al (2020) First case of 2019 novel coronavirus in the united states. New Engl J Med. 929–936 [DOI] [PMC free article] [PubMed]
- 6.Giovanetti M, Benvenuto D, Angeletti S, Ciccozzi M. The first two cases of 2019-ncov in Italy: where they come from? J Med Virol. 2020;92(5):518–521. doi: 10.1002/jmv.25699. [DOI] [PMC free article] [PubMed] [Google Scholar]
- 7.Bastola A, Sah R, Rodriguez-Morales AJ, Lal BK, Jha R, Ojha HC, Shrestha B, Chu DK, Poon LL, Costello A, et al. The first 2019 novel coronavirus case in nepal. Lancet Infect Dis. 2020;20(3):279–280. doi: 10.1016/S1473-3099(20)30067-0. [DOI] [PMC free article] [PubMed] [Google Scholar]
- 8.Hernandez-Matamoros A, Fujita H, Hayashi T, Perez-Meana H. Forecasting of covid19 per regions using arima models and polynomial functions. Appl Soft Comput. 2020;96:106,610. doi: 10.1016/j.asoc.2020.106610. [DOI] [PMC free article] [PubMed] [Google Scholar]
- 9.Khan AI, Shah JL, Bhat MM. Coronet: a deep neural network for detection and diagnosis of COVID-19 from chest X-ray ages. Comput Methods Progr Biomed. 2020;196:105581. doi: 10.1016/j.cmpb.2020.105581. [DOI] [PMC free article] [PubMed] [Google Scholar]
- 10.Ozturk T, Talo M, Yildirim EA, Baloglu UB, Yildirim O, Acharya UR. Automated detection of COVID-19 cases using deep neural networks with X -ray images. Comput Biol Med. 2020;121:103792. doi: 10.1016/j.compbiomed.2020.103792. [DOI] [PMC free article] [PubMed] [Google Scholar]
- 11.Loey M, Smarandache F, M Khalifa NE. Within the lack of chest covid-19 x-ray dataset: a novel detection model based on gan and deep transfer learning. Symmetry. 2020;12(4):651. doi: 10.3390/sym12040651. [DOI] [Google Scholar]
- 12.Singh D, Kumar V, Kaur M. Classification of COVID-19 patients from chest CT images using multi-objective differential evolution–based convolutional neural networks. Eur J Clin Microbiol Infect Dis. 2020;39:1379–1389. doi: 10.1007/s10096-020-03901-z. [DOI] [PMC free article] [PubMed] [Google Scholar]
- 13.Ko H, Chung H, Kang WS, Kim KW, Shin Y, Kang SJ, Lee JH, Kim YJ, Kim NY, Jung H, et al. Covid-19 pneumonia diagnosis using a simple 2d deep learning framework with a single chest ct image: model development and validation. J Med Internet Res. 2020;22(6):e19,569. doi: 10.2196/19569. [DOI] [PMC free article] [PubMed] [Google Scholar]
- 14.Luz E, Silva PL, Silva R, Moreira G (2020) Towards an efficient deep learning model for covid-19 patterns detection in x-ray images. arXiv:200405717
- 15.Panwar H, Gupta P, Siddiqui MK, Morales-Menendez R, Singh V. Application of deep learning for fast detection of covid-19 in x-rays using ncovnet. Chaos Solitons Fractals. 2020;88:109944. doi: 10.1016/j.chaos.2020.109944. [DOI] [PMC free article] [PubMed] [Google Scholar]
- 16.Qin C, Yao D, Shi Y, Song Z. Computer-aided detection in chest radiography based on artificial intelligence: a survey. Biomed Eng Online. 2018;17(1):113. doi: 10.1186/s12938-018-0544-y. [DOI] [PMC free article] [PubMed] [Google Scholar]
- 17.Simonyan K, Zisserman A (2014) Very deep convolutional networks for large-scale image recognition. arXiv:14091556
- 18.Woo S, Park J, Lee JY, So Kweon I (2018) Cbam: convolutional block attention module. In: European conference on computer vision (ECCV), pp 3–19
- 19.Kumar N, Sukavanam N. Deep network architecture for large scale visua detection and recognition issues. J Inf Assur Secur. 2017;12(6):201–208. [Google Scholar]
- 20.Selvaraju RR, Cogswell M, Das A, Vedantam R, Parikh D, Batra D (2017) Grad-cam: visual explanations from deep networks via gradient-based localization. In: Proceedings of the IEEE international conference on computer vision (ICCV), pp 618–626
- 21.Sitaula C, Xiang Y, Basnet A, Aryal S, Lu X (2020) Hdf: hybrid deep features for scene image representation. In: To appear in international joint conference on neural networks (IJCNN)
- 22.Chouhan V, Singh SK, Khamparia A, Gupta D, Tiwari P, Moreira C, Damaševičius R, de Albuquerque VHC. A novel transfer learning based approach for pneumonia detection in chest x-ray images. Appl Sci. 2020;10(2):559. doi: 10.3390/app10020559. [DOI] [Google Scholar]
- 23.Deng J, Dong W, Socher R, Li L J, Li K, Fei-Fei L (2009) ImageNet: a large-scale hierarchical image database. Proceedings of the IEEE conference on computer vision and pattern recognition (CVPR)
- 24.Zhou B, Khosla A, Lapedriza A, Torralba A, Oliva A (2016) Places: an image database for deep scene understanding. arXiv:161002055 [DOI] [PubMed]
- 25.Oliva A, Torralba A. Modeling the shape of the scene: a holistic representation of the spatial envelope. Int J Comput Vis. 2001;42(3):145–175. doi: 10.1023/A:1011139631724. [DOI] [Google Scholar]
- 26.Oliva A (2005) Gist of the scene. In: Neurobiology of attention. Elsevier, pp 251–256
- 27.Lowe DG. Distinctive image features from scale-invariant keypoints. Int J Comput Vis. 2004;60(2):91–110. doi: 10.1023/B:VISI.0000029664.99615.94. [DOI] [Google Scholar]
- 28.Dalal N, Triggs B (2005) Histograms of oriented gradients for human detection. In: Proceedings of the IEEE Computer Society conference on computer vision and pattern recognition (CVPR), pp 886–893
- 29.Lazebnik S, Schmid C, Ponce J (2006) Beyond bags of features: Spatial pyramid matching for recognizing natural scene categories. In: Proceedings of the IEEE Computer Society conference on computer vision and pattern recognition (CVPR), pp 2169–2178
- 30.Stephen O, Sain M, Maduh UJ, Jeong D-U. An efficient deep learning approach to pneumonia classification in healthcare. J Healthc Eng. 2019;2019:1–7. doi: 10.1155/2019/4180949. [DOI] [PMC free article] [PubMed] [Google Scholar]
- 31.Sasaki T, Kinoshita K, Kishida S, Hirata Y, Yamada S. Ensemble learning in systems of neural networks for detection of abnormal shadows from x-ray images of lungs. J Signal Process. 2012;16(4):343–346. doi: 10.2299/jsp.16.343. [DOI] [Google Scholar]
- 32.Narin A, Kaya C, Pamuk Z (2020) Automatic detection of coronavirus disease (covid-19) using x-ray images and deep convolutional neural networks. arXiv:200310849 [DOI] [PMC free article] [PubMed]
- 33.Krizhevsky A, Sutskever I, Hinton GE (2012) Imagenet classification with deep convolutional neural networks. In: Proceedings on advances in neural information processing systems (NIPS), pp 1097–1105
- 34.Szegedy C, Liu W, Jia Y, Sermanet P, Reed S, Anguelov D, Erhan D, Vanhoucke V, Rabinovich A (2015) Going deeper with convolutions. In: Proceedings of the IEEE conference on computer vision and pattern recognition (CVPR), pp 1–9
- 35.He K, Zhang X, Ren S, Sun J (2016) Deep residual learning for image recognition. In: Proceedings of the IEEE conference on computer vision and pattern recognition (CVPR), pp 770– 778
- 36.Goodfellow I, Pouget-Abadie J, Mirza M, Xu B, Warde-Farley D, Ozair S, Courville A, Bengio Y (2014) Generative adversarial nets. In: Proceedings on advances in neural information processing systems (NIPS), pp 2672–2680
- 37.Chollet F (2017) Xception: deep learning with depthwise separable convolutions. In: Proceedings of the IEEE conference on computer vision and pattern recognition (CVPR), pp 1251– 1258
- 38.Redmon J, Farhadi A (2017) Yolo9000: better, faster, stronger. In: Proceedings of the IEEE conference on computer vision and pattern recognition (CVPR), pp 7263–7271
- 39.Tan M, Le QV (2019) Efficientnet: rethinking model scaling for convolutional neural networks. arXiv:190511946
- 40.Civit-Masot J, Luna-Perejón F, Domínguez Morales M, Civit A. Deep learning system for covid-19 diagnosis aid using x-ray pulmonary images. Appl Sci. 2020;10(13):4640. doi: 10.3390/app10134640. [DOI] [Google Scholar]
- 41.Zhou ZH, Jiang Y, Yang YB, Chen SF. Lung cancer cell identification based on artificial neural network ensembles. Artif Intell Med. 2002;24(1):25–36. doi: 10.1016/S0933-3657(01)00094-X. [DOI] [PubMed] [Google Scholar]
- 42.Li C, Zhu G, Wu X, Wang Y. False-positive reduction on lung nodules detection in chest radiographs by ensemble of convolutional neural networks. IEEE Access. 2018;6:16:060–16: 067. doi: 10.1109/ACCESS.2018.2817023. [DOI] [Google Scholar]
- 43.Islam SR, Maity SP, Ray AK, Mandal M (2019) Automatic detection of pneumonia on compressed sensing images using deep learning. In: Proceedings on the Canadian conference of electrical and computer engineering (CCECE), pp 1–4
- 44.Chollet F et al (2015) Keras. https://github.com/fchollet/keras
- 45.Rossum G (1995) Python reference manual. Tech rep., Amsterdam
- 46.Szegedy C, Vanhoucke V, Ioffe S, Shlens J, Wojna Z (2016) Rethinking the inception architecture for computer vision. In: Proceedings of the IEEE conference on computer vision and pattern recognition (CVPR), pp 2818–2826
- 47.Huang G, Liu Z, Van Der Maaten L, Weinberger KQ (2017) Densely connected convolutional networks. In: Proceedings of the IEEE conference on computer vision and pattern recognition (CVPR), pp 4700–4708
- 48.Szegedy C, Ioffe S, Vanhoucke V, Alemi A A (2017) Inception-v4 inception-resnet and the impact of residual connections on learning. In: Proceedings on the thirty-first AAAI conference on artificial intelligence (AAAI)
- 49.Howard AG, Zhu M, Chen B, Kalenichenko D, Wang W, Weyand T, Andreetto M, Adam H (2017) Mobilenets: efficient convolutional neural networks for mobile vision applications. arXiv:170404861


